| Param | Original file | Final file |
|---|---|---|
| Filename | modeM0/AS1A09_047T01_9000003714_25412cztM0_level2.evt | modeM0/AS1A09_047T01_9000003714_25412cztM0_level2_quad_clean.evt |
| Size (bytes) | 496,097,280 | 67,812,480 |
| Size | 473.1 MB | 64.7 MB |
| Events in quadrant A | 3,171,674 | 408,270 |
| Events in quadrant B | 3,224,371 | 412,054 |
| Events in quadrant C | 3,250,715 | 393,182 |
| Events in quadrant D | 4,926,714 | 376,178 |
| Mode M9 | |||
|---|---|---|---|
| Quadrant | BADHDUFLAG | Total packets | Discarded packets |
| A | 0 | 9 | 0 |
| B | 0 | 9 | 0 |
| C | 0 | 9 | 0 |
| D | 0 | 9 | 0 |
| Mode M0 | |||
|---|---|---|---|
| Quadrant | BADHDUFLAG | Total packets | Discarded packets |
| A | 0 | 13529 | 0 |
| B | 0 | 13600 | 0 |
| C | 0 | 13727 | 0 |
| D | 0 | 19088 | 0 |
| Quadrant | Total seconds | Saturated seconds | Saturation percentage |
|---|---|---|---|
| A | 6640 | 33 | 0.496988% |
| B | 6641 | 50 | 0.752899% |
| C | 6641 | 64 | 0.963710% |
| D | 6641 | 224 | 3.372986% |
Noise dominated data is calculated using 1-second bins in cleaned event files. If a bin has >2000 counts, and if more than 50% of those come from <1% of pixels, then it is considered to be noise-dominated and hence unusable.
| Quadrant | # 1 sec bins | Bins with >0 counts | Bins with >2000 counts | High rate bins dominated by noise | Noise dominated (total time) | Noise dominated (detector-on time) | Marked lightcurve |
|---|---|---|---|---|---|---|---|
| A | 7520 | 6640 | 0 | 0 | 0.00% | 0.00% | 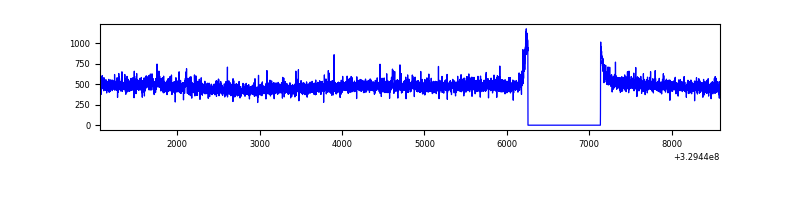 |
| B | 7521 | 6641 | 1 | 1 | 0.01% | 0.02% | 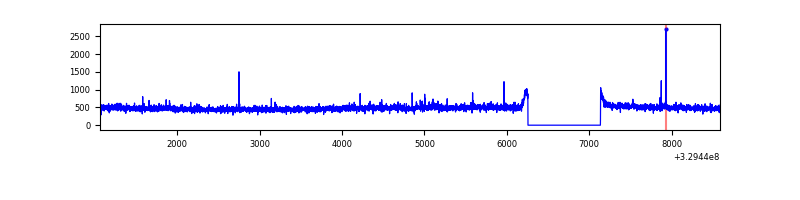 |
| C | 7521 | 6641 | 0 | 0 | 0.00% | 0.00% | 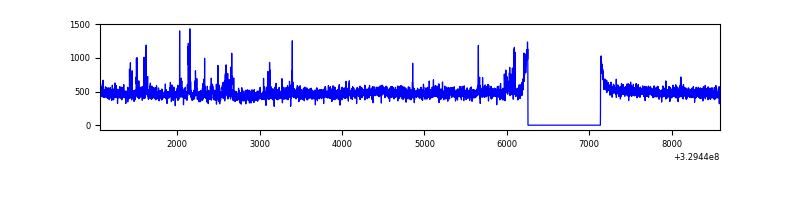 |
| D | 7521 | 6641 | 185 | 185 | 2.46% | 2.79% | 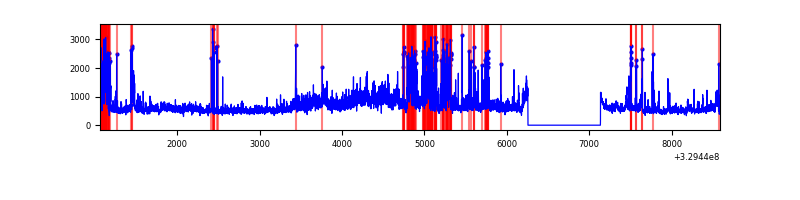 |
Top three noisy pixels from each quadrant. If the there are fewer than three noisy pixels in the level2.evt file, extra rows are filled as -1
| Pixel properties | Quadrant properties | ||||||
|---|---|---|---|---|---|---|---|
| Quadrant | DetID | PixID | Counts | Sigma | Mean | Median | Sigma |
| A | 6 | 16 | 44819 | 271.95 | 811 | 794 | 161.9 |
| A | 13 | 254 | 9573 | 54.23 | 811 | 794 | 161.9 |
| A | 3 | 137 | 7662 | 42.43 | 811 | 794 | 161.9 |
| B | 3 | 112 | 26974 | 171.12 | 804 | 782 | 153.1 |
| B | 0 | 229 | 24729 | 156.46 | 804 | 782 | 153.1 |
| B | 12 | 111 | 19067 | 119.46 | 804 | 782 | 153.1 |
| C | 14 | 238 | 125050 | 688.16 | 771 | 774 | 180.6 |
| C | 7 | 247 | 115885 | 637.41 | 771 | 774 | 180.6 |
| C | 13 | 61 | 5365 | 25.42 | 771 | 774 | 180.6 |
| D | 8 | 195 | 1045047 | 5584.95 | 774 | 750 | 187.0 |
| D | 12 | 233 | 467663 | 2497.07 | 774 | 750 | 187.0 |
| D | 7 | 238 | 229618 | 1224.0 | 774 | 750 | 187.0 |
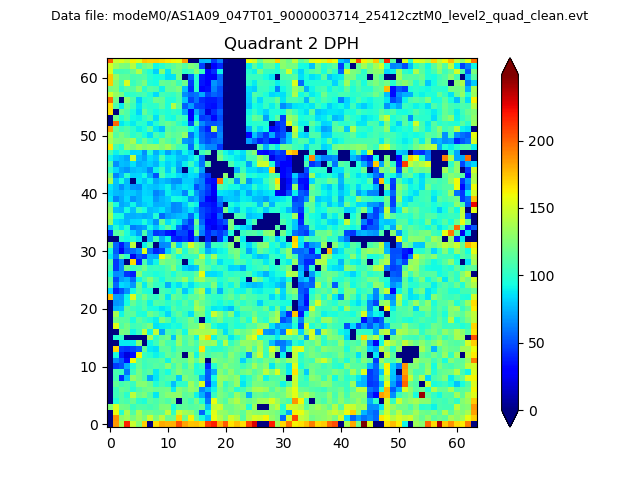
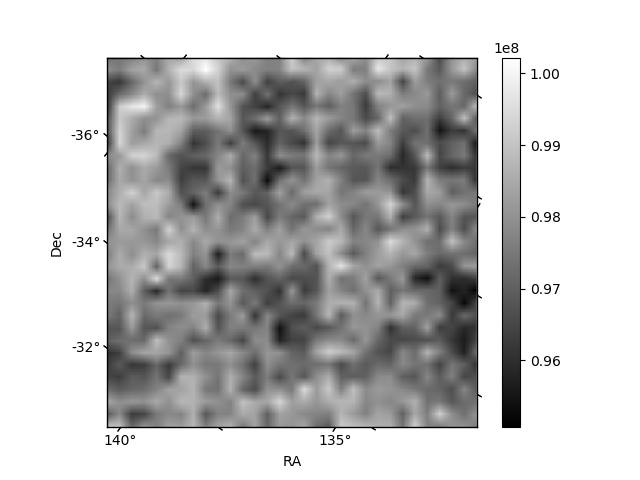
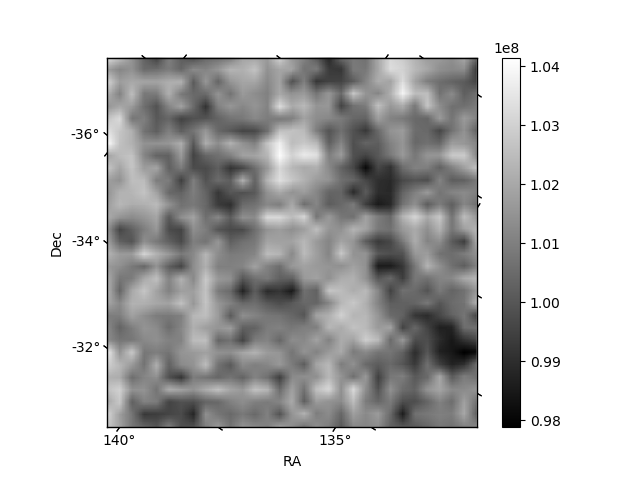
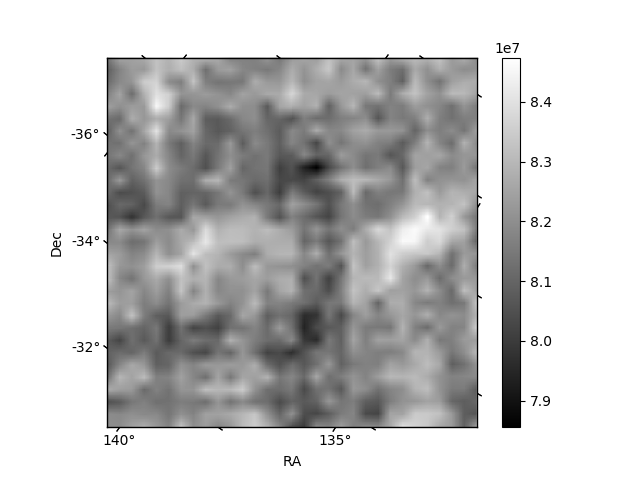
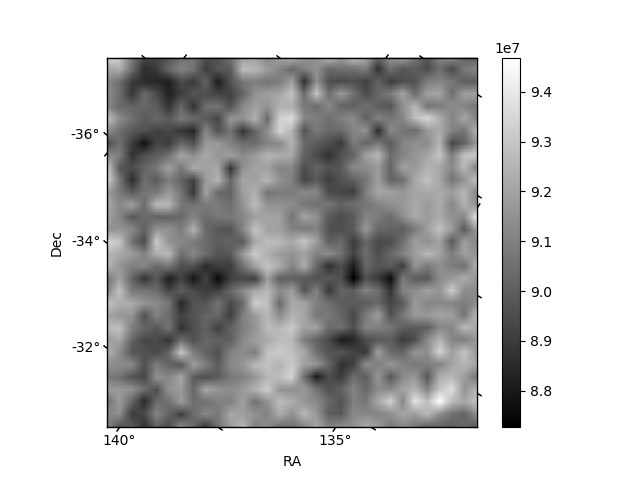
Histogram calculated using DETX and DETY for each event in the final _common_clean file
| Quadrant A | 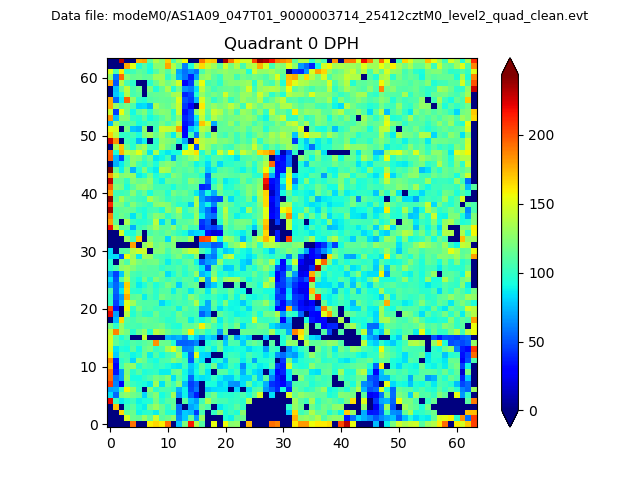 |
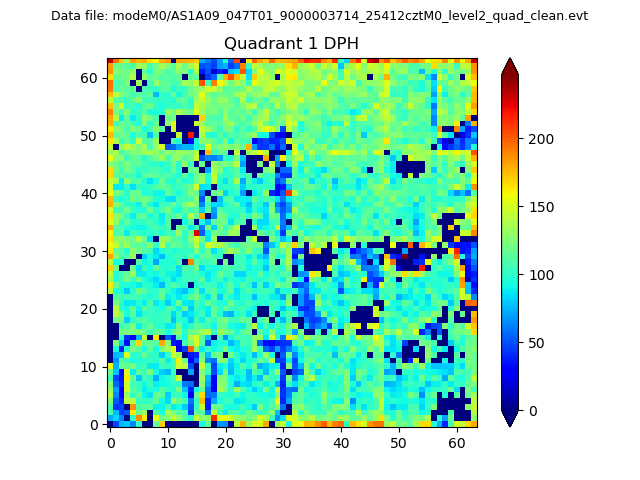 |
Quadrant B |
|---|---|---|---|
| Quadrant D | 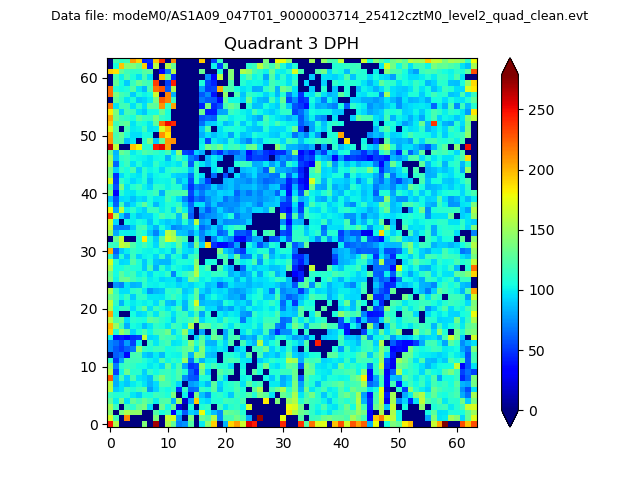 |
 |
Quadrant C |
| Plot type | Count rate plots | Images |
|---|---|---|
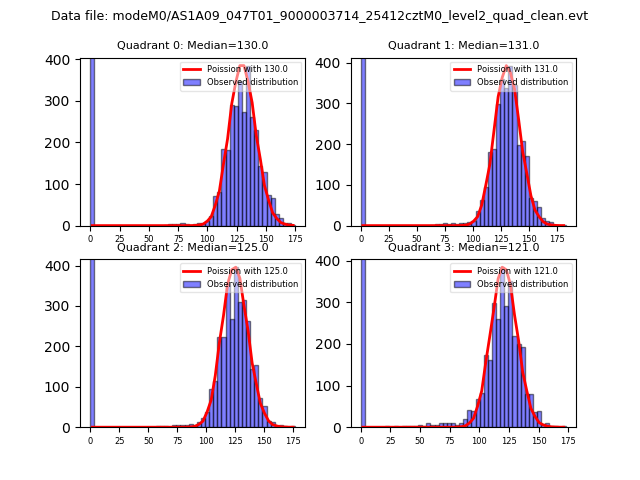
| Comparison with Poisson distribution Blue bars denote a histogram of data divided into 1 sec bins. Red curve is a Poisson curve with rate = median count rate of data. |
 |
 |
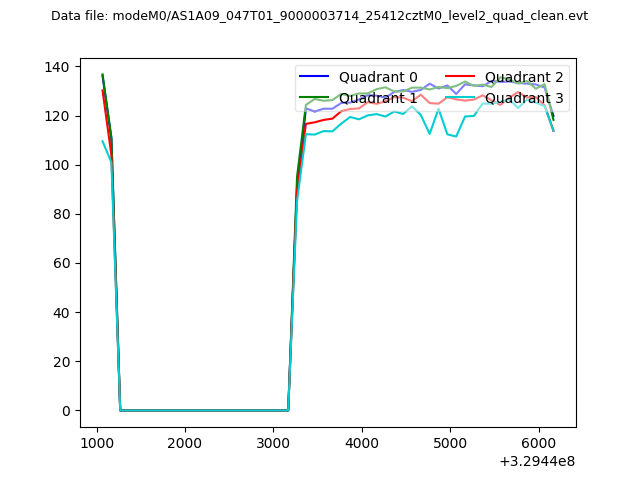
| Quadrant-wise count rates Data is divided into 100 sec bins |
 |
|
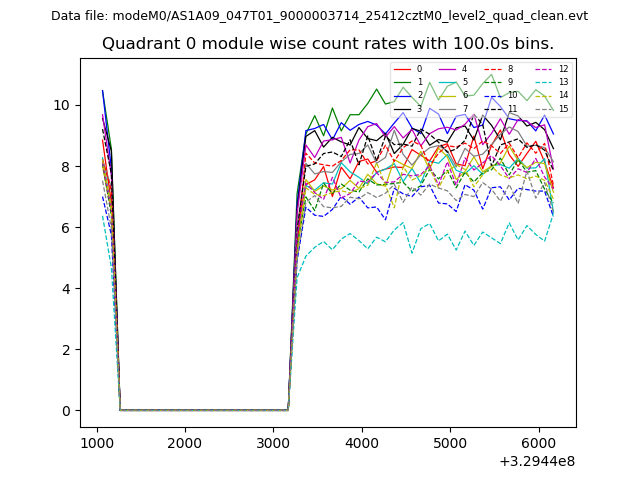
| Module-wise count rates for Quadrant A Data is divided into 100 sec bins |
 |
 |
| Module-wise count rates for Quadrant B Data is divided into 100 sec bins |
 |
 |
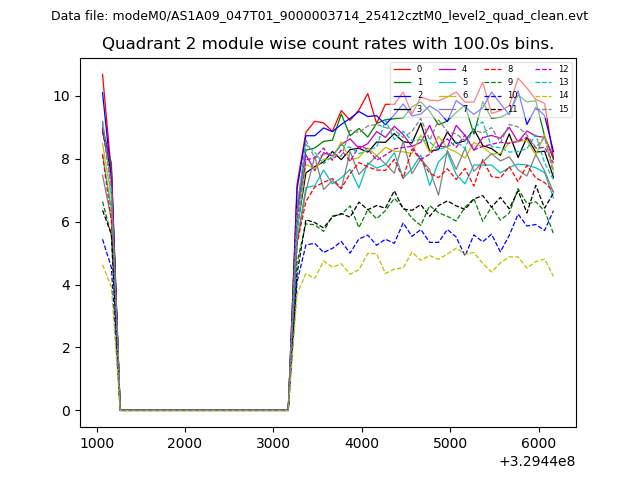
| Module-wise count rates for Quadrant C Data is divided into 100 sec bins |
 |
 |
| Module-wise count rates for Quadrant D Data is divided into 100 sec bins |
 |
 |
| Parameter | Plot |
|---|---|
| CZT HV Monitor | 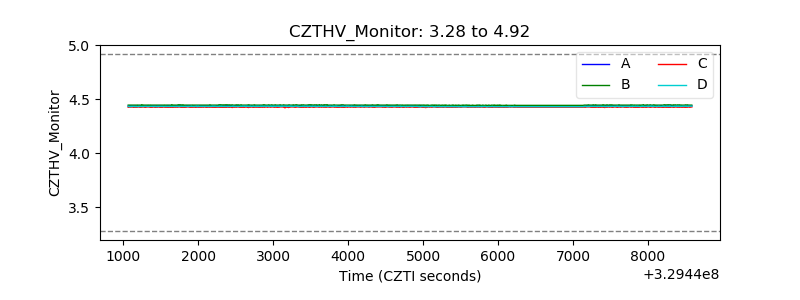 |
| D_VDD | 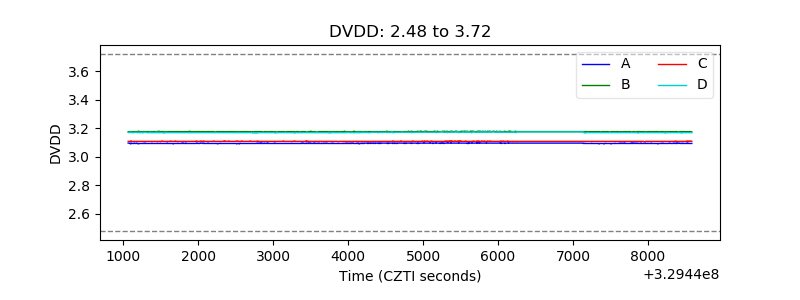 |
| Temperature 1 | 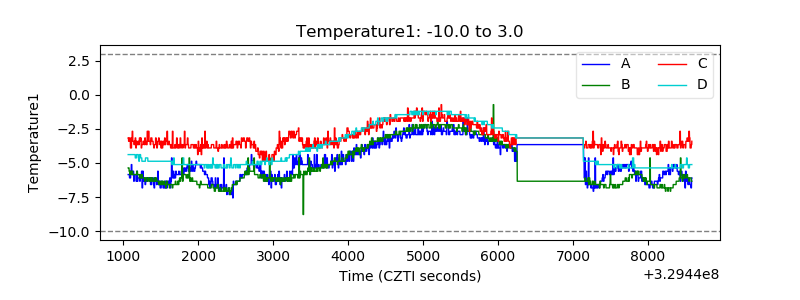 |
| Veto HV Monitor | 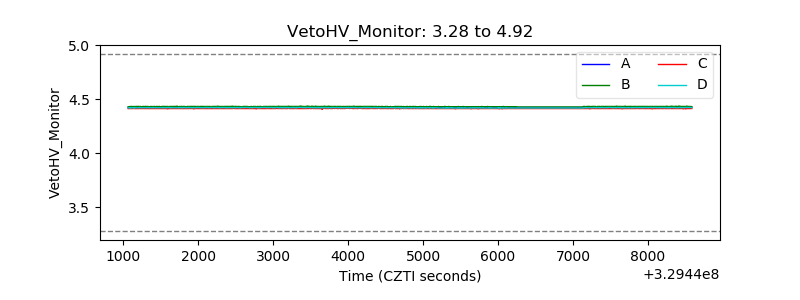 |
| Veto LLD |  |
| Alpha Counter | 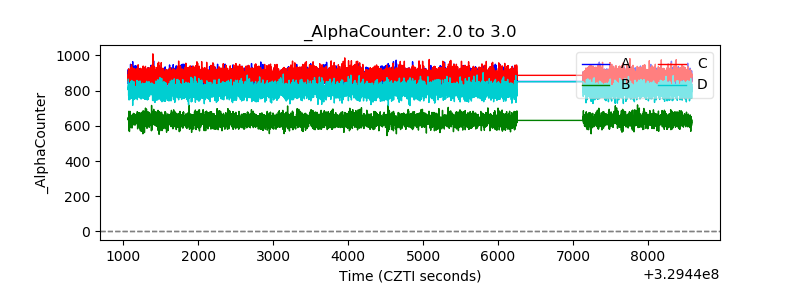 |
| _CPM_Rate | 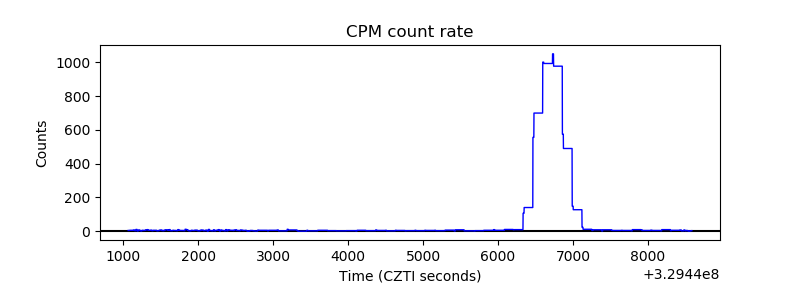 |
| CZT Counter | 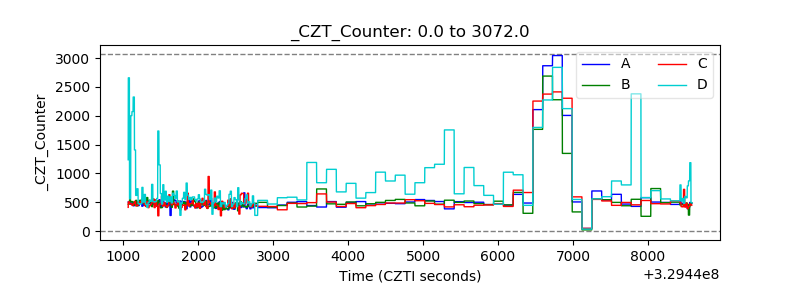 |
| +2.5 Volts monitor |  |
| +5 Volts monitor |  |
| _ROLL_ROT |  |
| _Roll_DEC | 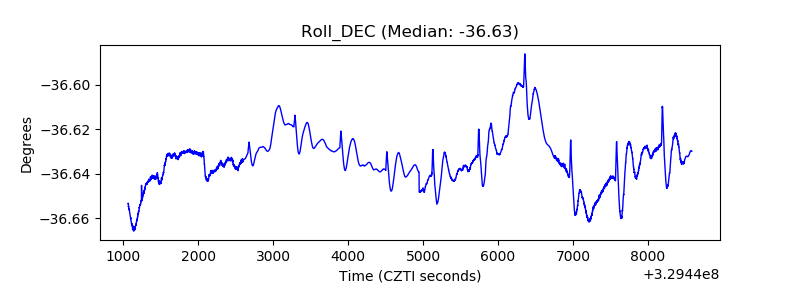 |
| _Roll_RA | 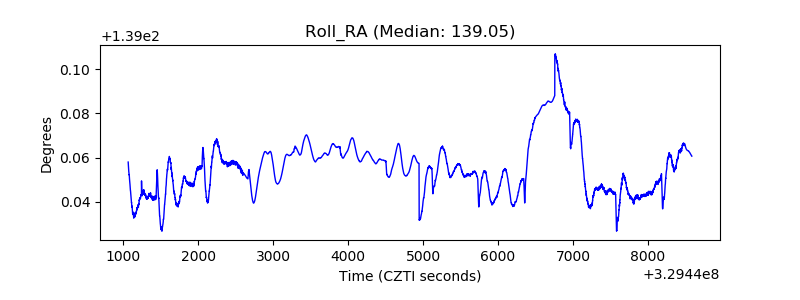 |
| Veto Counter |  |