| Param | Original file | Final file |
|---|---|---|
| Filename | modeM0/AS1A09_047T01_9000003714_25413cztM0_level2.evt | modeM0/AS1A09_047T01_9000003714_25413cztM0_level2_quad_clean.evt |
| Size (bytes) | 532,532,160 | 69,217,920 |
| Size | 507.9 MB | 66.0 MB |
| Events in quadrant A | 3,249,667 | 424,539 |
| Events in quadrant B | 3,334,684 | 428,765 |
| Events in quadrant C | 3,317,376 | 409,566 |
| Events in quadrant D | 5,780,162 | 374,016 |
| Mode M9 | |||
|---|---|---|---|
| Quadrant | BADHDUFLAG | Total packets | Discarded packets |
| A | 0 | 16 | 0 |
| B | 0 | 17 | 0 |
| C | 0 | 17 | 0 |
| D | 0 | 17 | 0 |
| Mode M0 | |||
|---|---|---|---|
| Quadrant | BADHDUFLAG | Total packets | Discarded packets |
| A | 0 | 13619 | 0 |
| B | 0 | 13785 | 0 |
| C | 0 | 13858 | 0 |
| D | 0 | 21734 | 0 |
| Quadrant | Total seconds | Saturated seconds | Saturation percentage |
|---|---|---|---|
| A | 6578 | 29 | 0.440863% |
| B | 6578 | 47 | 0.714503% |
| C | 6577 | 74 | 1.125133% |
| D | 6577 | 387 | 5.884142% |
Noise dominated data is calculated using 1-second bins in cleaned event files. If a bin has >2000 counts, and if more than 50% of those come from <1% of pixels, then it is considered to be noise-dominated and hence unusable.
| Quadrant | # 1 sec bins | Bins with >0 counts | Bins with >2000 counts | High rate bins dominated by noise | Noise dominated (total time) | Noise dominated (detector-on time) | Marked lightcurve |
|---|---|---|---|---|---|---|---|
| A | 7638 | 6578 | 0 | 0 | 0.00% | 0.00% | 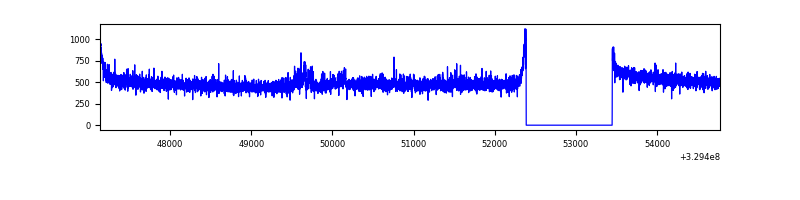 |
| B | 7638 | 6578 | 1 | 1 | 0.01% | 0.02% | 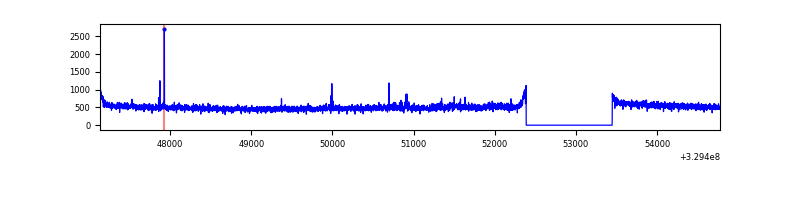 |
| C | 7637 | 6577 | 0 | 0 | 0.00% | 0.00% | 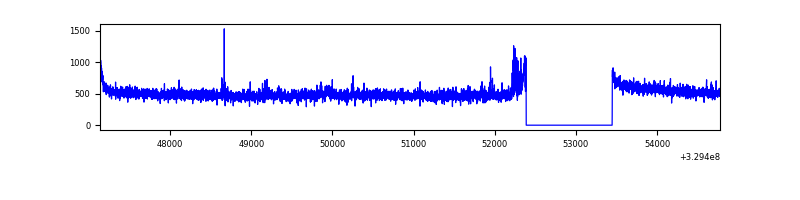 |
| D | 7637 | 6577 | 358 | 358 | 4.69% | 5.44% | 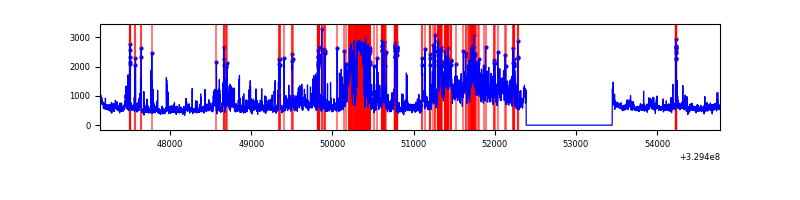 |
Top three noisy pixels from each quadrant. If the there are fewer than three noisy pixels in the level2.evt file, extra rows are filled as -1
| Pixel properties | Quadrant properties | ||||||
|---|---|---|---|---|---|---|---|
| Quadrant | DetID | PixID | Counts | Sigma | Mean | Median | Sigma |
| A | 6 | 16 | 25345 | 147.64 | 834 | 819 | 166.1 |
| A | 13 | 254 | 10342 | 57.33 | 834 | 819 | 166.1 |
| A | 3 | 137 | 7640 | 41.06 | 834 | 819 | 166.1 |
| B | 0 | 229 | 50627 | 319.29 | 828 | 806 | 156.0 |
| B | 3 | 112 | 23758 | 147.09 | 828 | 806 | 156.0 |
| B | 12 | 111 | 19238 | 118.13 | 828 | 806 | 156.0 |
| C | 14 | 238 | 130525 | 699.48 | 796 | 801 | 185.5 |
| C | 7 | 247 | 78683 | 419.94 | 796 | 801 | 185.5 |
| C | 13 | 61 | 5482 | 25.24 | 796 | 801 | 185.5 |
| D | 1 | 52 | 1497066 | 7881.57 | 785 | 761 | 189.8 |
| D | 8 | 195 | 593828 | 3123.9 | 785 | 761 | 189.8 |
| D | 7 | 238 | 527355 | 2773.76 | 785 | 761 | 189.8 |
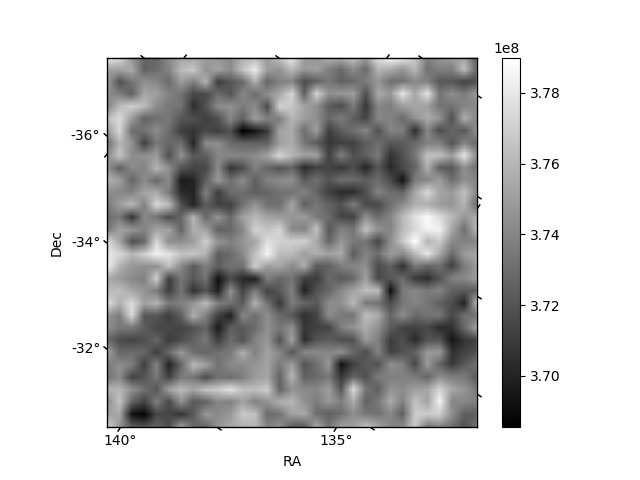
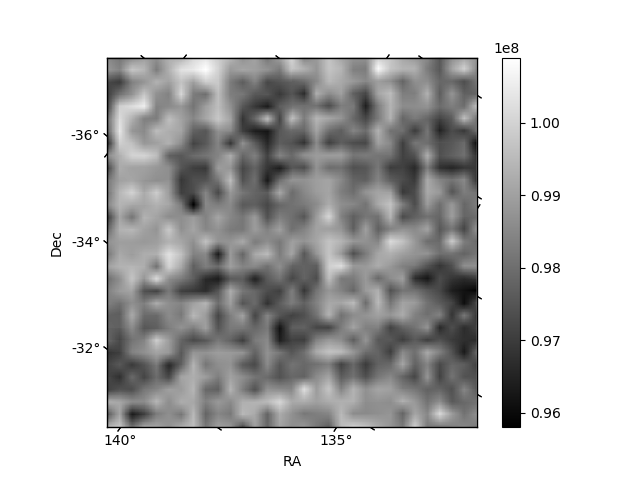
Histogram calculated using DETX and DETY for each event in the final _common_clean file
| Quadrant A | 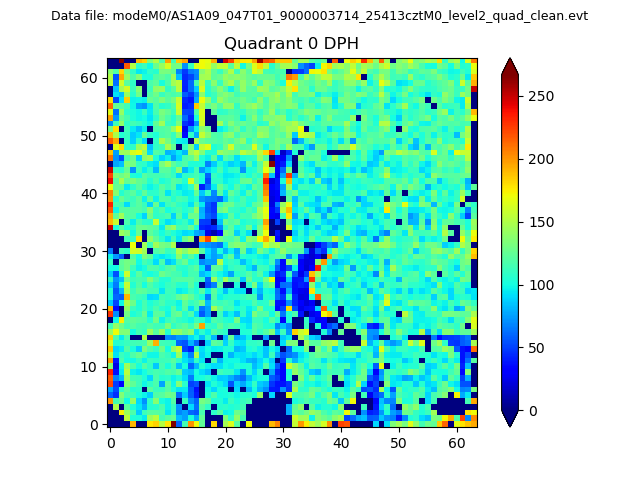 |
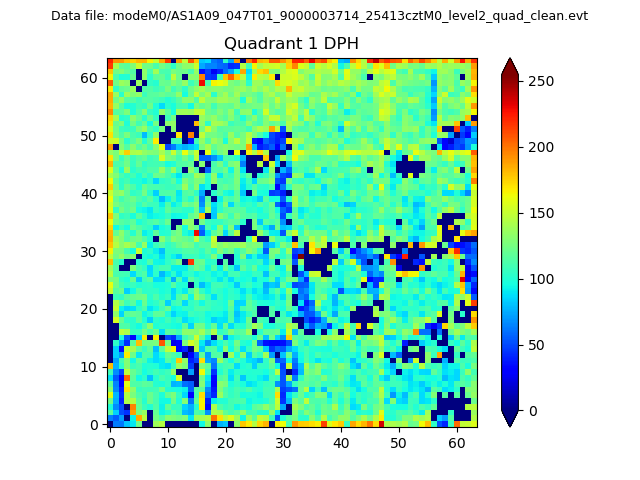 |
Quadrant B |
|---|---|---|---|
| Quadrant D | 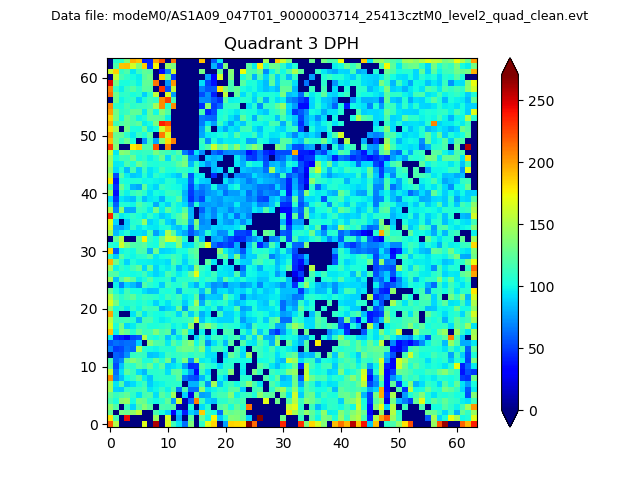 |
 |
Quadrant C |
| Plot type | Count rate plots | Images |
|---|---|---|
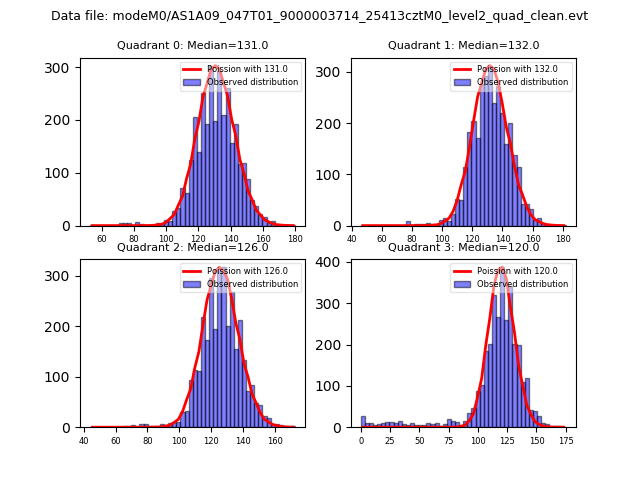
| Comparison with Poisson distribution Blue bars denote a histogram of data divided into 1 sec bins. Red curve is a Poisson curve with rate = median count rate of data. |
 |
 |
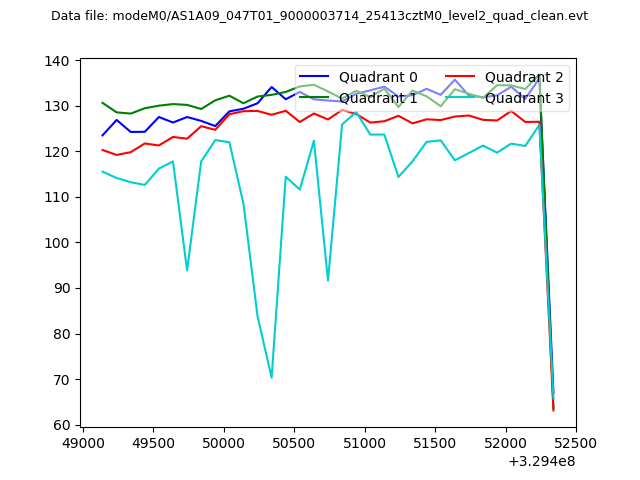
| Quadrant-wise count rates Data is divided into 100 sec bins |
 |
|
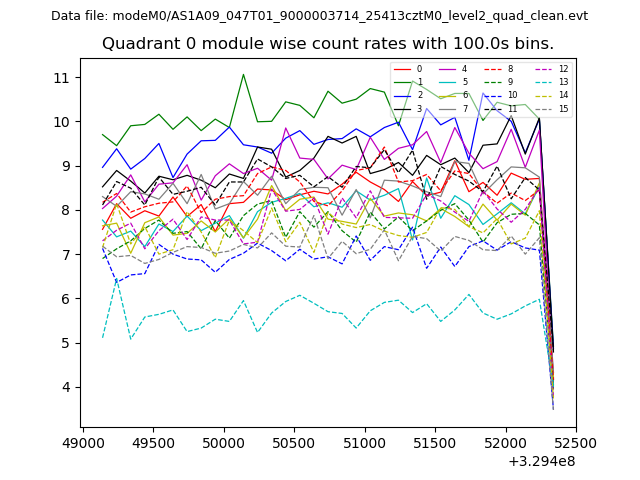
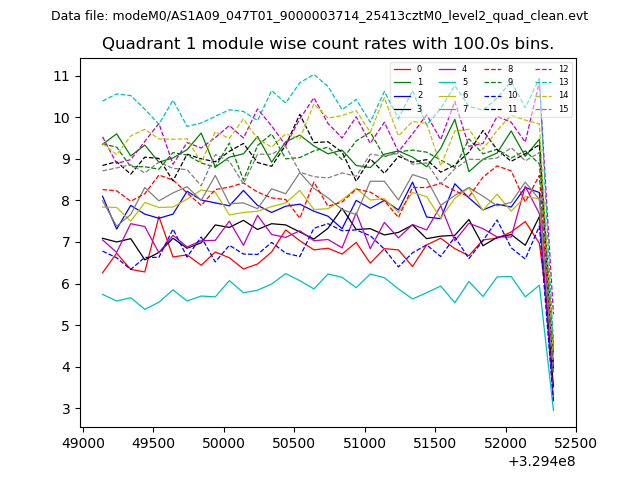
| Module-wise count rates for Quadrant A Data is divided into 100 sec bins |
 |
 |
| Module-wise count rates for Quadrant B Data is divided into 100 sec bins |
 |
 |
| Module-wise count rates for Quadrant C Data is divided into 100 sec bins |
 |
 |
| Module-wise count rates for Quadrant D Data is divided into 100 sec bins |
 |
 |
| Parameter | Plot |
|---|---|
| CZT HV Monitor | 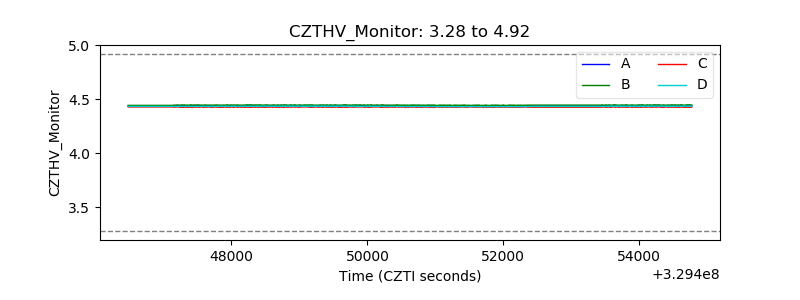 |
| D_VDD | 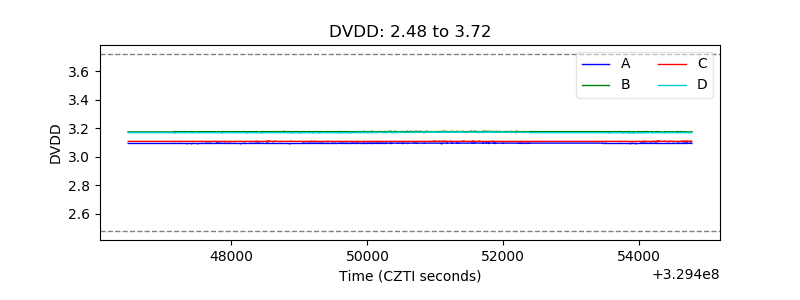 |
| Temperature 1 | 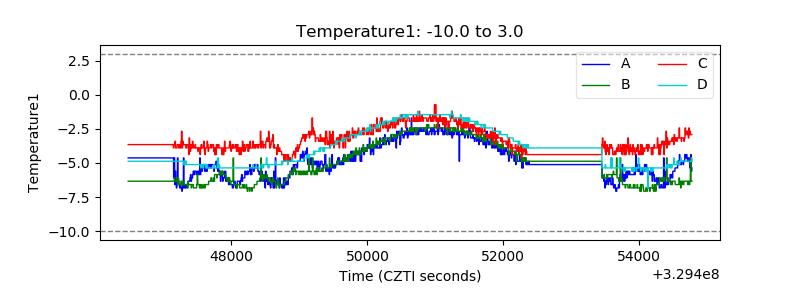 |
| Veto HV Monitor | 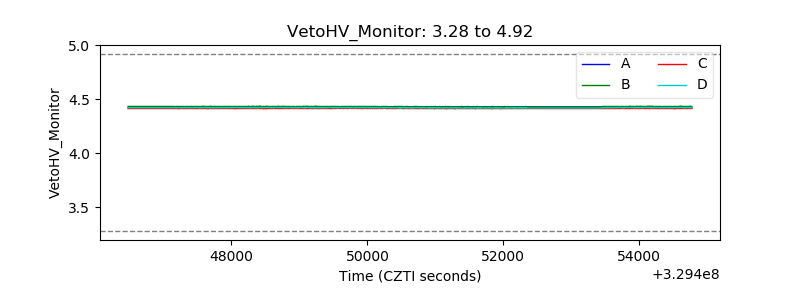 |
| Veto LLD |  |
| Alpha Counter | 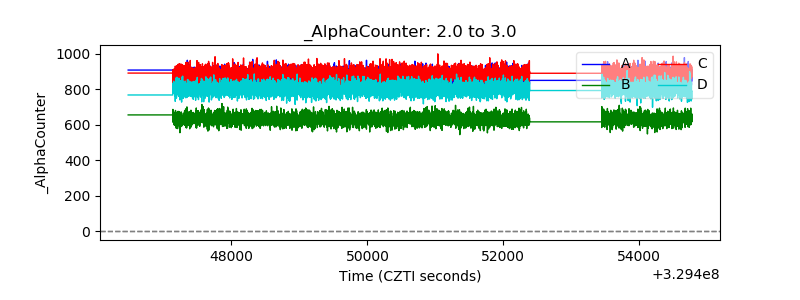 |
| _CPM_Rate | 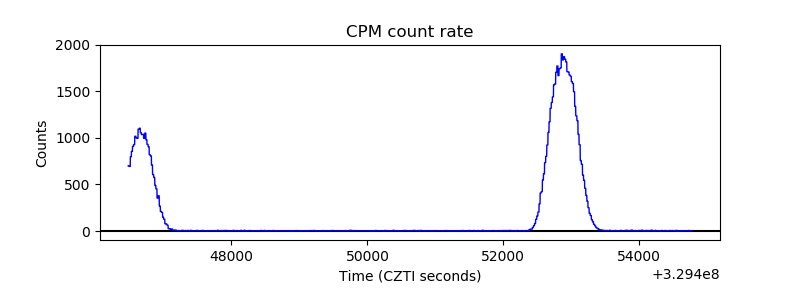 |
| CZT Counter | 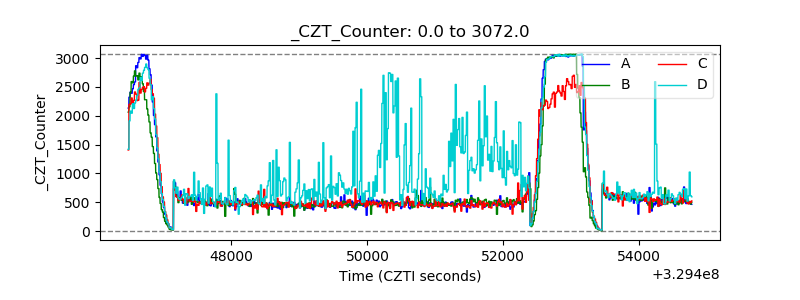 |
| +2.5 Volts monitor |  |
| +5 Volts monitor |  |
| _ROLL_ROT | 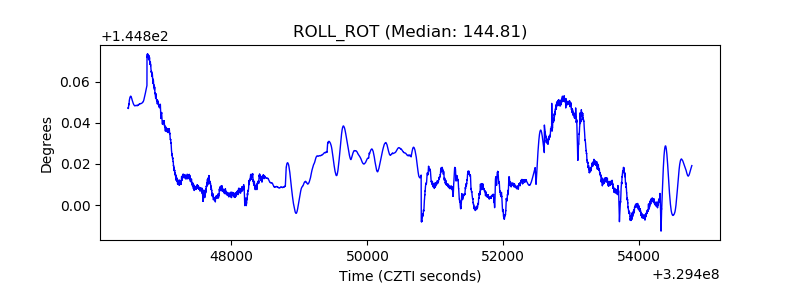 |
| _Roll_DEC | 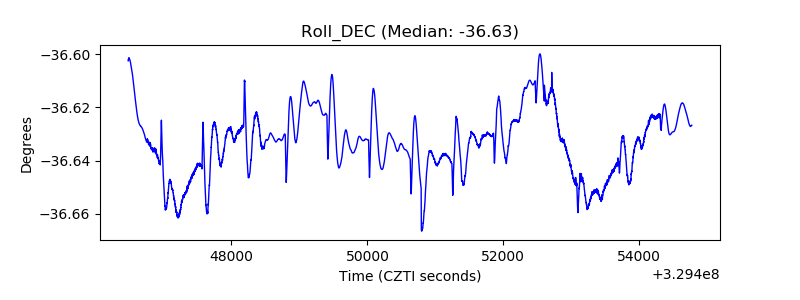 |
| _Roll_RA | 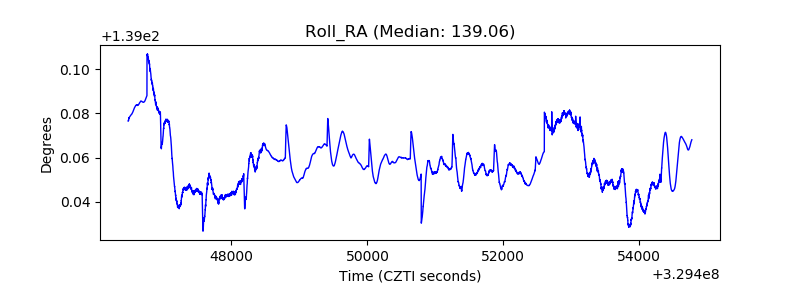 |
| Veto Counter |  |