| Param | Original file | Final file |
|---|---|---|
| Filename | modeM0/AS1A09_047T01_9000003714_25415cztM0_level2.evt | modeM0/AS1A09_047T01_9000003714_25415cztM0_level2_quad_clean.evt |
| Size (bytes) | 529,142,400 | 85,357,440 |
| Size | 504.6 MB | 81.4 MB |
| Events in quadrant A | 3,468,920 | 542,107 |
| Events in quadrant B | 3,513,497 | 548,274 |
| Events in quadrant C | 3,512,816 | 525,905 |
| Events in quadrant D | 5,082,482 | 508,313 |
| Mode M9 | |||
|---|---|---|---|
| Quadrant | BADHDUFLAG | Total packets | Discarded packets |
| A | 0 | 13 | 0 |
| B | 0 | 14 | 0 |
| C | 0 | 14 | 0 |
| D | 0 | 14 | 0 |
| Mode M0 | |||
|---|---|---|---|
| Quadrant | BADHDUFLAG | Total packets | Discarded packets |
| A | 0 | 14303 | 0 |
| B | 0 | 14435 | 0 |
| C | 0 | 14590 | 0 |
| D | 0 | 19720 | 0 |
| Quadrant | Total seconds | Saturated seconds | Saturation percentage |
|---|---|---|---|
| A | 6599 | 60 | 0.909229% |
| B | 6599 | 79 | 1.197151% |
| C | 6599 | 130 | 1.969995% |
| D | 6599 | 188 | 2.848917% |
Noise dominated data is calculated using 1-second bins in cleaned event files. If a bin has >2000 counts, and if more than 50% of those come from <1% of pixels, then it is considered to be noise-dominated and hence unusable.
| Quadrant | # 1 sec bins | Bins with >0 counts | Bins with >2000 counts | High rate bins dominated by noise | Noise dominated (total time) | Noise dominated (detector-on time) | Marked lightcurve |
|---|---|---|---|---|---|---|---|
| A | 7754 | 6599 | 2 | 2 | 0.03% | 0.03% | 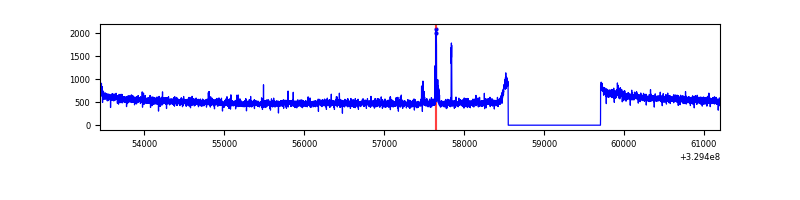 |
| B | 7754 | 6599 | 1 | 1 | 0.01% | 0.02% | 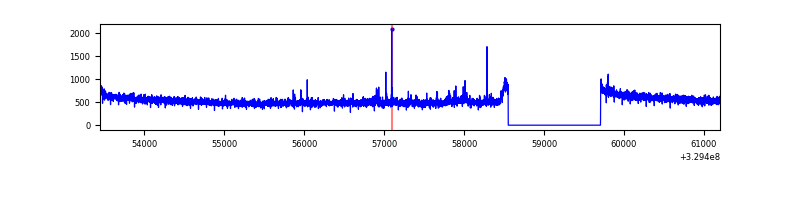 |
| C | 7754 | 6599 | 0 | 0 | 0.00% | 0.00% | 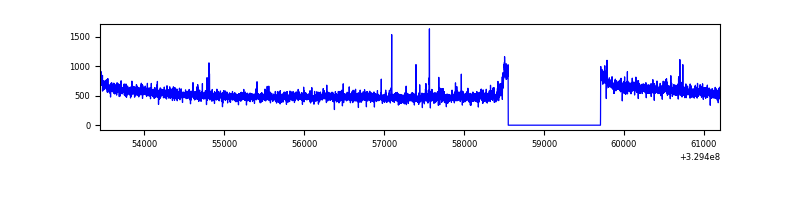 |
| D | 7754 | 6599 | 133 | 133 | 1.72% | 2.02% | 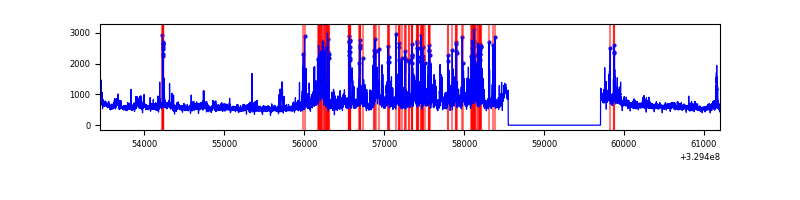 |
Top three noisy pixels from each quadrant. If the there are fewer than three noisy pixels in the level2.evt file, extra rows are filled as -1
| Pixel properties | Quadrant properties | ||||||
|---|---|---|---|---|---|---|---|
| Quadrant | DetID | PixID | Counts | Sigma | Mean | Median | Sigma |
| A | 6 | 16 | 57896 | 323.76 | 885 | 867 | 176.1 |
| A | 13 | 254 | 10712 | 55.89 | 885 | 867 | 176.1 |
| A | 3 | 137 | 7847 | 39.63 | 885 | 867 | 176.1 |
| B | 0 | 229 | 42412 | 257.09 | 874 | 852 | 161.7 |
| B | 3 | 112 | 38770 | 234.56 | 874 | 852 | 161.7 |
| B | 12 | 111 | 19488 | 115.28 | 874 | 852 | 161.7 |
| C | 14 | 238 | 138898 | 709.37 | 848 | 855 | 194.6 |
| C | 7 | 247 | 63755 | 323.23 | 848 | 855 | 194.6 |
| C | 2 | 16 | 7412 | 33.69 | 848 | 855 | 194.6 |
| D | 8 | 195 | 795385 | 3877.01 | 856 | 833 | 204.9 |
| D | 7 | 238 | 588392 | 2866.99 | 856 | 833 | 204.9 |
| D | 1 | 52 | 273543 | 1330.68 | 856 | 833 | 204.9 |
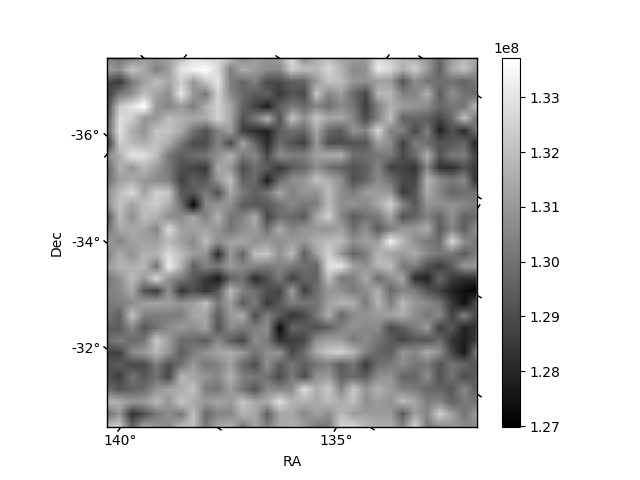
Histogram calculated using DETX and DETY for each event in the final _common_clean file
| Quadrant A | 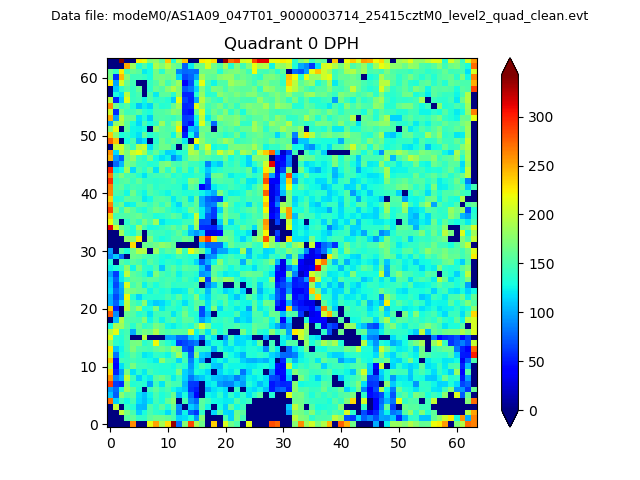 |
 |
Quadrant B |
|---|---|---|---|
| Quadrant D | 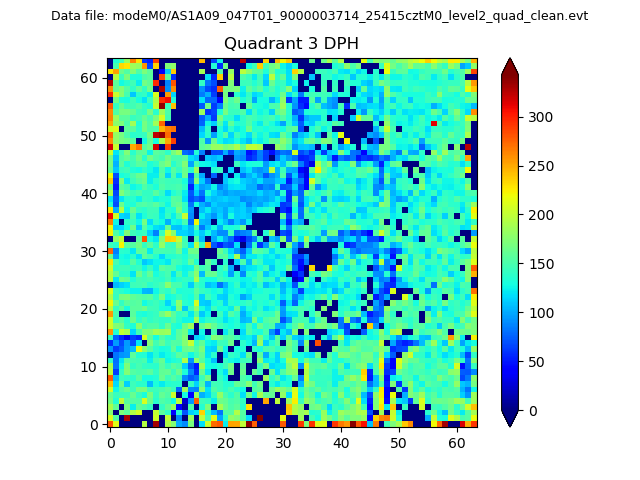 |
 |
Quadrant C |
| Plot type | Count rate plots | Images |
|---|---|---|
| Comparison with Poisson distribution Blue bars denote a histogram of data divided into 1 sec bins. Red curve is a Poisson curve with rate = median count rate of data. |
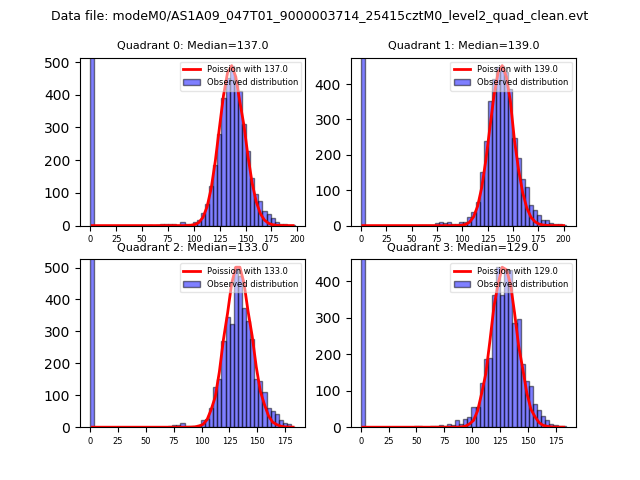 |
 |
| Quadrant-wise count rates Data is divided into 100 sec bins |
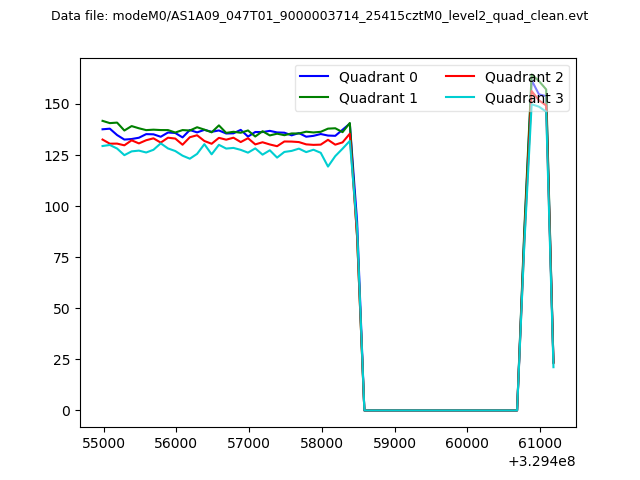 |
|
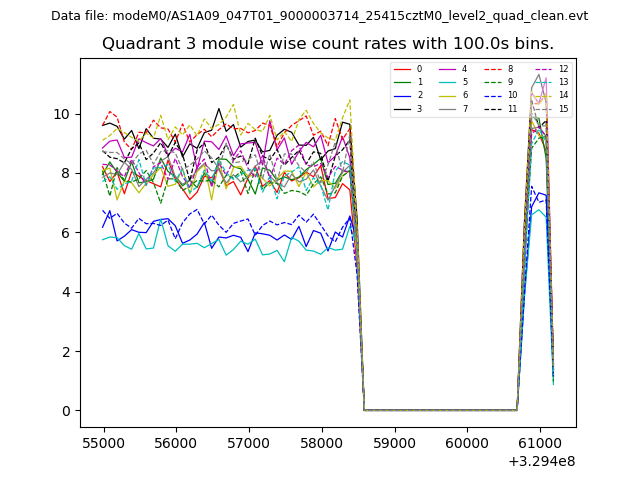
| Module-wise count rates for Quadrant A Data is divided into 100 sec bins |
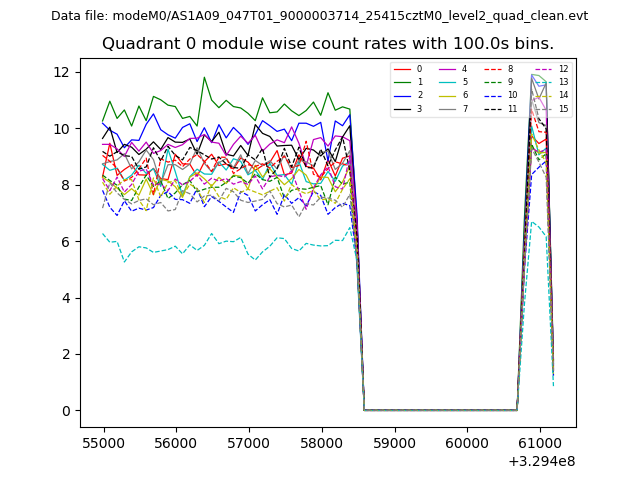 |
 |
| Module-wise count rates for Quadrant B Data is divided into 100 sec bins |
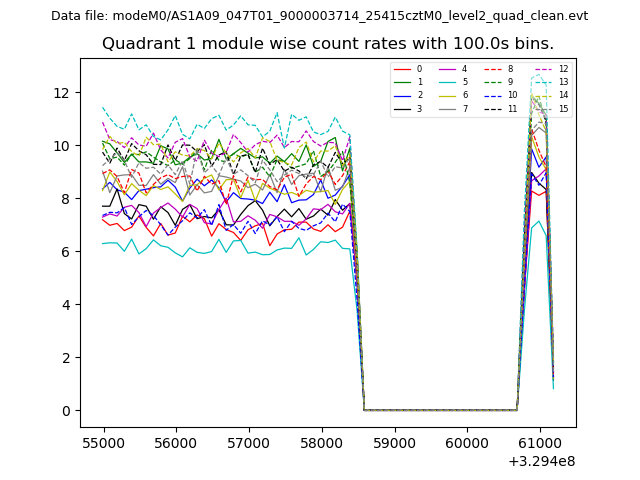 |
 |
| Module-wise count rates for Quadrant C Data is divided into 100 sec bins |
 |
 |
| Module-wise count rates for Quadrant D Data is divided into 100 sec bins |
 |
 |
| Parameter | Plot |
|---|---|
| CZT HV Monitor |  |
| D_VDD | 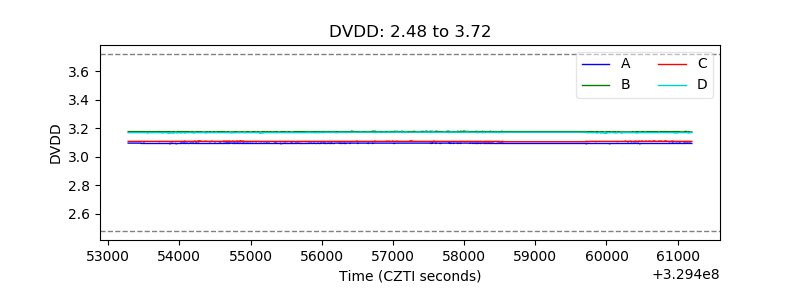 |
| Temperature 1 | 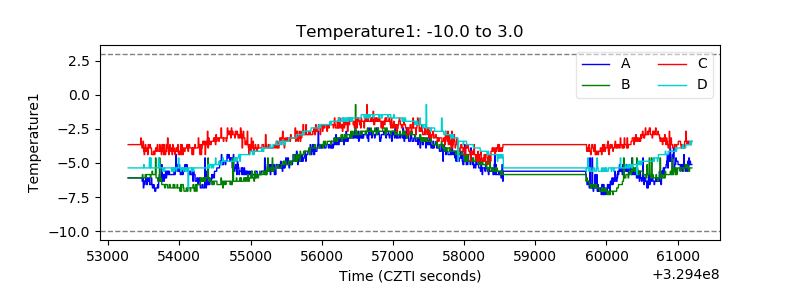 |
| Veto HV Monitor | 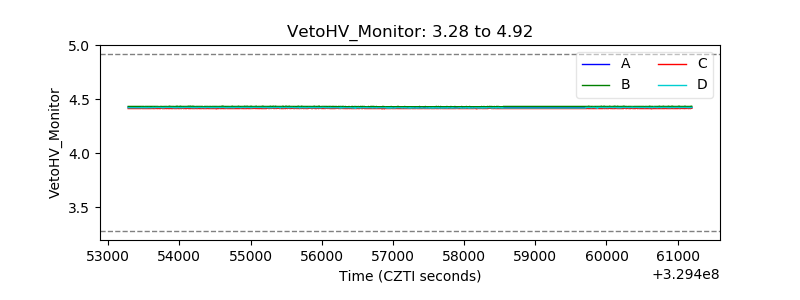 |
| Veto LLD | 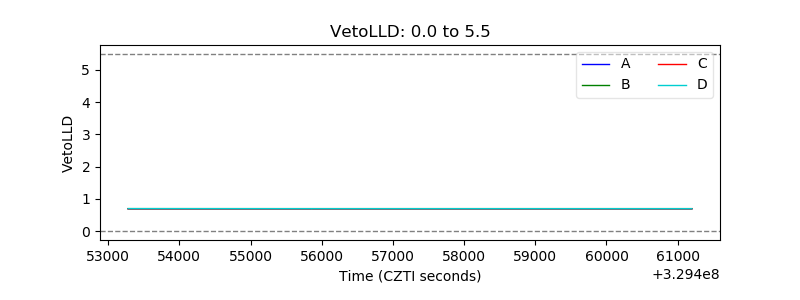 |
| Alpha Counter |  |
| _CPM_Rate | 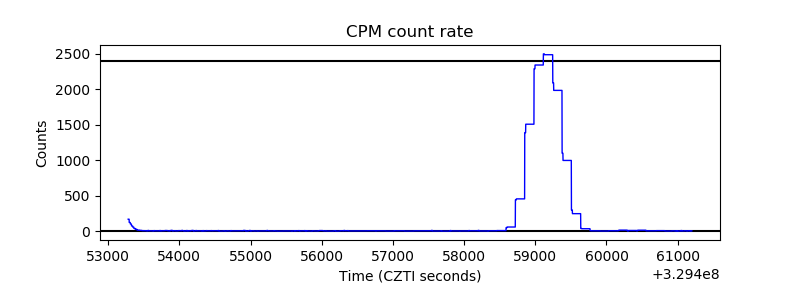 |
| CZT Counter |  |
| +2.5 Volts monitor |  |
| +5 Volts monitor |  |
| _ROLL_ROT | 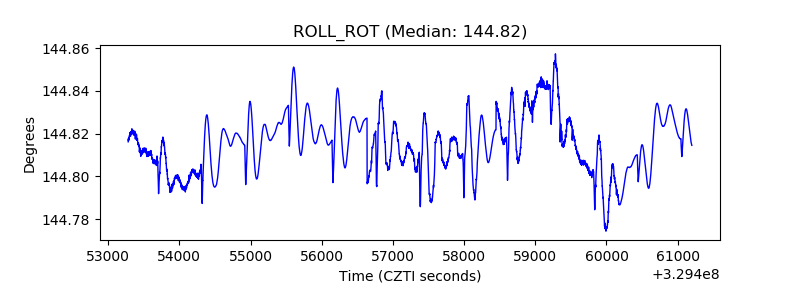 |
| _Roll_DEC | 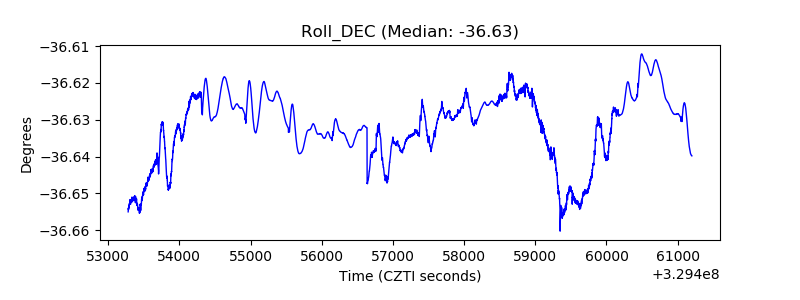 |
| _Roll_RA | 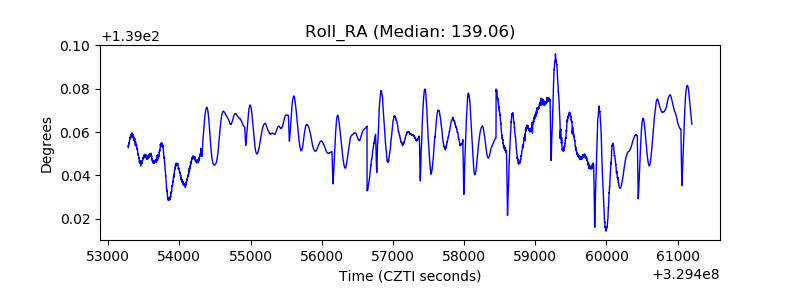 |
| Veto Counter | 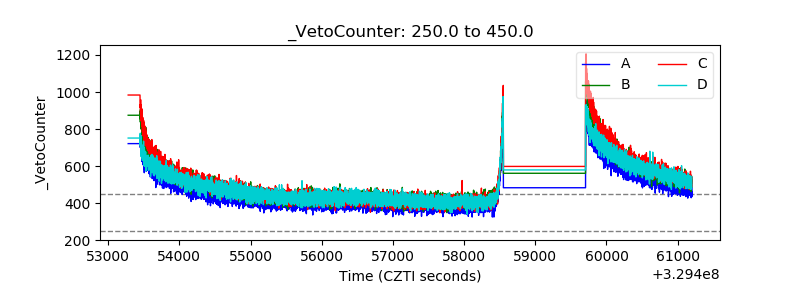 |