| Param | Original file | Final file |
|---|---|---|
| Filename | modeM0/AS1A09_047T01_9000003714_25416cztM0_level2.evt | modeM0/AS1A09_047T01_9000003714_25416cztM0_level2_quad_clean.evt |
| Size (bytes) | 497,312,640 | 100,336,320 |
| Size | 474.3 MB | 95.7 MB |
| Events in quadrant A | 3,338,487 | 666,235 |
| Events in quadrant B | 3,336,912 | 674,483 |
| Events in quadrant C | 3,509,003 | 645,451 |
| Events in quadrant D | 4,464,035 | 627,492 |
| Mode M9 | |||
|---|---|---|---|
| Quadrant | BADHDUFLAG | Total packets | Discarded packets |
| A | 0 | 12 | 0 |
| B | 0 | 12 | 0 |
| C | 0 | 12 | 0 |
| D | 0 | 12 | 0 |
| Mode M0 | |||
|---|---|---|---|
| Quadrant | BADHDUFLAG | Total packets | Discarded packets |
| A | 0 | 13663 | 0 |
| B | 0 | 13685 | 0 |
| C | 0 | 14409 | 0 |
| D | 0 | 17788 | 0 |
| Quadrant | Total seconds | Saturated seconds | Saturation percentage |
|---|---|---|---|
| A | 6080 | 46 | 0.756579% |
| B | 6080 | 53 | 0.871711% |
| C | 6081 | 114 | 1.874692% |
| D | 6080 | 151 | 2.483553% |
Noise dominated data is calculated using 1-second bins in cleaned event files. If a bin has >2000 counts, and if more than 50% of those come from <1% of pixels, then it is considered to be noise-dominated and hence unusable.
| Quadrant | # 1 sec bins | Bins with >0 counts | Bins with >2000 counts | High rate bins dominated by noise | Noise dominated (total time) | Noise dominated (detector-on time) | Marked lightcurve |
|---|---|---|---|---|---|---|---|
| A | 7355 | 6080 | 0 | 0 | 0.00% | 0.00% | 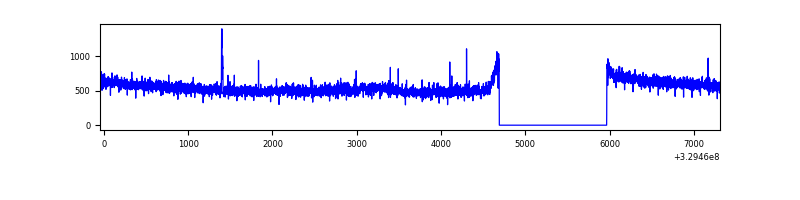 |
| B | 7355 | 6080 | 0 | 0 | 0.00% | 0.00% | 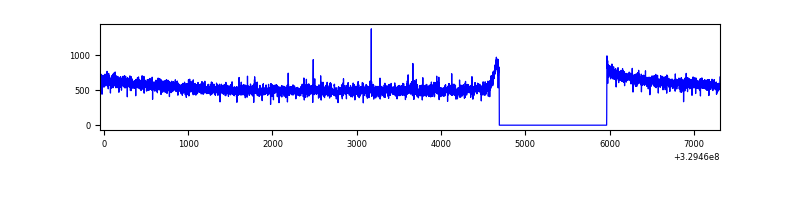 |
| C | 7356 | 6081 | 0 | 0 | 0.00% | 0.00% | 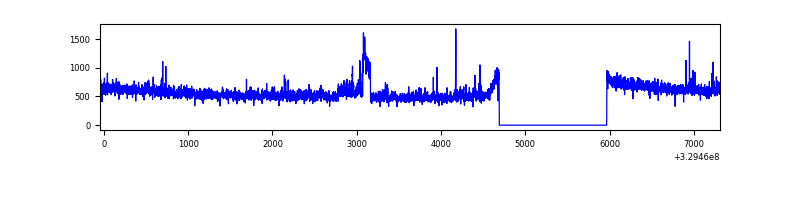 |
| D | 7355 | 6080 | 58 | 58 | 0.79% | 0.95% | 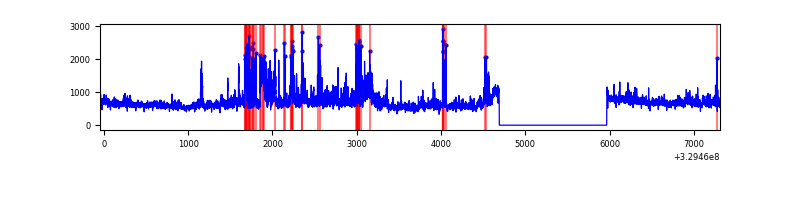 |
Top three noisy pixels from each quadrant. If the there are fewer than three noisy pixels in the level2.evt file, extra rows are filled as -1
| Pixel properties | Quadrant properties | ||||||
|---|---|---|---|---|---|---|---|
| Quadrant | DetID | PixID | Counts | Sigma | Mean | Median | Sigma |
| A | 6 | 16 | 56613 | 330.35 | 852 | 838 | 168.8 |
| A | 13 | 254 | 8613 | 46.05 | 852 | 838 | 168.8 |
| A | 0 | 226 | 7380 | 38.75 | 852 | 838 | 168.8 |
| B | 0 | 229 | 40429 | 256.27 | 836 | 817 | 154.6 |
| B | 3 | 112 | 23597 | 147.37 | 836 | 817 | 154.6 |
| B | 12 | 111 | 18492 | 114.35 | 836 | 817 | 154.6 |
| C | 14 | 238 | 134411 | 715.03 | 816 | 823 | 186.8 |
| C | 7 | 247 | 116794 | 620.73 | 816 | 823 | 186.8 |
| C | 7 | 87 | 71326 | 377.37 | 816 | 823 | 186.8 |
| D | 8 | 195 | 744288 | 3731.41 | 828 | 805 | 199.2 |
| D | 1 | 52 | 334776 | 1676.14 | 828 | 805 | 199.2 |
| D | 2 | 82 | 107273 | 534.34 | 828 | 805 | 199.2 |
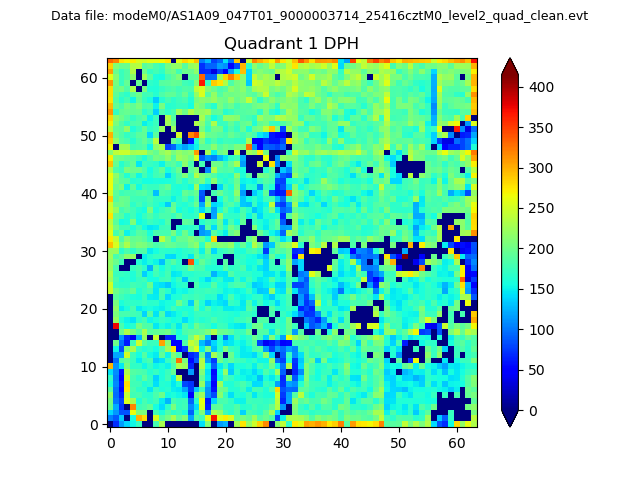
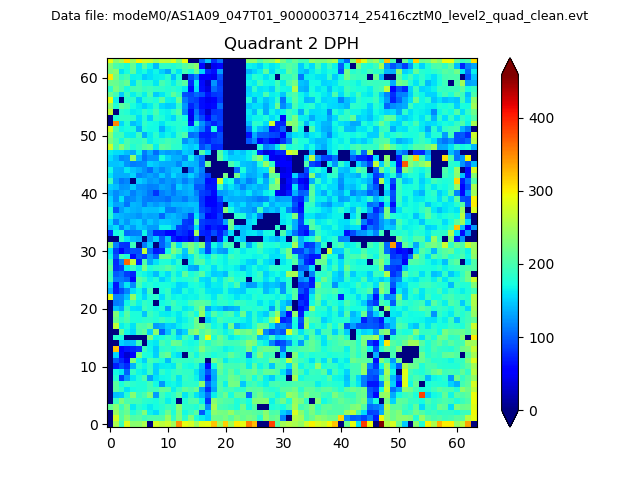
Histogram calculated using DETX and DETY for each event in the final _common_clean file
| Quadrant A |  |
 |
Quadrant B |
|---|---|---|---|
| Quadrant D |  |
 |
Quadrant C |
| Plot type | Count rate plots | Images |
|---|---|---|
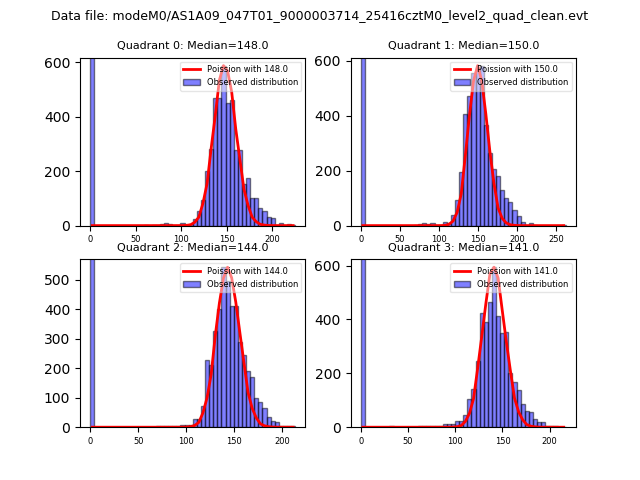
| Comparison with Poisson distribution Blue bars denote a histogram of data divided into 1 sec bins. Red curve is a Poisson curve with rate = median count rate of data. |
 |
 |
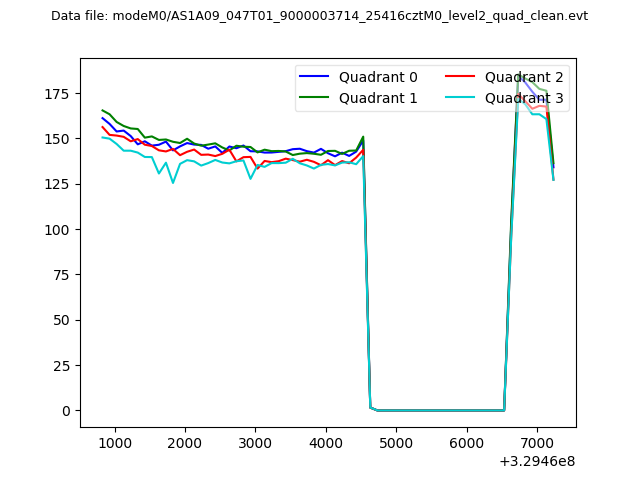
| Quadrant-wise count rates Data is divided into 100 sec bins |
 |
|
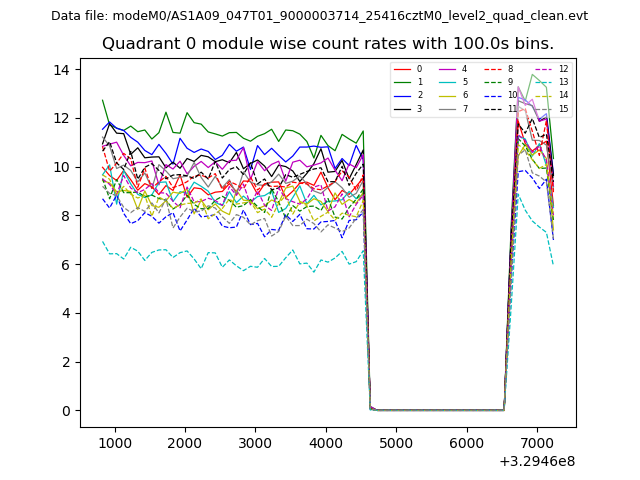
| Module-wise count rates for Quadrant A Data is divided into 100 sec bins |
 |
 |
| Module-wise count rates for Quadrant B Data is divided into 100 sec bins |
 |
 |
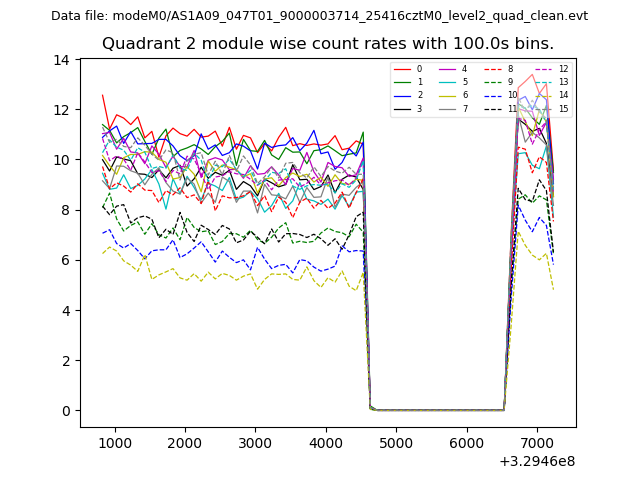
| Module-wise count rates for Quadrant C Data is divided into 100 sec bins |
 |
 |
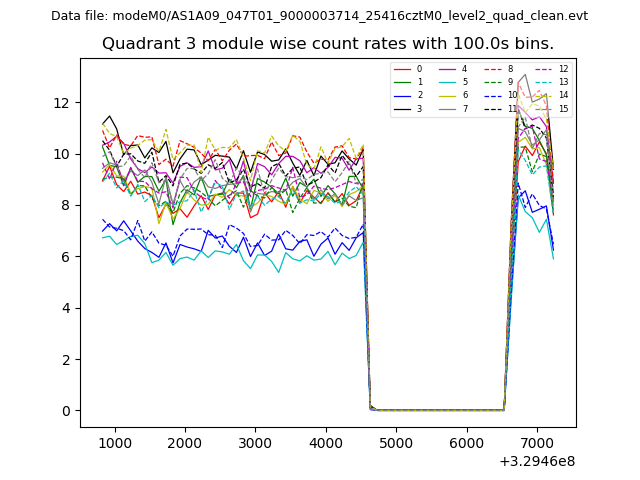
| Module-wise count rates for Quadrant D Data is divided into 100 sec bins |
 |
 |
| Parameter | Plot |
|---|---|
| CZT HV Monitor |  |
| D_VDD | 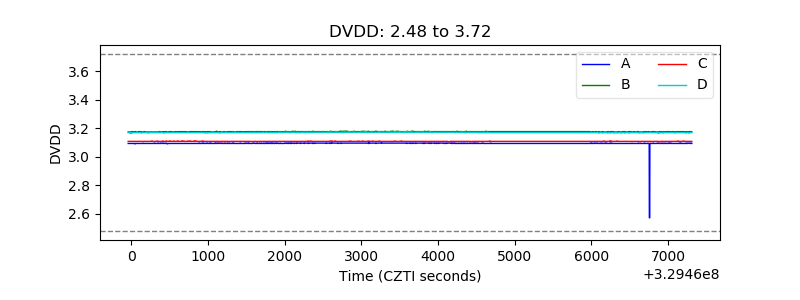 |
| Temperature 1 | 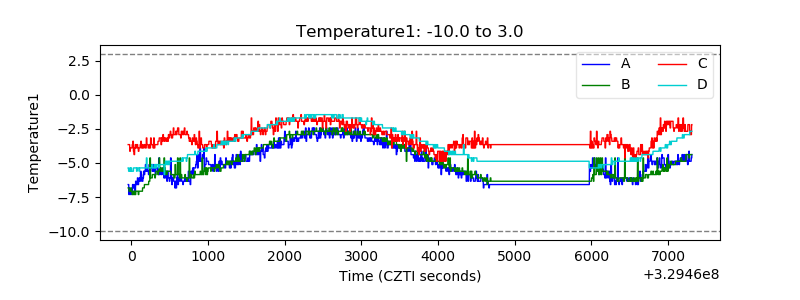 |
| Veto HV Monitor | 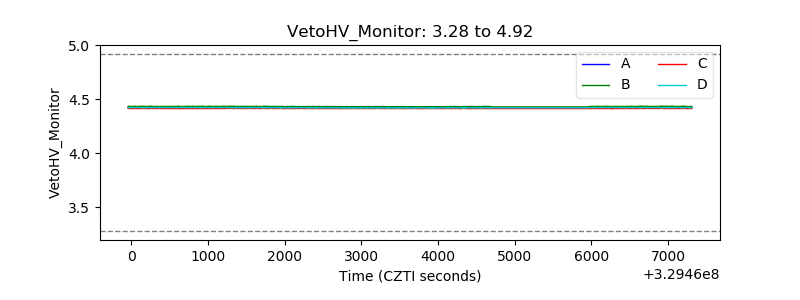 |
| Veto LLD | 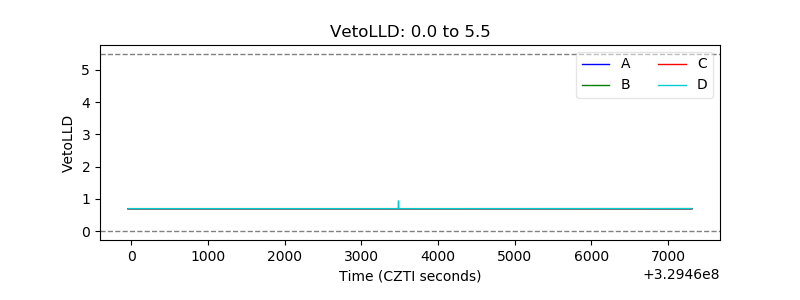 |
| Alpha Counter | 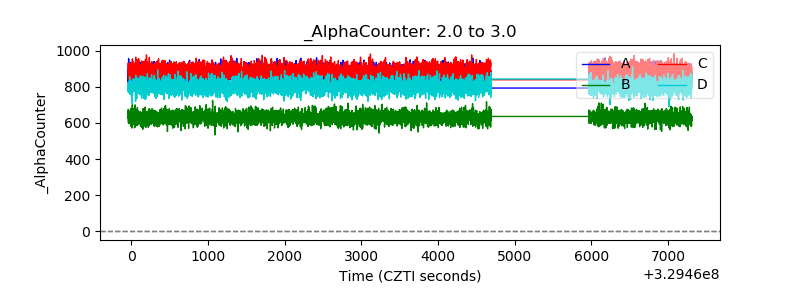 |
| _CPM_Rate | 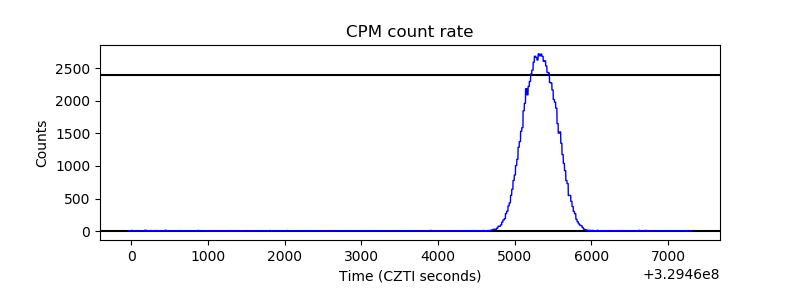 |
| CZT Counter | 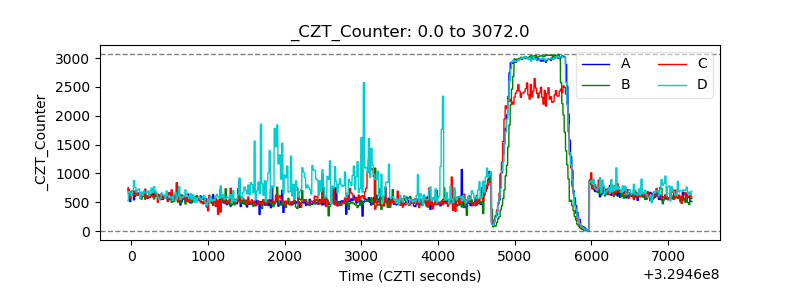 |
| +2.5 Volts monitor |  |
| +5 Volts monitor | 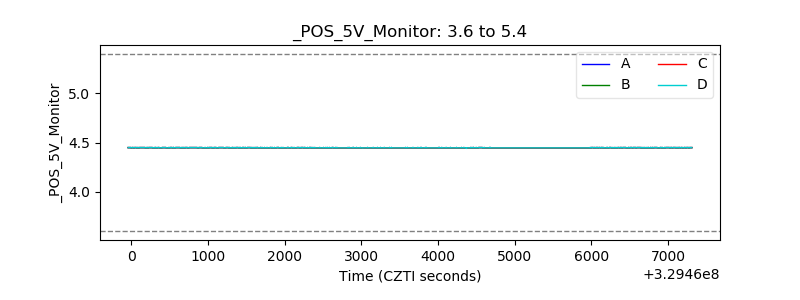 |
| _ROLL_ROT | 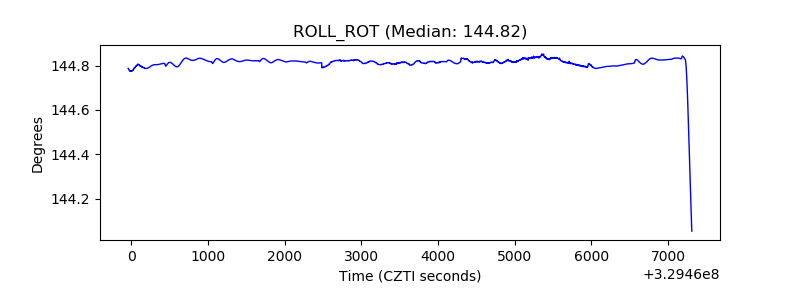 |
| _Roll_DEC | 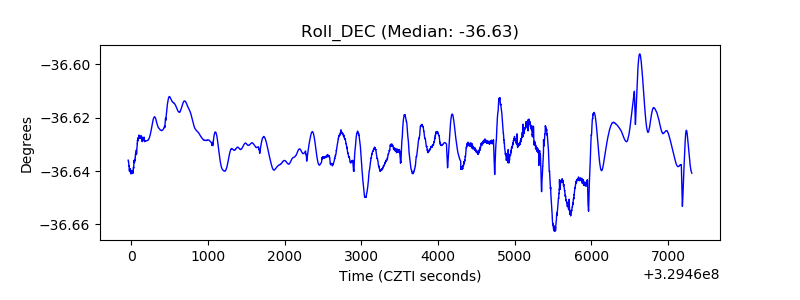 |
| _Roll_RA | 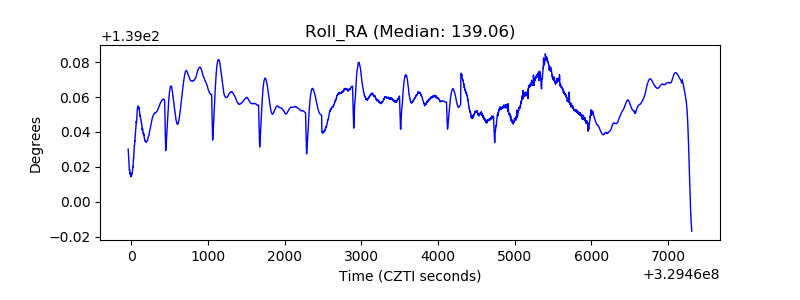 |
| Veto Counter | 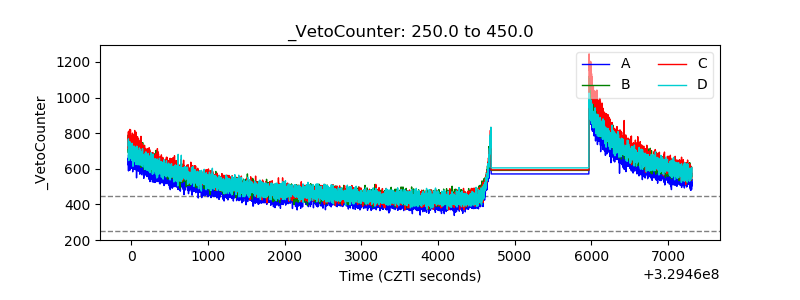 |