| Param | Original file | Final file |
|---|---|---|
| Filename | modeM0/AS1A09_047T01_9000003714_25417cztM0_level2.evt | modeM0/AS1A09_047T01_9000003714_25417cztM0_level2_quad_clean.evt |
| Size (bytes) | 487,944,000 | 113,880,960 |
| Size | 465.3 MB | 108.6 MB |
| Events in quadrant A | 3,422,671 | 782,989 |
| Events in quadrant B | 3,209,222 | 784,795 |
| Events in quadrant C | 3,278,347 | 751,020 |
| Events in quadrant D | 4,481,296 | 732,469 |
| Mode M9 | |||
|---|---|---|---|
| Quadrant | BADHDUFLAG | Total packets | Discarded packets |
| A | 0 | 13 | 0 |
| B | 0 | 13 | 0 |
| C | 0 | 13 | 0 |
| D | 0 | 13 | 0 |
| Mode M0 | |||
|---|---|---|---|
| Quadrant | BADHDUFLAG | Total packets | Discarded packets |
| A | 0 | 13850 | 0 |
| B | 0 | 13089 | 0 |
| C | 0 | 13499 | 0 |
| D | 0 | 17536 | 0 |
| Quadrant | Total seconds | Saturated seconds | Saturation percentage |
|---|---|---|---|
| A | 5690 | 76 | 1.335677% |
| B | 5691 | 88 | 1.546301% |
| C | 5691 | 145 | 2.547883% |
| D | 5691 | 167 | 2.934458% |
Noise dominated data is calculated using 1-second bins in cleaned event files. If a bin has >2000 counts, and if more than 50% of those come from <1% of pixels, then it is considered to be noise-dominated and hence unusable.
| Quadrant | # 1 sec bins | Bins with >0 counts | Bins with >2000 counts | High rate bins dominated by noise | Noise dominated (total time) | Noise dominated (detector-on time) | Marked lightcurve |
|---|---|---|---|---|---|---|---|
| A | 7015 | 5690 | 0 | 0 | 0.00% | 0.00% | 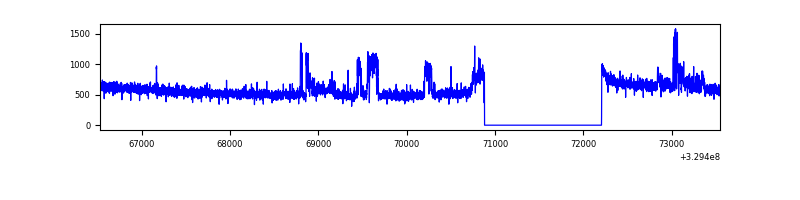 |
| B | 7016 | 5691 | 4 | 4 | 0.06% | 0.07% | 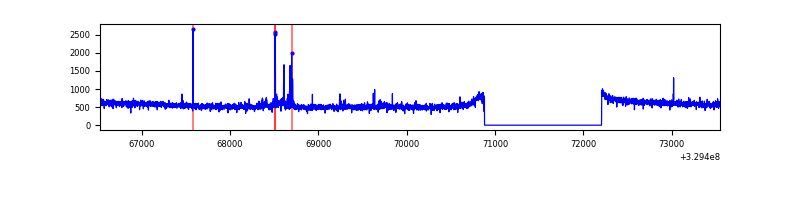 |
| C | 7016 | 5691 | 2 | 2 | 0.03% | 0.04% | 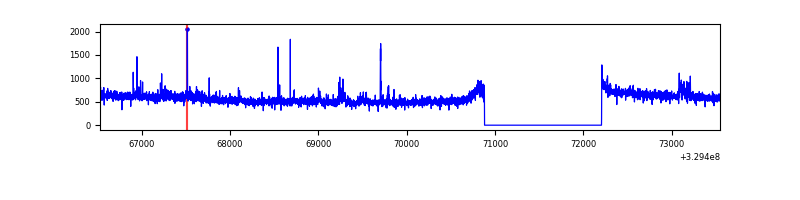 |
| D | 7016 | 5691 | 98 | 98 | 1.40% | 1.72% | 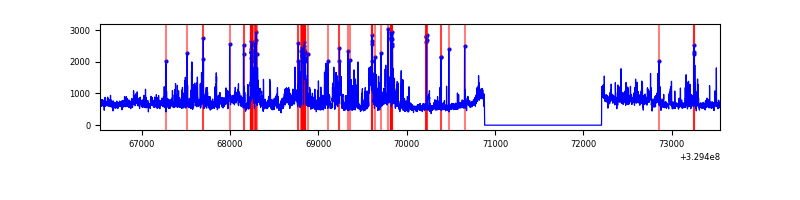 |
Top three noisy pixels from each quadrant. If the there are fewer than three noisy pixels in the level2.evt file, extra rows are filled as -1
| Pixel properties | Quadrant properties | ||||||
|---|---|---|---|---|---|---|---|
| Quadrant | DetID | PixID | Counts | Sigma | Mean | Median | Sigma |
| A | 6 | 16 | 277059 | 1724.39 | 816 | 804 | 160.2 |
| A | 13 | 254 | 7888 | 44.22 | 816 | 804 | 160.2 |
| A | 0 | 226 | 7037 | 38.91 | 816 | 804 | 160.2 |
| B | 3 | 112 | 34673 | 229.81 | 793 | 776 | 147.5 |
| B | 0 | 190 | 26889 | 177.04 | 793 | 776 | 147.5 |
| B | 15 | 33 | 21849 | 142.87 | 793 | 776 | 147.5 |
| C | 14 | 238 | 128656 | 721.29 | 774 | 780 | 177.3 |
| C | 7 | 247 | 79221 | 442.45 | 774 | 780 | 177.3 |
| C | 2 | 16 | 51742 | 287.46 | 774 | 780 | 177.3 |
| D | 1 | 52 | 630992 | 3385.83 | 792 | 772 | 186.1 |
| D | 8 | 195 | 560989 | 3009.75 | 792 | 772 | 186.1 |
| D | 2 | 82 | 129414 | 691.12 | 792 | 772 | 186.1 |
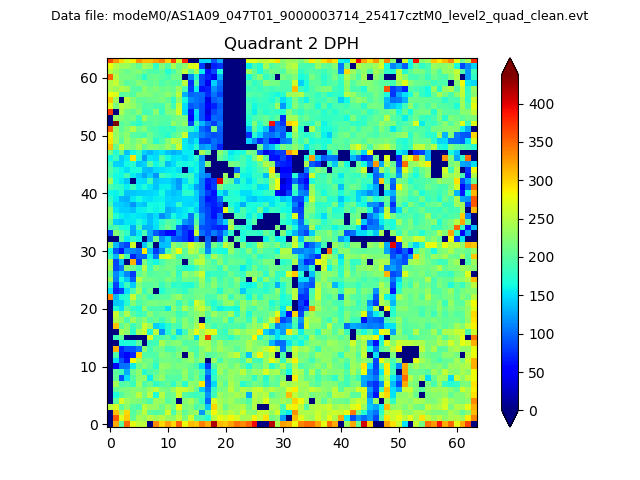
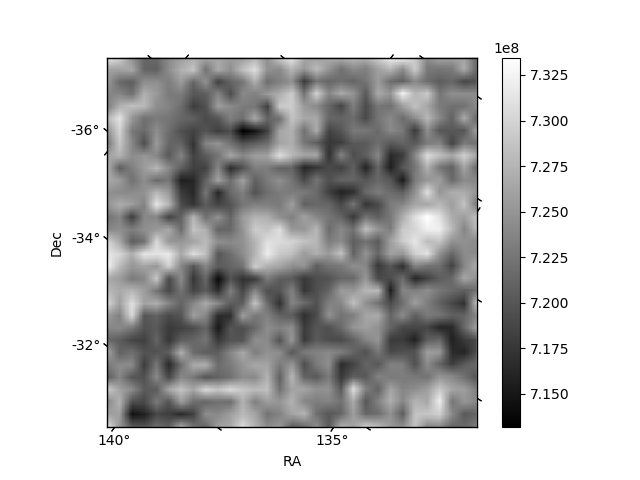
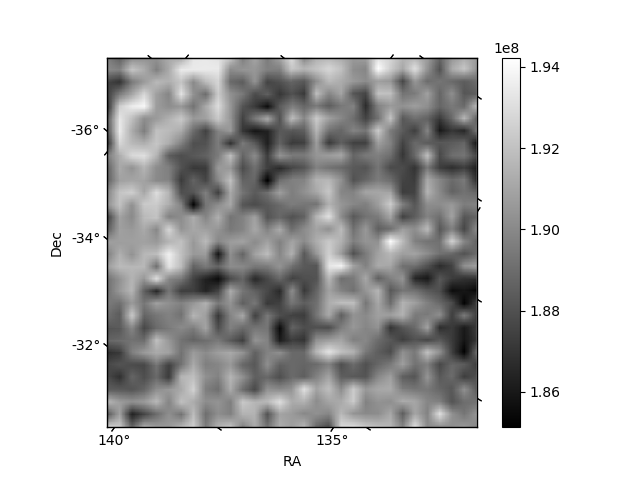
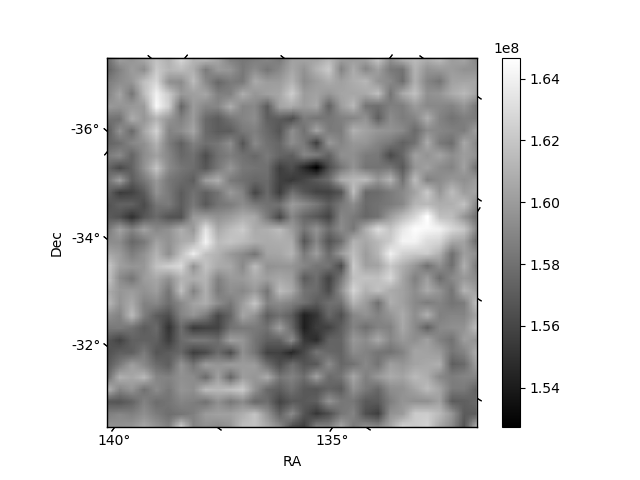
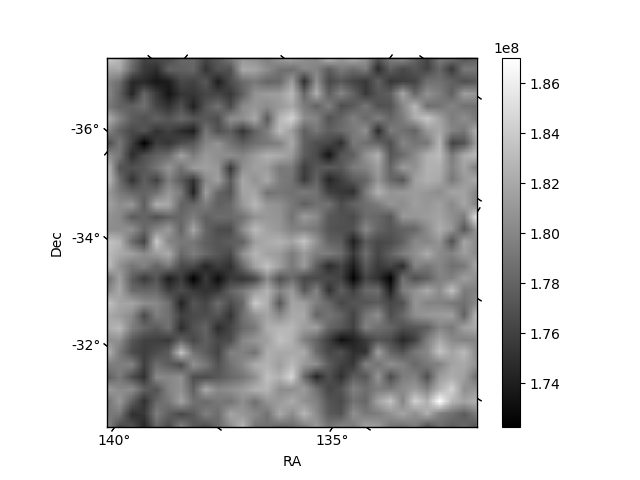
Histogram calculated using DETX and DETY for each event in the final _common_clean file
| Quadrant A | 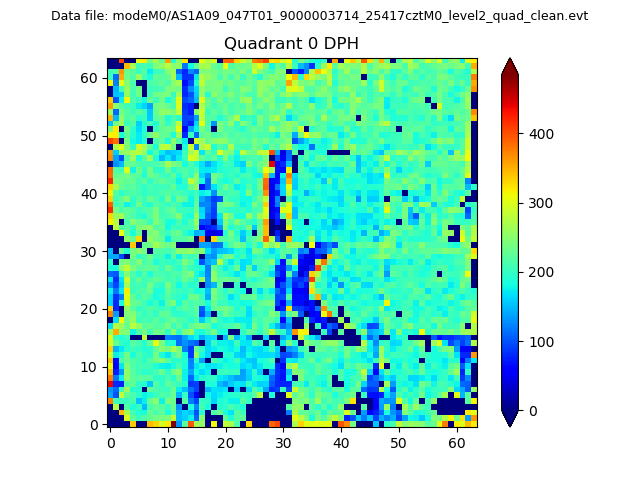 |
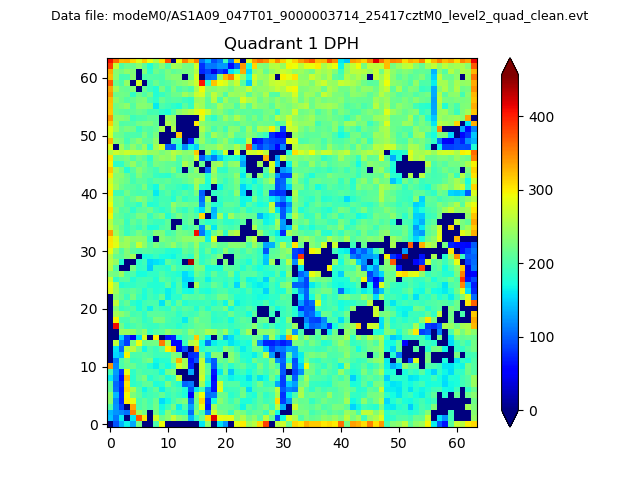 |
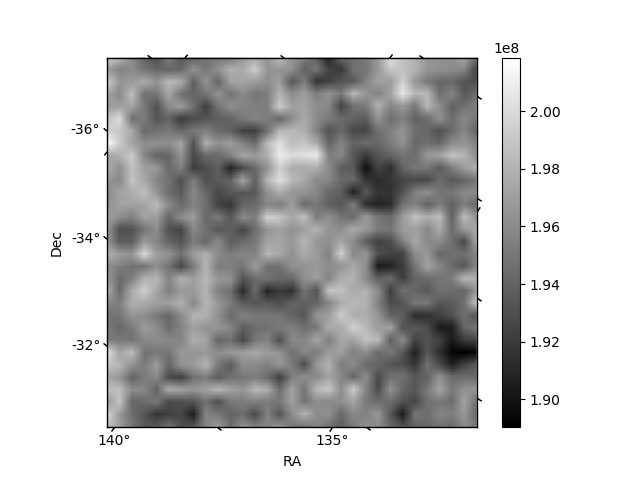
Quadrant B |
|---|---|---|---|
| Quadrant D | 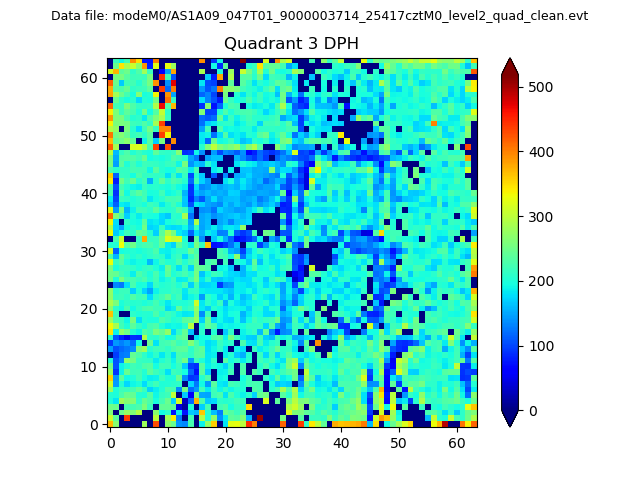 |
 |
Quadrant C |
| Plot type | Count rate plots | Images |
|---|---|---|
| Comparison with Poisson distribution Blue bars denote a histogram of data divided into 1 sec bins. Red curve is a Poisson curve with rate = median count rate of data. |
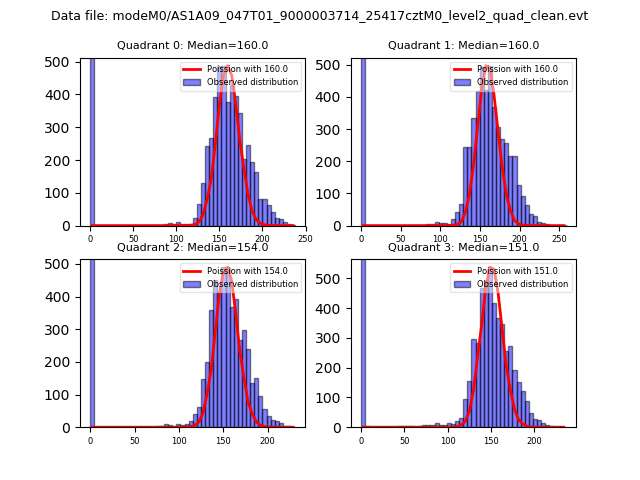 |
 |
| Quadrant-wise count rates Data is divided into 100 sec bins |
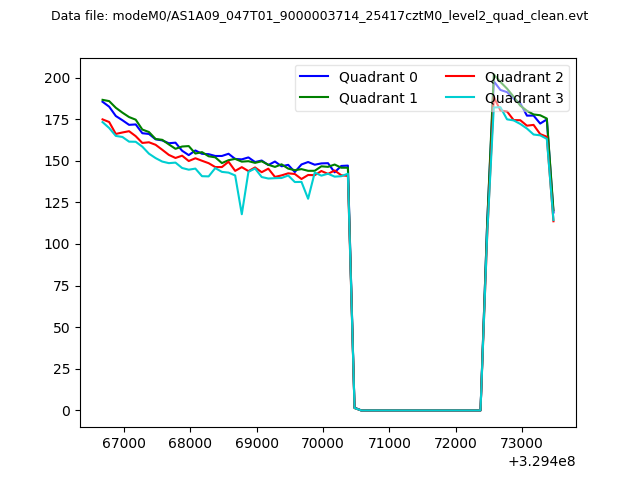 |
|
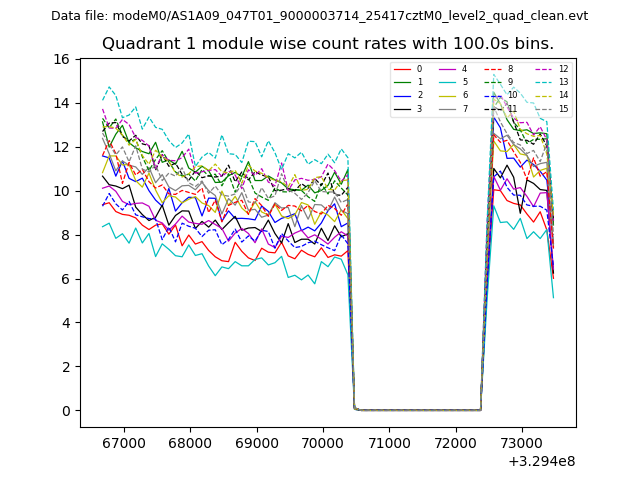
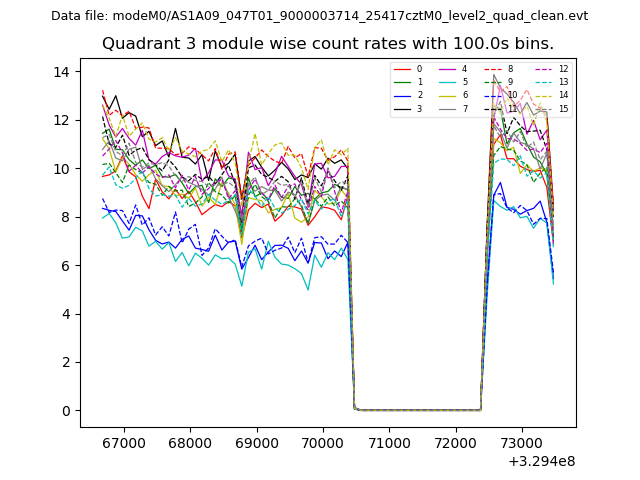
| Module-wise count rates for Quadrant A Data is divided into 100 sec bins |
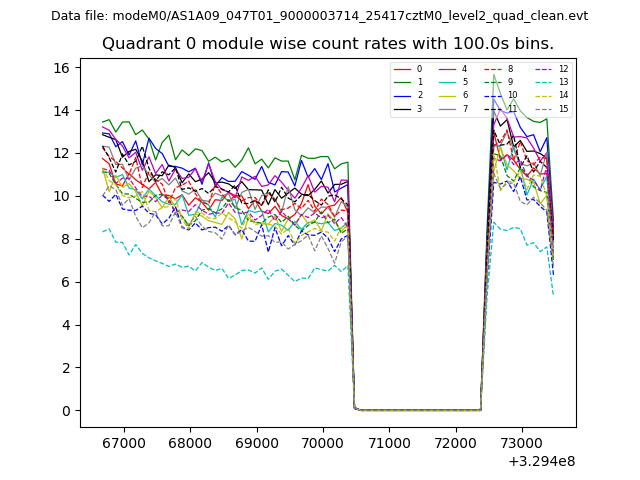 |
 |
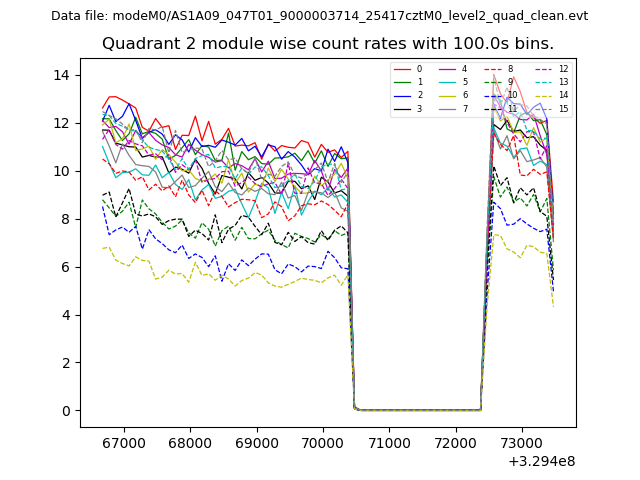
| Module-wise count rates for Quadrant B Data is divided into 100 sec bins |
 |
 |
| Module-wise count rates for Quadrant C Data is divided into 100 sec bins |
 |
 |
| Module-wise count rates for Quadrant D Data is divided into 100 sec bins |
 |
 |
| Parameter | Plot |
|---|---|
| CZT HV Monitor | 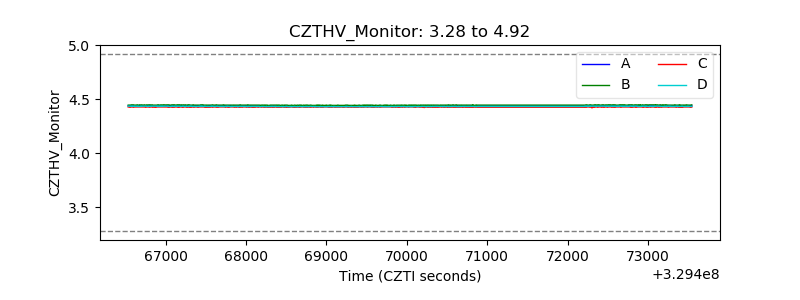 |
| D_VDD |  |
| Temperature 1 | 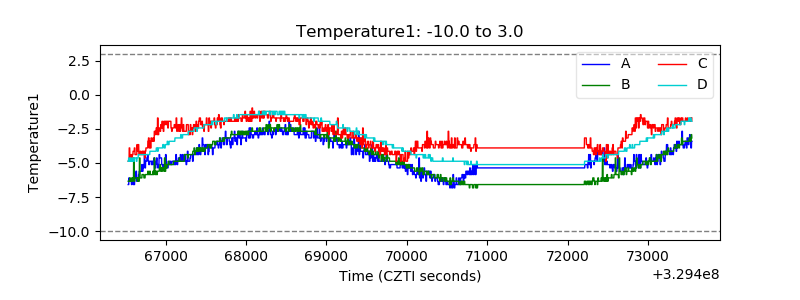 |
| Veto HV Monitor | 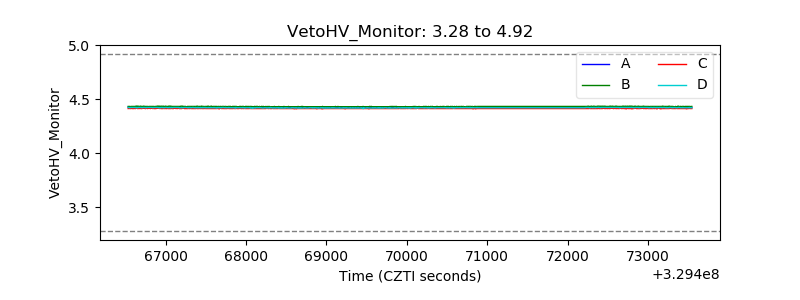 |
| Veto LLD | 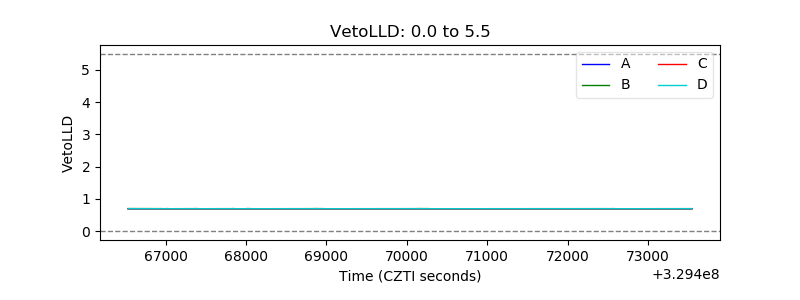 |
| Alpha Counter | 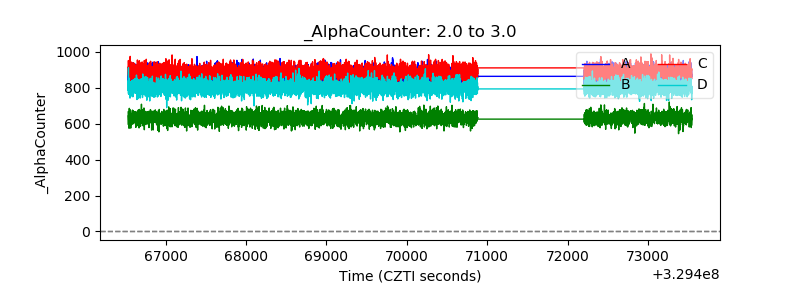 |
| _CPM_Rate |  |
| CZT Counter | 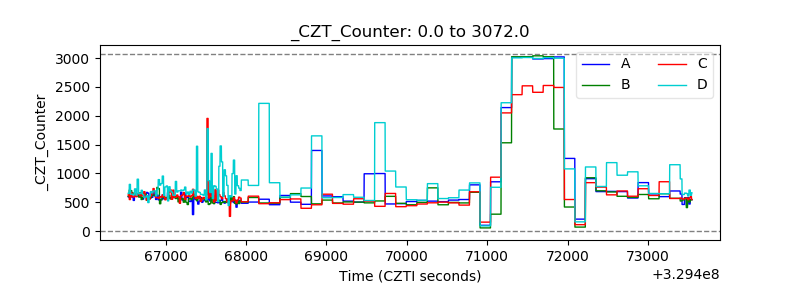 |
| +2.5 Volts monitor |  |
| +5 Volts monitor | 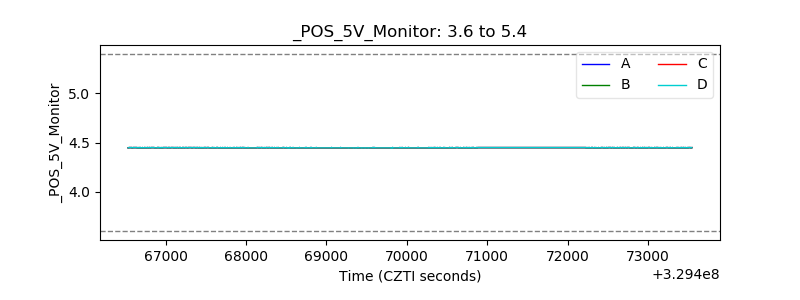 |
| _ROLL_ROT | 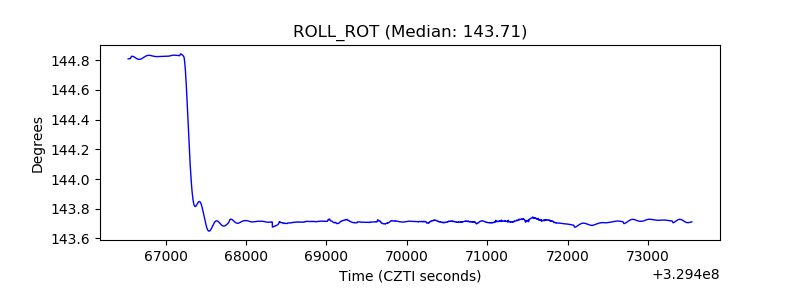 |
| _Roll_DEC | 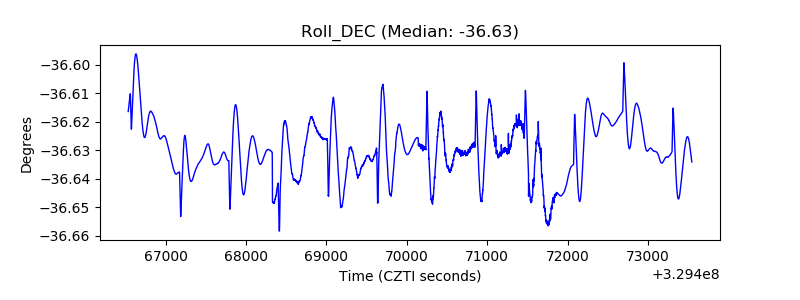 |
| _Roll_RA | 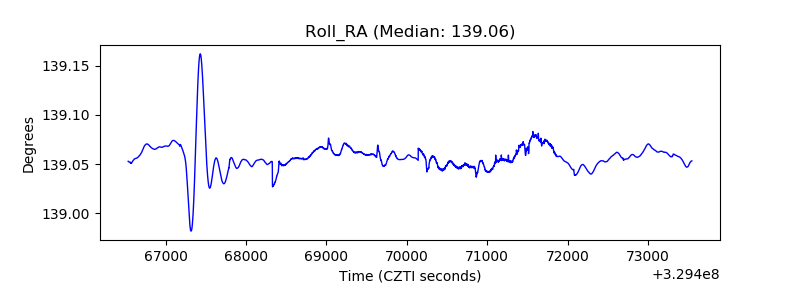 |
| Veto Counter | 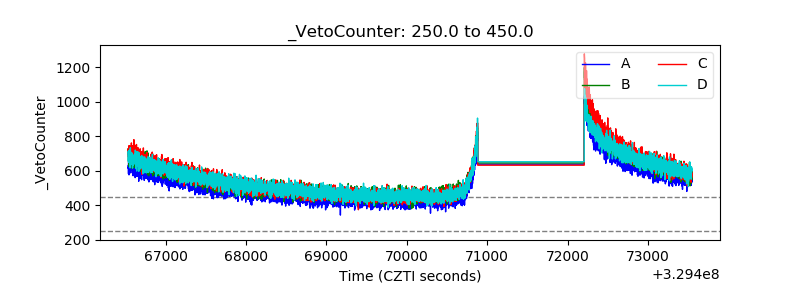 |