| Param | Original file | Final file |
|---|---|---|
| Filename | modeM0/AS1A09_047T01_9000003714_25418cztM0_level2.evt | modeM0/AS1A09_047T01_9000003714_25418cztM0_level2_quad_clean.evt |
| Size (bytes) | 557,268,480 | 124,004,160 |
| Size | 531.5 MB | 118.3 MB |
| Events in quadrant A | 3,906,212 | 856,033 |
| Events in quadrant B | 3,533,479 | 858,646 |
| Events in quadrant C | 3,600,829 | 815,023 |
| Events in quadrant D | 5,413,337 | 789,941 |
| Mode M9 | |||
|---|---|---|---|
| Quadrant | BADHDUFLAG | Total packets | Discarded packets |
| A | 0 | 14 | 0 |
| B | 0 | 15 | 0 |
| C | 0 | 15 | 0 |
| D | 0 | 15 | 0 |
| Mode M0 | |||
|---|---|---|---|
| Quadrant | BADHDUFLAG | Total packets | Discarded packets |
| A | 0 | 15724 | 0 |
| B | 0 | 14480 | 0 |
| C | 0 | 14863 | 0 |
| D | 0 | 20700 | 0 |
| Quadrant | Total seconds | Saturated seconds | Saturation percentage |
|---|---|---|---|
| A | 6247 | 93 | 1.488715% |
| B | 6247 | 71 | 1.136546% |
| C | 6247 | 126 | 2.016968% |
| D | 6247 | 362 | 5.794781% |
Noise dominated data is calculated using 1-second bins in cleaned event files. If a bin has >2000 counts, and if more than 50% of those come from <1% of pixels, then it is considered to be noise-dominated and hence unusable.
| Quadrant | # 1 sec bins | Bins with >0 counts | Bins with >2000 counts | High rate bins dominated by noise | Noise dominated (total time) | Noise dominated (detector-on time) | Marked lightcurve |
|---|---|---|---|---|---|---|---|
| A | 7616 | 6246 | 13 | 13 | 0.17% | 0.21% | 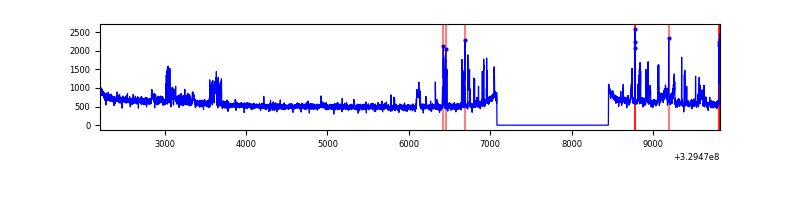 |
| B | 7617 | 6248 | 2 | 2 | 0.03% | 0.03% | 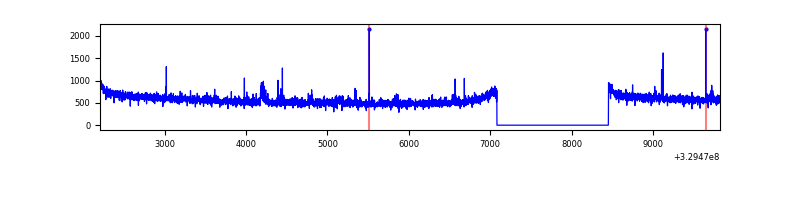 |
| C | 7617 | 6248 | 1 | 1 | 0.01% | 0.02% | 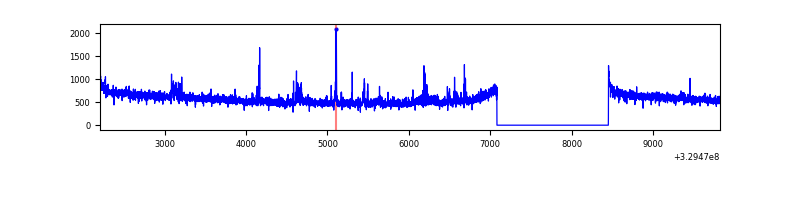 |
| D | 7617 | 6247 | 304 | 304 | 3.99% | 4.87% | 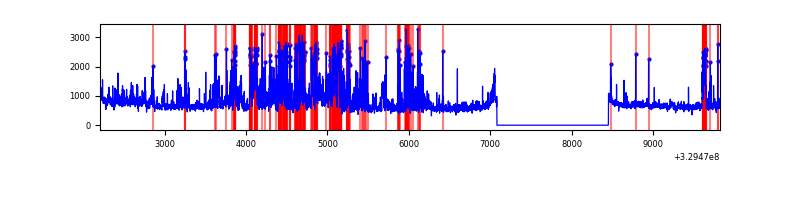 |
Top three noisy pixels from each quadrant. If the there are fewer than three noisy pixels in the level2.evt file, extra rows are filled as -1
| Pixel properties | Quadrant properties | ||||||
|---|---|---|---|---|---|---|---|
| Quadrant | DetID | PixID | Counts | Sigma | Mean | Median | Sigma |
| A | 6 | 16 | 385945 | 2180.69 | 902 | 887 | 176.6 |
| A | 4 | 2 | 42352 | 234.83 | 902 | 887 | 176.6 |
| A | 13 | 254 | 9056 | 46.26 | 902 | 887 | 176.6 |
| B | 0 | 229 | 44861 | 271.32 | 875 | 855 | 162.2 |
| B | 3 | 112 | 32167 | 193.05 | 875 | 855 | 162.2 |
| B | 0 | 190 | 26703 | 159.36 | 875 | 855 | 162.2 |
| C | 14 | 238 | 140798 | 718.5 | 851 | 860 | 194.8 |
| C | 7 | 247 | 113862 | 580.2 | 851 | 860 | 194.8 |
| C | 2 | 16 | 23054 | 113.95 | 851 | 860 | 194.8 |
| D | 1 | 52 | 946654 | 4558.21 | 868 | 846 | 207.5 |
| D | 12 | 233 | 549662 | 2644.95 | 868 | 846 | 207.5 |
| D | 8 | 195 | 499789 | 2404.6 | 868 | 846 | 207.5 |
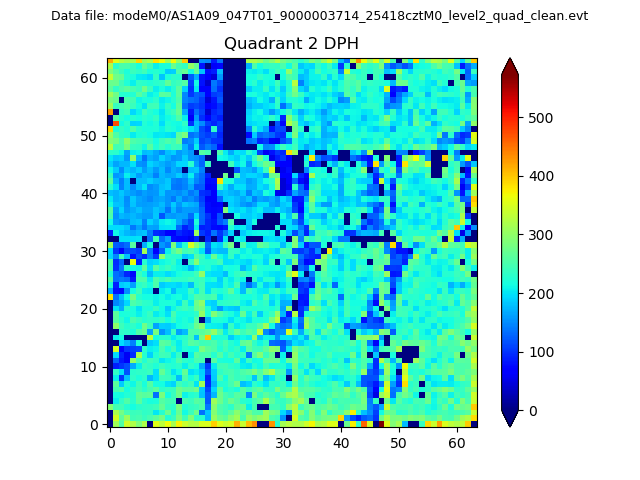
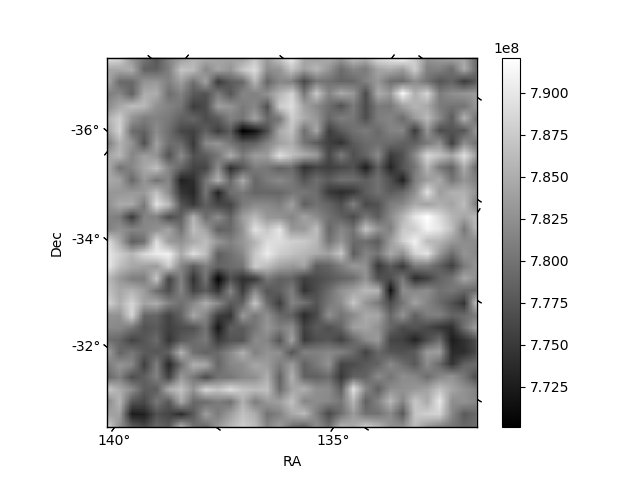
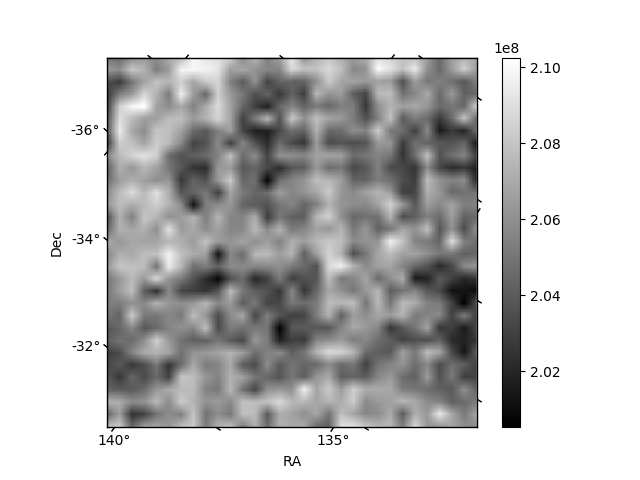
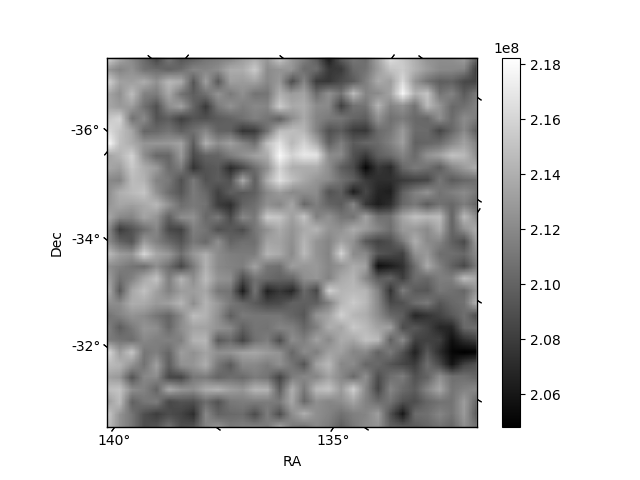
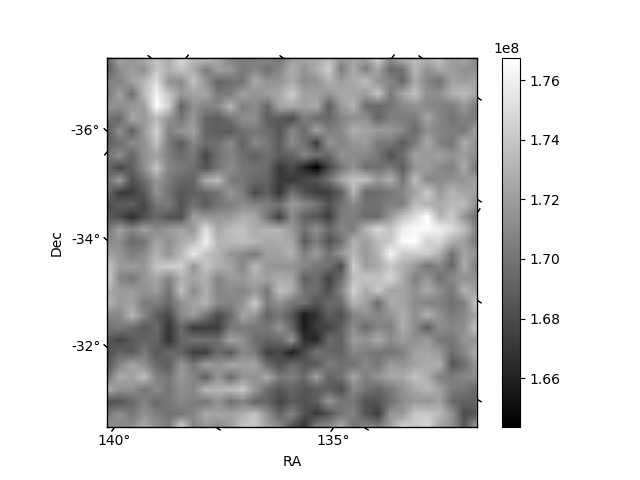
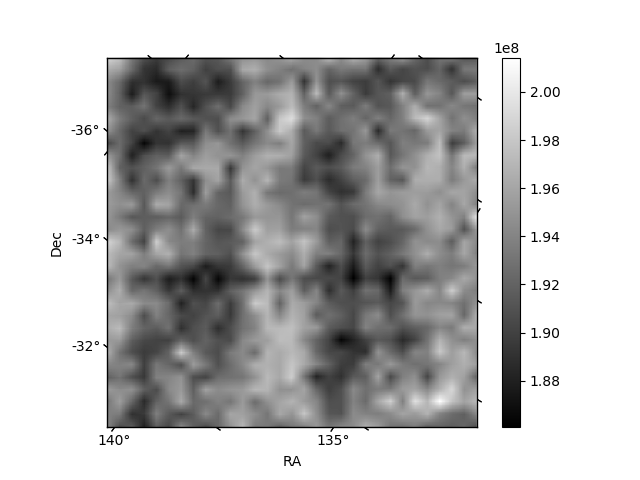
Histogram calculated using DETX and DETY for each event in the final _common_clean file
| Quadrant A | 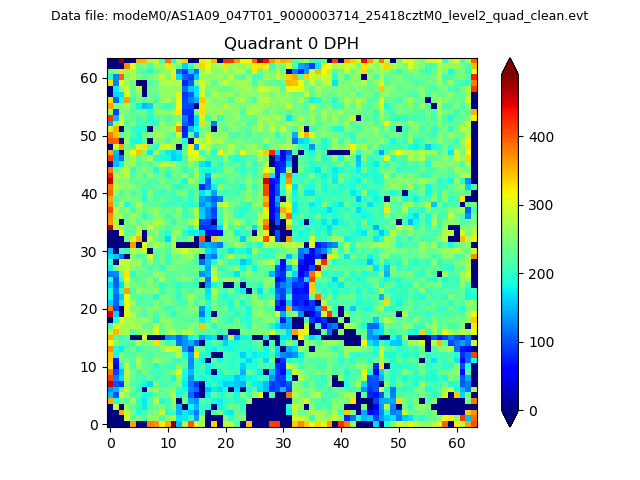 |
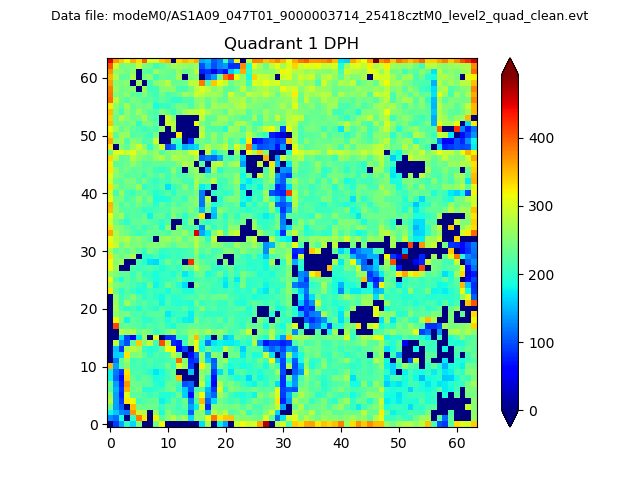 |
Quadrant B |
|---|---|---|---|
| Quadrant D | 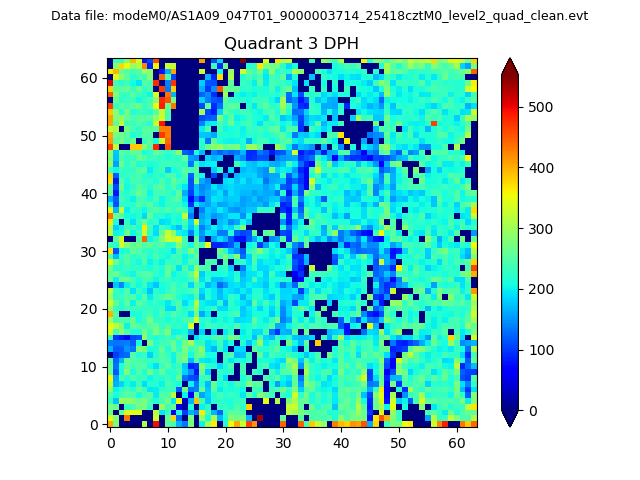 |
 |
Quadrant C |
| Plot type | Count rate plots | Images |
|---|---|---|
| Comparison with Poisson distribution Blue bars denote a histogram of data divided into 1 sec bins. Red curve is a Poisson curve with rate = median count rate of data. |
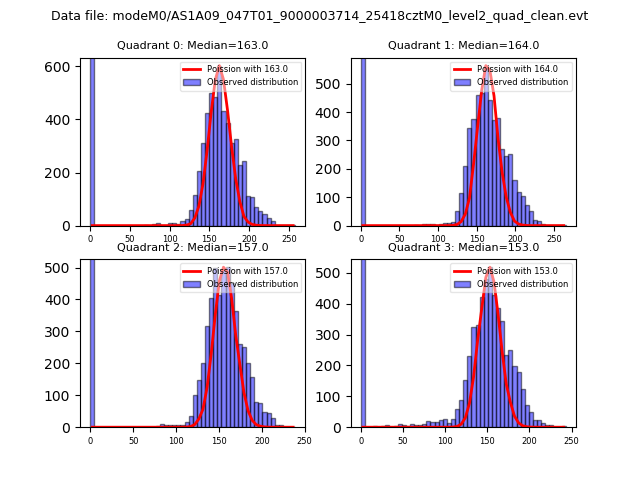 |
 |
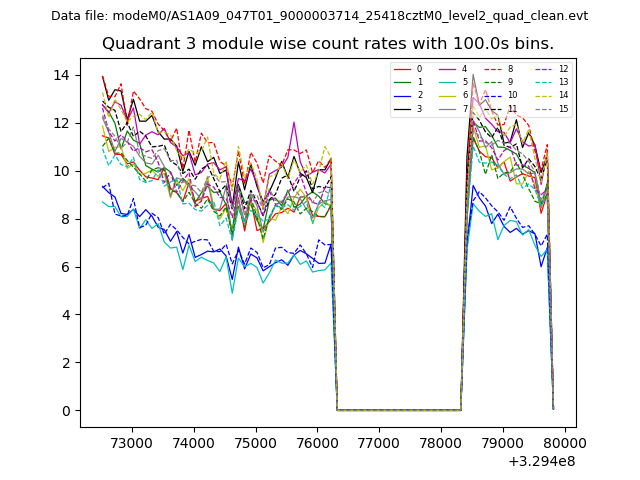
| Quadrant-wise count rates Data is divided into 100 sec bins |
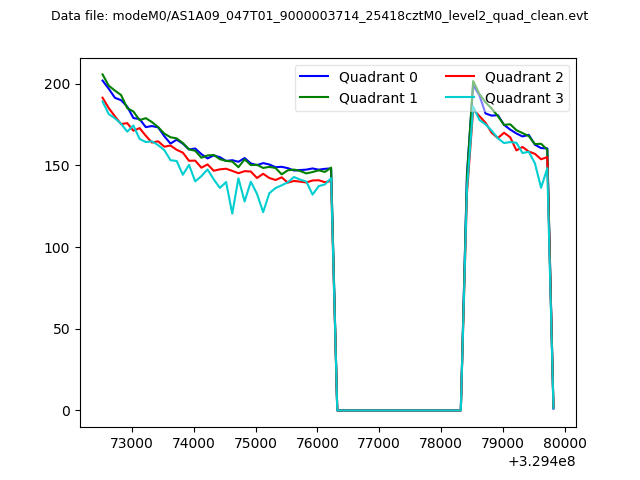 |
|
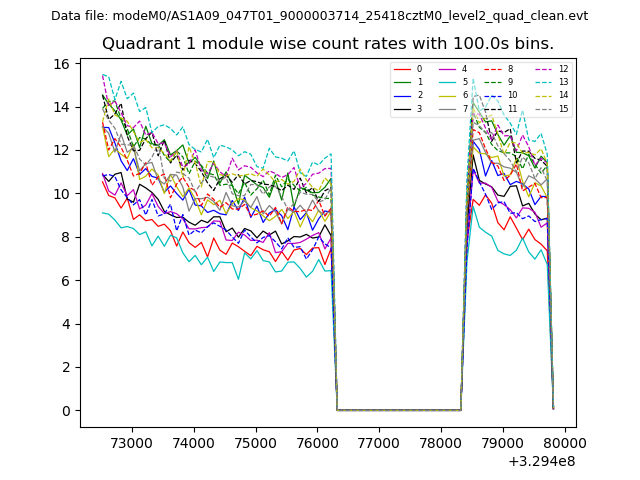
| Module-wise count rates for Quadrant A Data is divided into 100 sec bins |
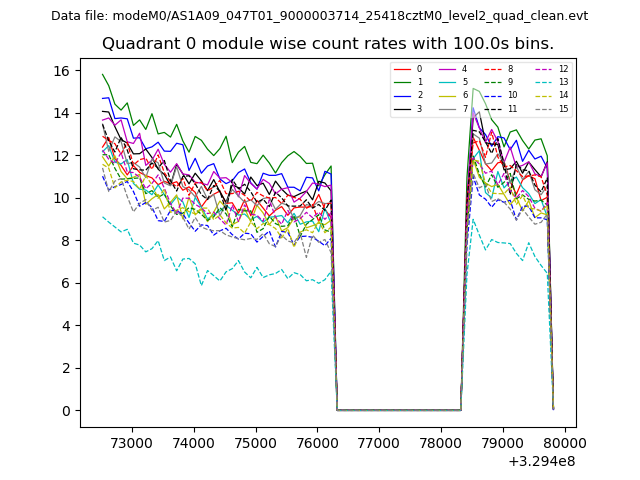 |
 |
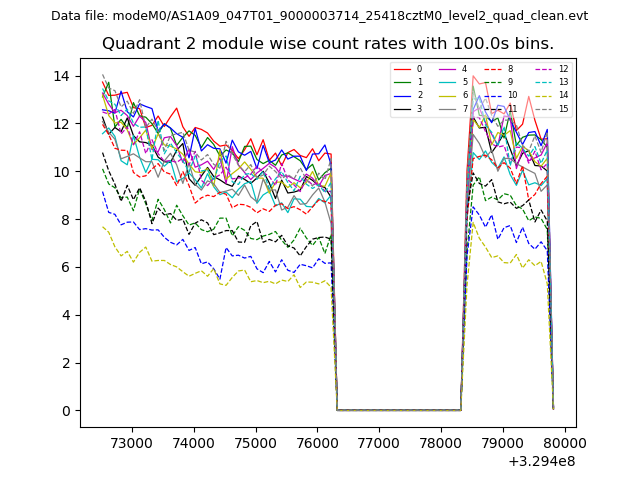
| Module-wise count rates for Quadrant B Data is divided into 100 sec bins |
 |
 |
| Module-wise count rates for Quadrant C Data is divided into 100 sec bins |
 |
 |
| Module-wise count rates for Quadrant D Data is divided into 100 sec bins |
 |
 |
| Parameter | Plot |
|---|---|
| CZT HV Monitor | 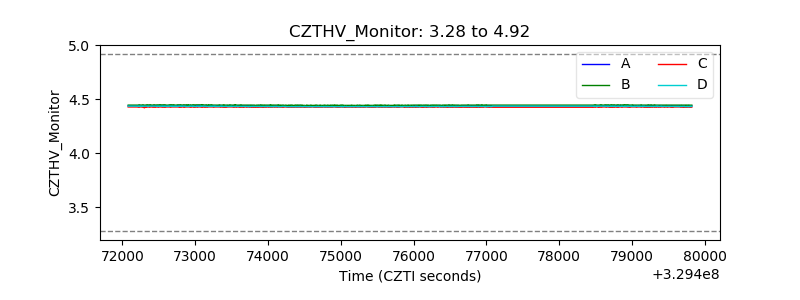 |
| D_VDD | 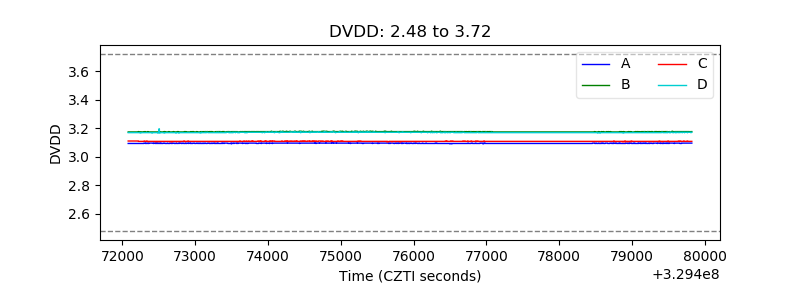 |
| Temperature 1 | 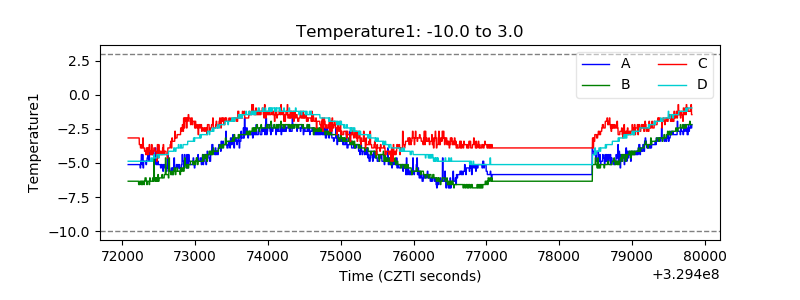 |
| Veto HV Monitor | 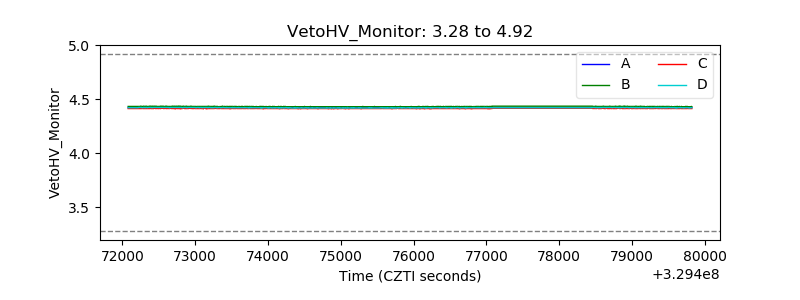 |
| Veto LLD | 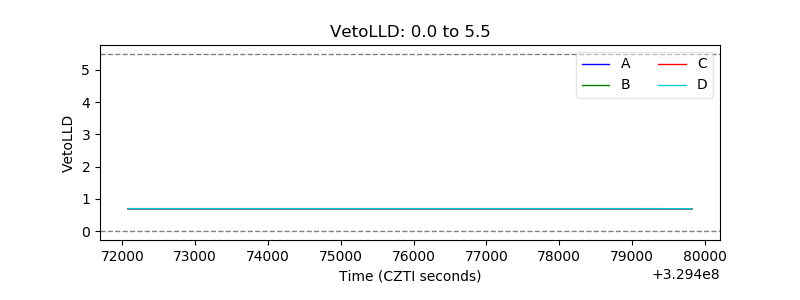 |
| Alpha Counter | 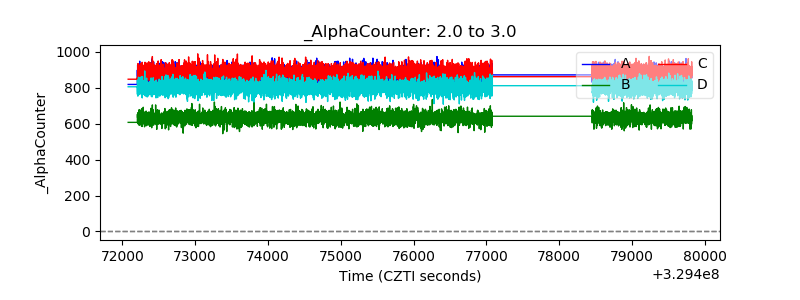 |
| _CPM_Rate | 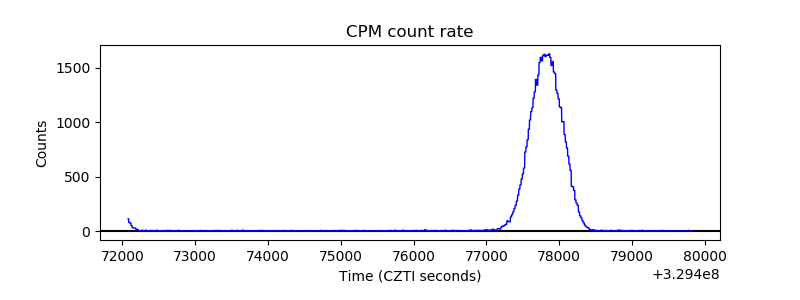 |
| CZT Counter | 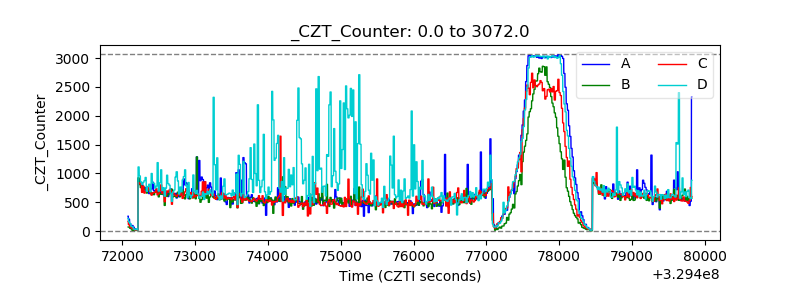 |
| +2.5 Volts monitor |  |
| +5 Volts monitor | 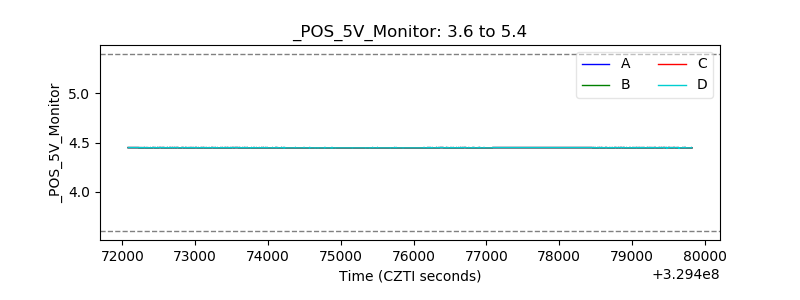 |
| _ROLL_ROT | 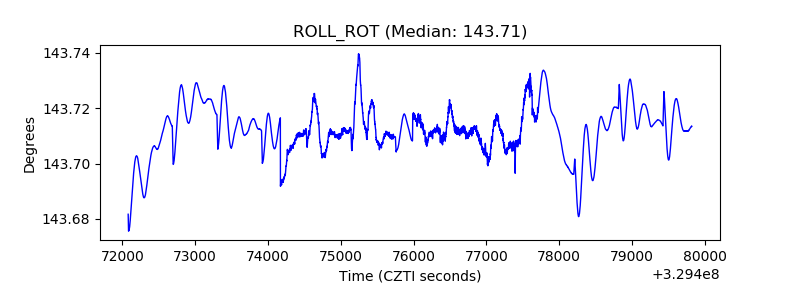 |
| _Roll_DEC | 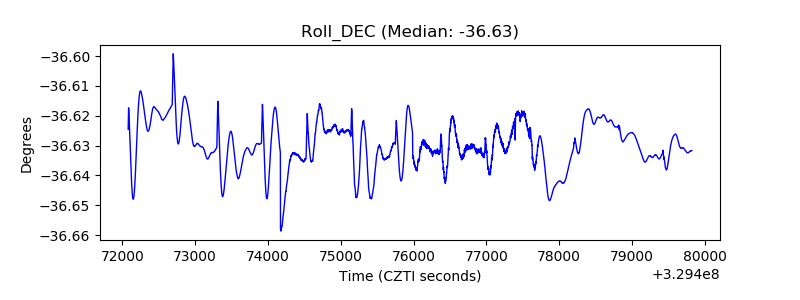 |
| _Roll_RA | 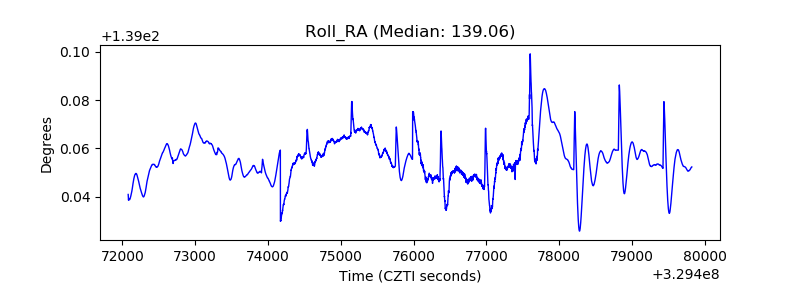 |
| Veto Counter | 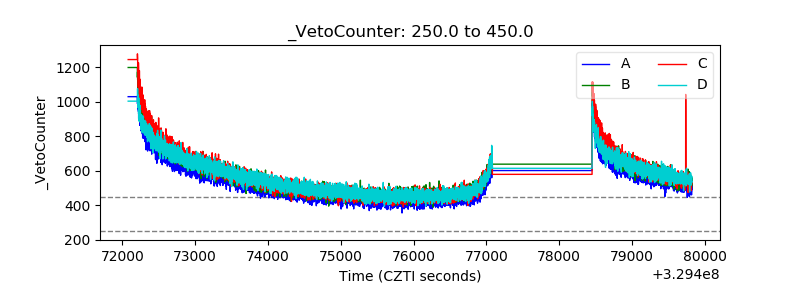 |