| Param | Original file | Final file |
|---|---|---|
| Filename | modeM0/AS1A09_047T01_9000003714_25419cztM0_level2.evt | modeM0/AS1A09_047T01_9000003714_25419cztM0_level2_quad_clean.evt |
| Size (bytes) | 582,102,720 | 109,857,600 |
| Size | 555.1 MB | 104.8 MB |
| Events in quadrant A | 3,730,625 | 754,351 |
| Events in quadrant B | 3,421,572 | 748,974 |
| Events in quadrant C | 3,242,375 | 718,189 |
| Events in quadrant D | 6,815,017 | 672,910 |
| Mode M9 | |||
|---|---|---|---|
| Quadrant | BADHDUFLAG | Total packets | Discarded packets |
| A | 0 | 11 | 0 |
| B | 0 | 11 | 0 |
| C | 0 | 11 | 0 |
| D | 0 | 11 | 0 |
| Mode M0 | |||
|---|---|---|---|
| Quadrant | BADHDUFLAG | Total packets | Discarded packets |
| A | 0 | 14891 | 0 |
| B | 0 | 13794 | 0 |
| C | 0 | 13465 | 0 |
| D | 0 | 24807 | 0 |
| Quadrant | Total seconds | Saturated seconds | Saturation percentage |
|---|---|---|---|
| A | 6189 | 159 | 2.569074% |
| B | 6190 | 162 | 2.617124% |
| C | 6189 | 166 | 2.682178% |
| D | 6189 | 694 | 11.213443% |
Noise dominated data is calculated using 1-second bins in cleaned event files. If a bin has >2000 counts, and if more than 50% of those come from <1% of pixels, then it is considered to be noise-dominated and hence unusable.
| Quadrant | # 1 sec bins | Bins with >0 counts | Bins with >2000 counts | High rate bins dominated by noise | Noise dominated (total time) | Noise dominated (detector-on time) | Marked lightcurve |
|---|---|---|---|---|---|---|---|
| A | 7389 | 6189 | 12 | 12 | 0.16% | 0.19% | 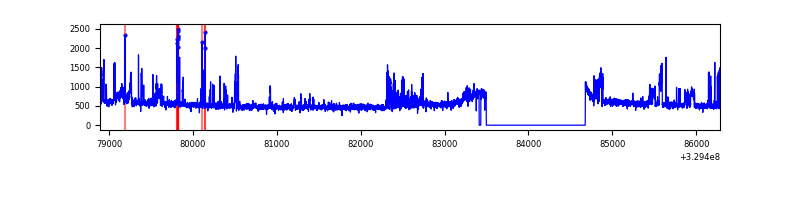 |
| B | 7390 | 6190 | 30 | 30 | 0.41% | 0.48% | 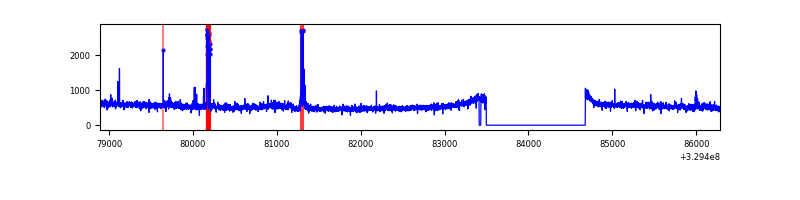 |
| C | 7389 | 6190 | 0 | 0 | 0.00% | 0.00% | 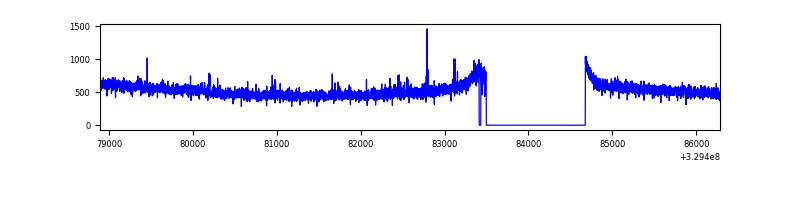 |
| D | 7389 | 6189 | 552 | 552 | 7.47% | 8.92% | 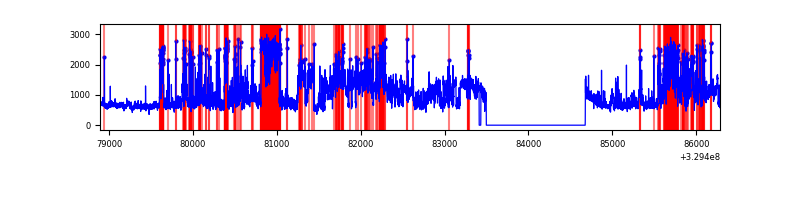 |
Top three noisy pixels from each quadrant. If the there are fewer than three noisy pixels in the level2.evt file, extra rows are filled as -1
| Pixel properties | Quadrant properties | ||||||
|---|---|---|---|---|---|---|---|
| Quadrant | DetID | PixID | Counts | Sigma | Mean | Median | Sigma |
| A | 6 | 16 | 440091 | 2646.09 | 841 | 825 | 166.0 |
| A | 4 | 2 | 42465 | 250.84 | 841 | 825 | 166.0 |
| A | 13 | 254 | 9935 | 54.88 | 841 | 825 | 166.0 |
| B | 0 | 229 | 83789 | 541.35 | 815 | 798 | 153.3 |
| B | 15 | 33 | 69368 | 447.28 | 815 | 798 | 153.3 |
| B | 3 | 112 | 40933 | 261.8 | 815 | 798 | 153.3 |
| C | 14 | 238 | 127559 | 693.07 | 788 | 792 | 182.9 |
| C | 7 | 247 | 37758 | 202.1 | 788 | 792 | 182.9 |
| C | 2 | 16 | 7155 | 34.79 | 788 | 792 | 182.9 |
| D | 1 | 52 | 1896485 | 9951.01 | 789 | 768 | 190.5 |
| D | 7 | 238 | 848975 | 4452.42 | 789 | 768 | 190.5 |
| D | 8 | 195 | 529723 | 2776.6 | 789 | 768 | 190.5 |
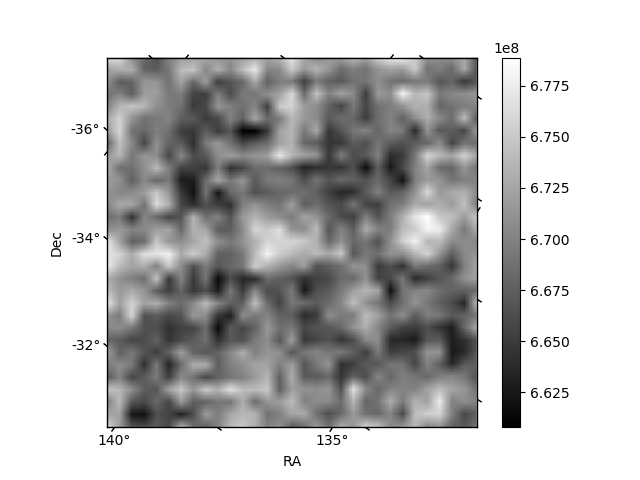
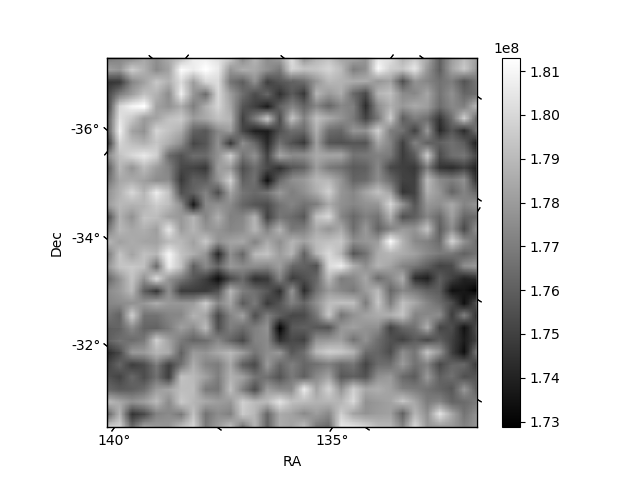
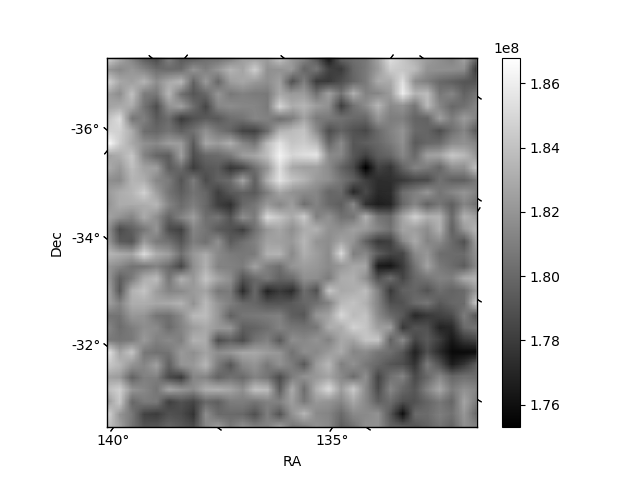
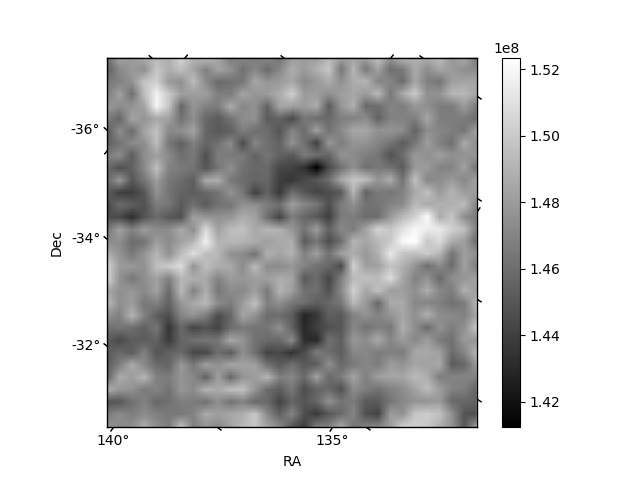
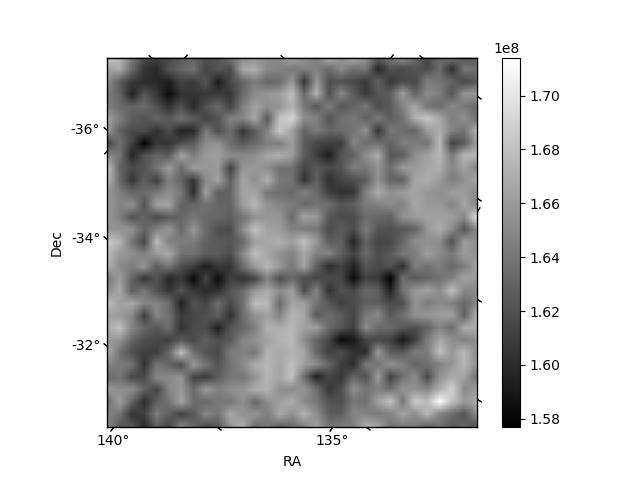
Histogram calculated using DETX and DETY for each event in the final _common_clean file
| Quadrant A | 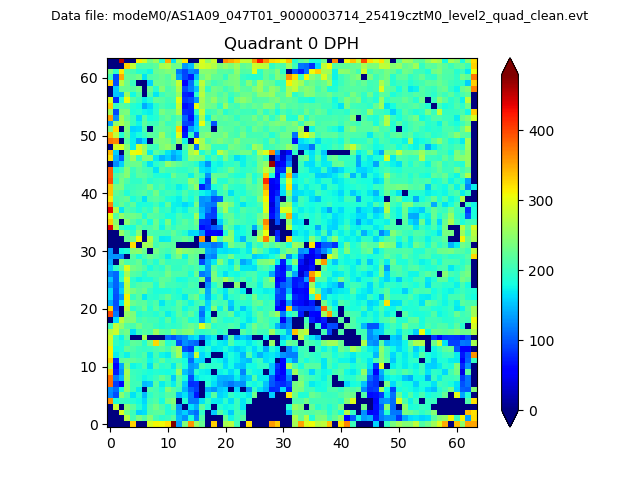 |
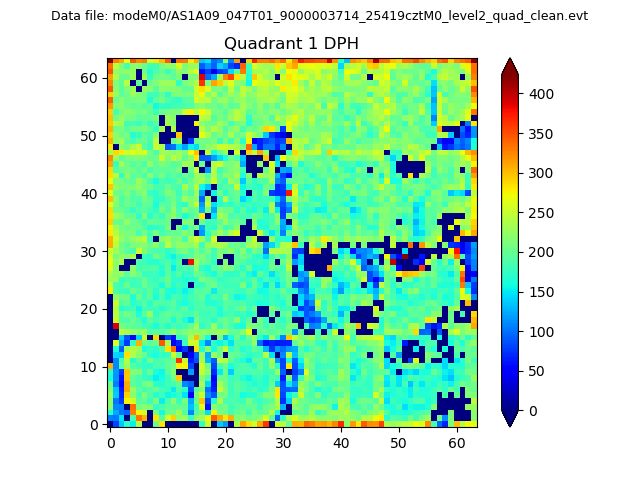 |
Quadrant B |
|---|---|---|---|
| Quadrant D | 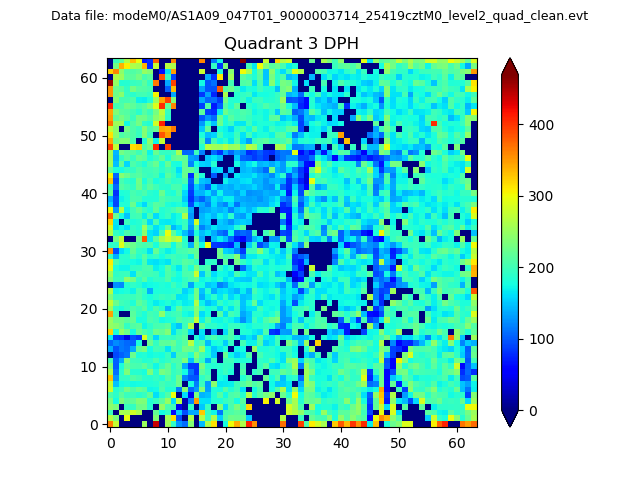 |
 |
Quadrant C |
| Plot type | Count rate plots | Images |
|---|---|---|
| Comparison with Poisson distribution Blue bars denote a histogram of data divided into 1 sec bins. Red curve is a Poisson curve with rate = median count rate of data. |
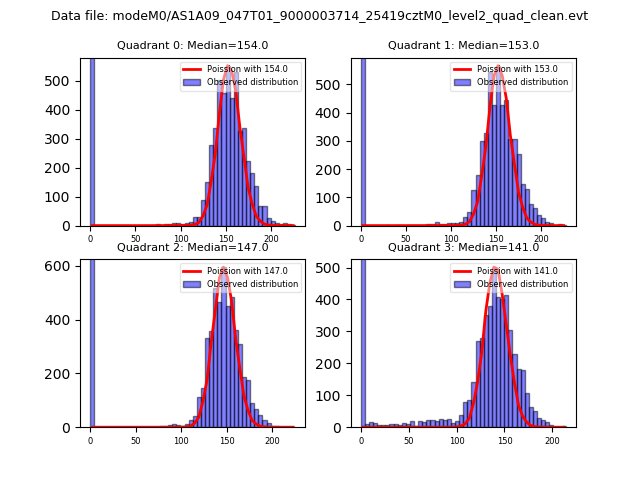 |
 |
| Quadrant-wise count rates Data is divided into 100 sec bins |
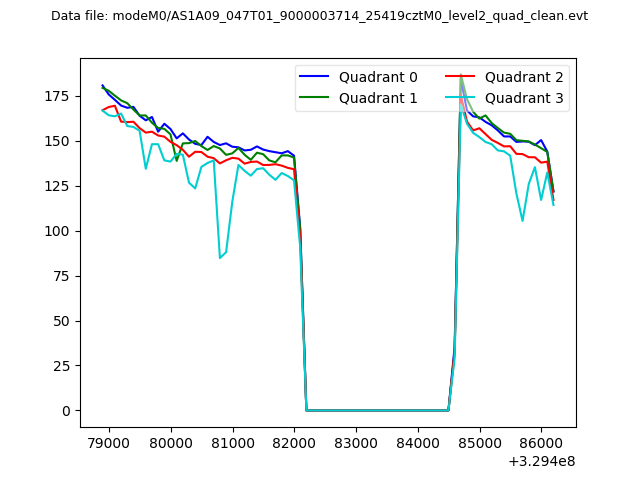 |
|
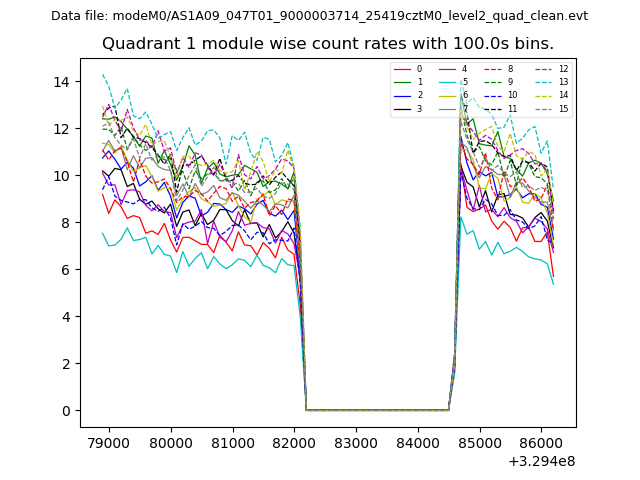
| Module-wise count rates for Quadrant A Data is divided into 100 sec bins |
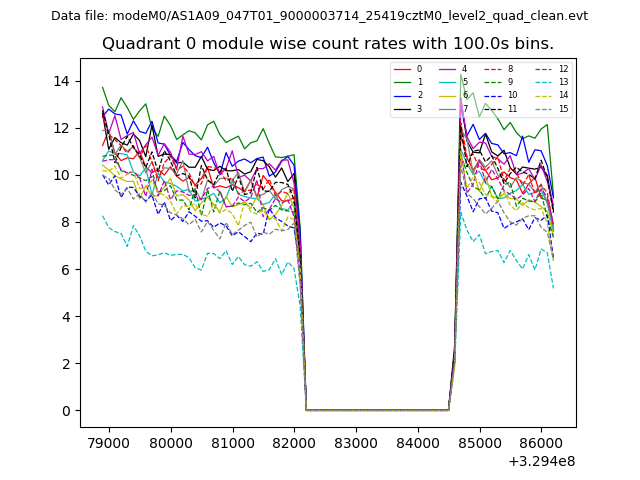 |
 |
| Module-wise count rates for Quadrant B Data is divided into 100 sec bins |
 |
 |
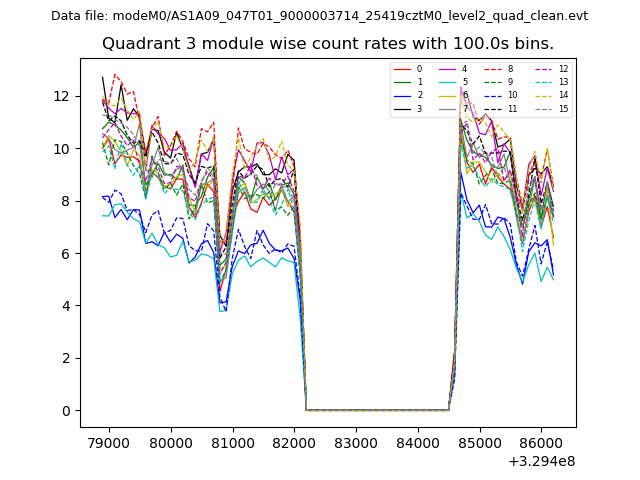
| Module-wise count rates for Quadrant C Data is divided into 100 sec bins |
 |
 |
| Module-wise count rates for Quadrant D Data is divided into 100 sec bins |
 |
 |
| Parameter | Plot |
|---|---|
| CZT HV Monitor | 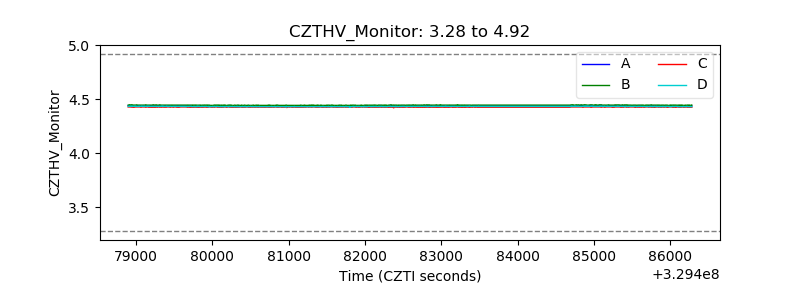 |
| D_VDD | 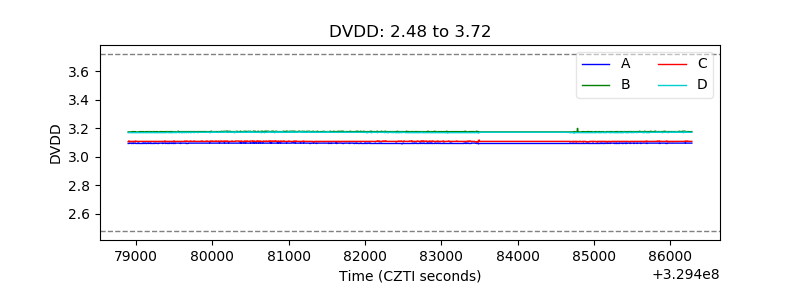 |
| Temperature 1 | 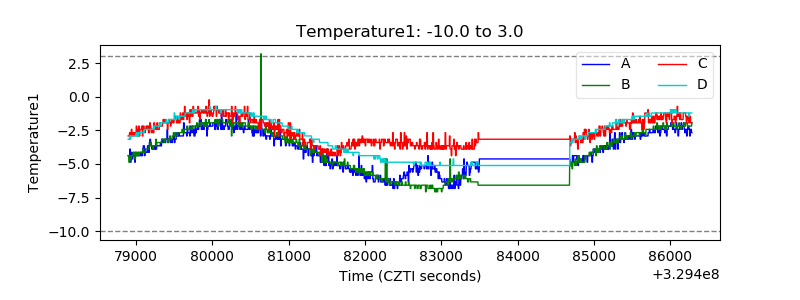 |
| Veto HV Monitor | 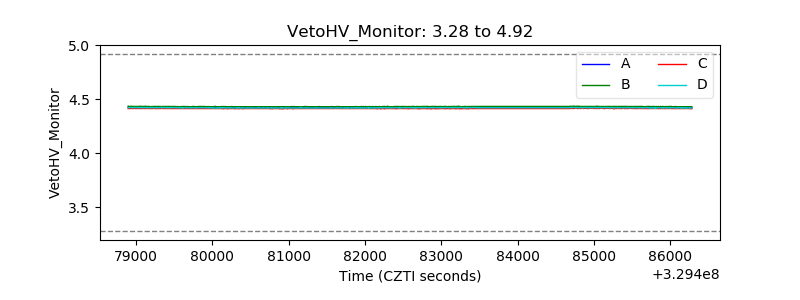 |
| Veto LLD |  |
| Alpha Counter | 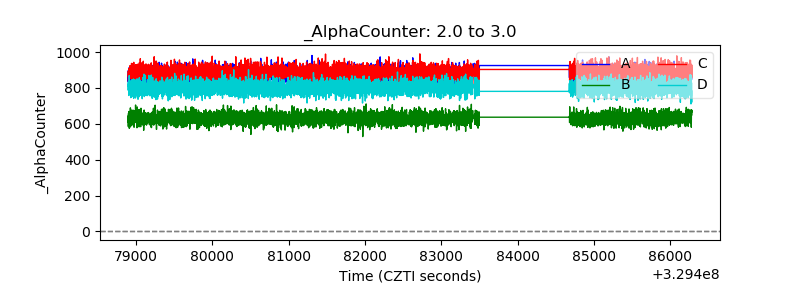 |
| _CPM_Rate | 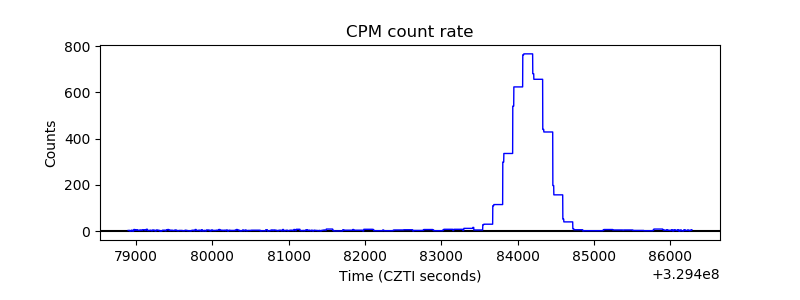 |
| CZT Counter |  |
| +2.5 Volts monitor |  |
| +5 Volts monitor | 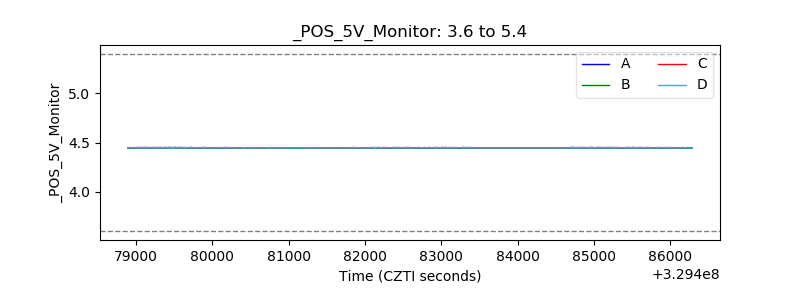 |
| _ROLL_ROT | 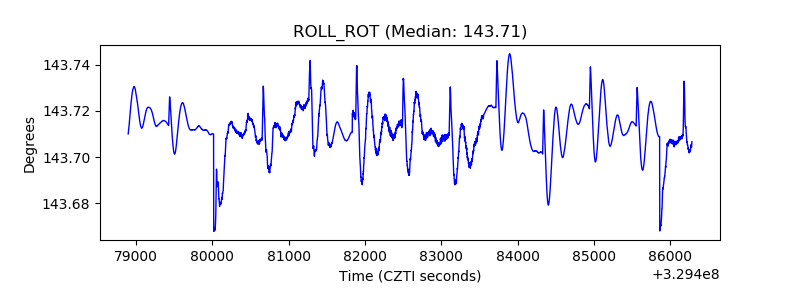 |
| _Roll_DEC | 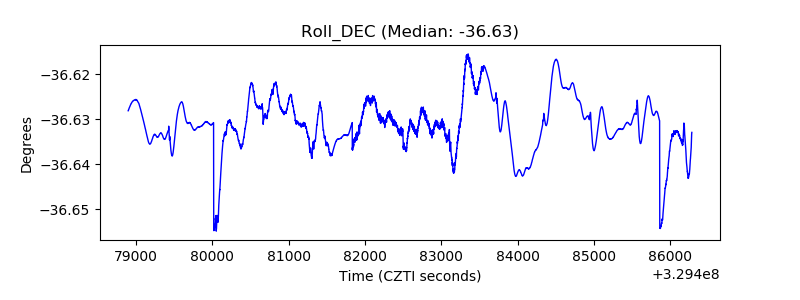 |
| _Roll_RA | 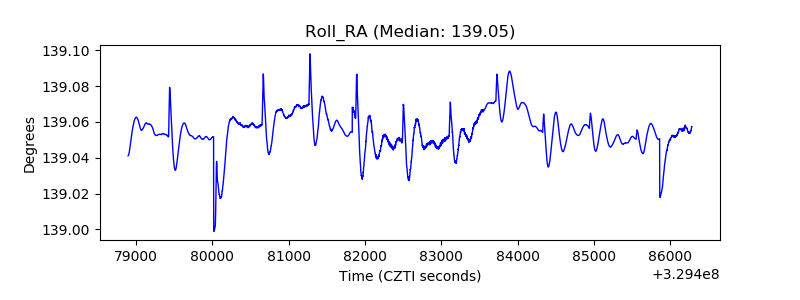 |
| Veto Counter | 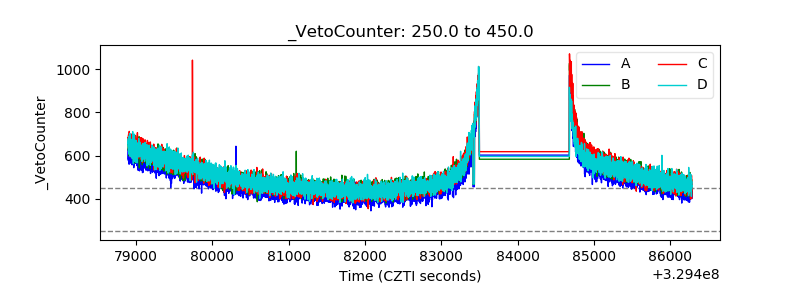 |