| Param | Original file | Final file |
|---|---|---|
| Filename | modeM0/AS1A09_047T01_9000003714_25420cztM0_level2.evt | modeM0/AS1A09_047T01_9000003714_25420cztM0_level2_quad_clean.evt |
| Size (bytes) | 548,233,920 | 86,734,080 |
| Size | 522.8 MB | 82.7 MB |
| Events in quadrant A | 3,519,673 | 573,491 |
| Events in quadrant B | 3,034,718 | 571,406 |
| Events in quadrant C | 2,947,446 | 546,890 |
| Events in quadrant D | 6,696,409 | 516,333 |
| Mode M9 | |||
|---|---|---|---|
| Quadrant | BADHDUFLAG | Total packets | Discarded packets |
| A | 0 | 10 | 0 |
| B | 0 | 10 | 0 |
| C | 0 | 10 | 0 |
| D | 0 | 10 | 0 |
| Mode M0 | |||
|---|---|---|---|
| Quadrant | BADHDUFLAG | Total packets | Discarded packets |
| A | 0 | 14140 | 0 |
| B | 0 | 12589 | 0 |
| C | 0 | 12502 | 0 |
| D | 0 | 24151 | 0 |
| Quadrant | Total seconds | Saturated seconds | Saturation percentage |
|---|---|---|---|
| A | 5986 | 55 | 0.918811% |
| B | 5987 | 50 | 0.835143% |
| C | 5987 | 66 | 1.102389% |
| D | 5987 | 479 | 8.000668% |
Noise dominated data is calculated using 1-second bins in cleaned event files. If a bin has >2000 counts, and if more than 50% of those come from <1% of pixels, then it is considered to be noise-dominated and hence unusable.
| Quadrant | # 1 sec bins | Bins with >0 counts | Bins with >2000 counts | High rate bins dominated by noise | Noise dominated (total time) | Noise dominated (detector-on time) | Marked lightcurve |
|---|---|---|---|---|---|---|---|
| A | 6996 | 5986 | 0 | 0 | 0.00% | 0.00% | 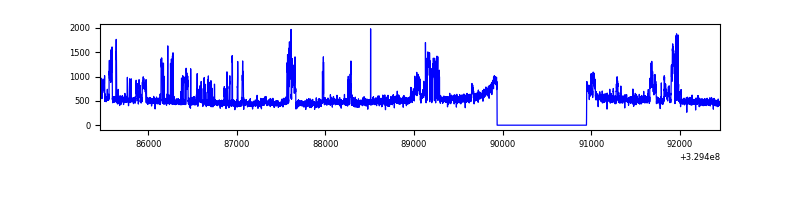 |
| B | 6997 | 5987 | 2 | 2 | 0.03% | 0.03% | 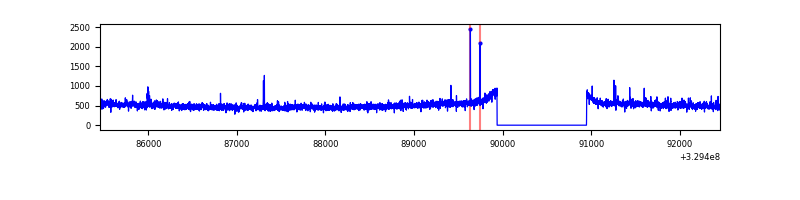 |
| C | 6997 | 5988 | 0 | 0 | 0.00% | 0.00% | 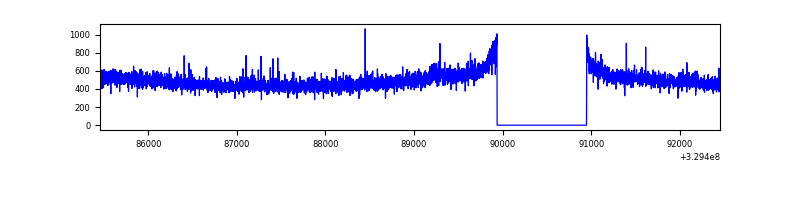 |
| D | 6997 | 5987 | 436 | 436 | 6.23% | 7.28% | 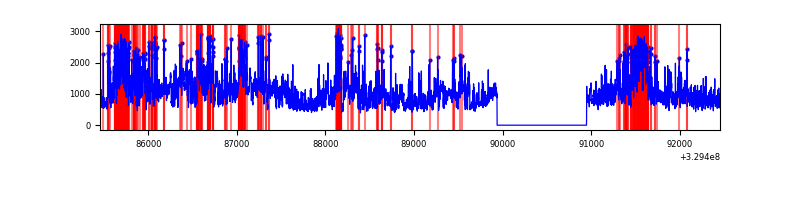 |
Top three noisy pixels from each quadrant. If the there are fewer than three noisy pixels in the level2.evt file, extra rows are filled as -1
| Pixel properties | Quadrant properties | ||||||
|---|---|---|---|---|---|---|---|
| Quadrant | DetID | PixID | Counts | Sigma | Mean | Median | Sigma |
| A | 6 | 16 | 569549 | 3718.43 | 764 | 749 | 153.0 |
| A | 13 | 254 | 9605 | 57.89 | 764 | 749 | 153.0 |
| A | 3 | 137 | 6785 | 39.46 | 764 | 749 | 153.0 |
| B | 3 | 112 | 48841 | 337.68 | 746 | 727 | 142.5 |
| B | 0 | 229 | 40363 | 278.18 | 746 | 727 | 142.5 |
| B | 12 | 111 | 17036 | 114.46 | 746 | 727 | 142.5 |
| C | 14 | 238 | 116274 | 691.74 | 716 | 723 | 167.0 |
| C | 7 | 247 | 31865 | 186.43 | 716 | 723 | 167.0 |
| C | 2 | 16 | 5557 | 28.94 | 716 | 723 | 167.0 |
| D | 1 | 52 | 2359844 | 13501.49 | 721 | 700 | 174.7 |
| D | 7 | 238 | 711410 | 4067.43 | 721 | 700 | 174.7 |
| D | 8 | 195 | 569880 | 3257.44 | 721 | 700 | 174.7 |
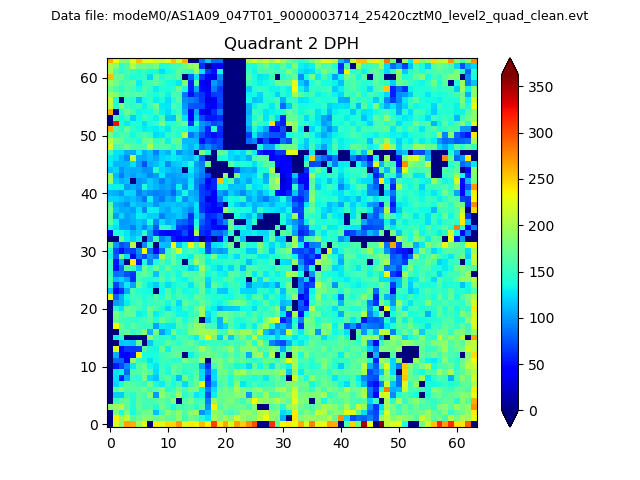
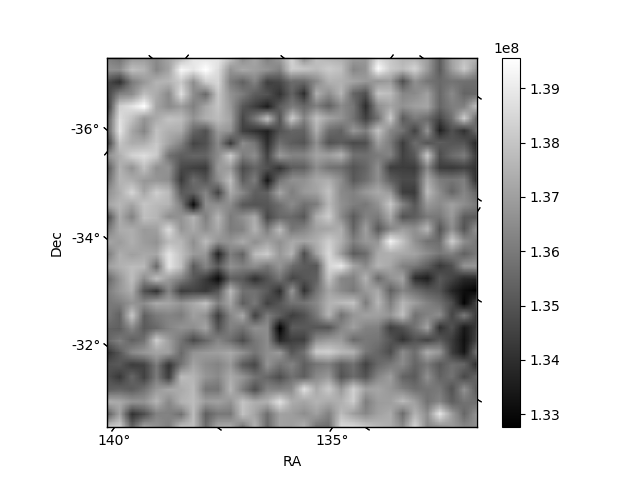
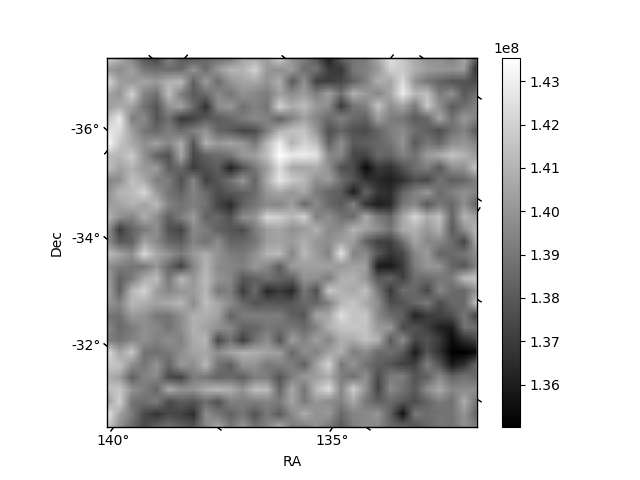
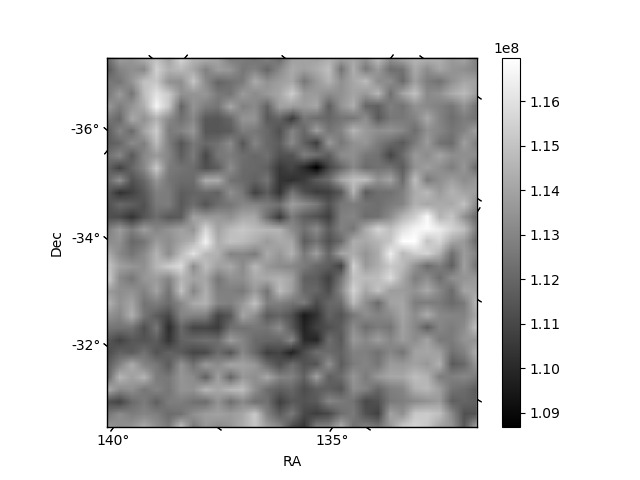
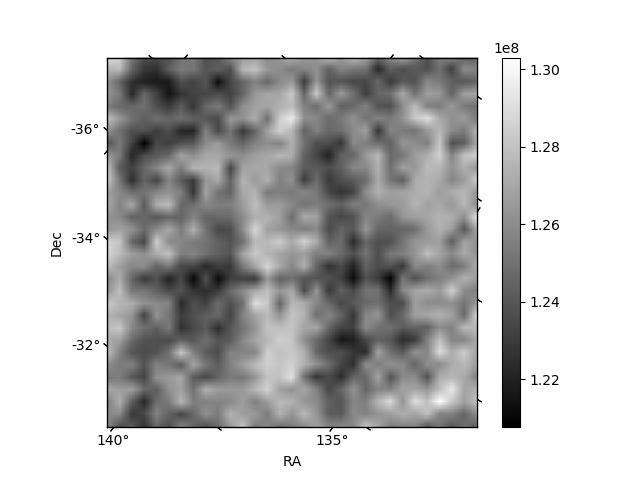
Histogram calculated using DETX and DETY for each event in the final _common_clean file
| Quadrant A | 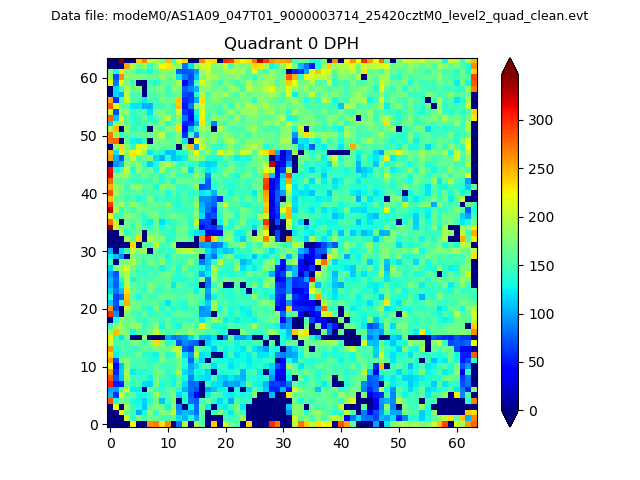 |
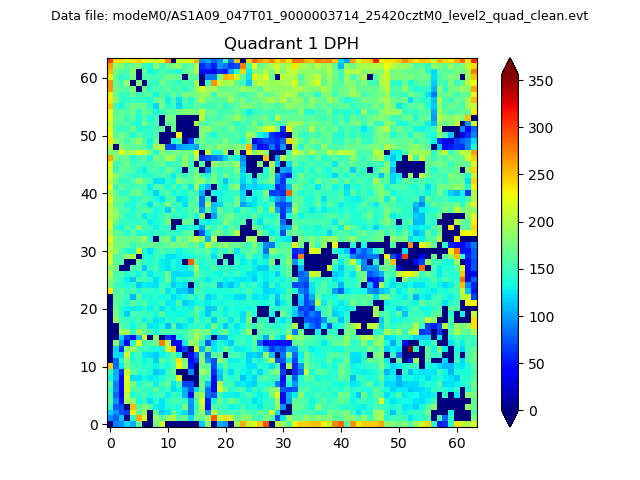 |
Quadrant B |
|---|---|---|---|
| Quadrant D | 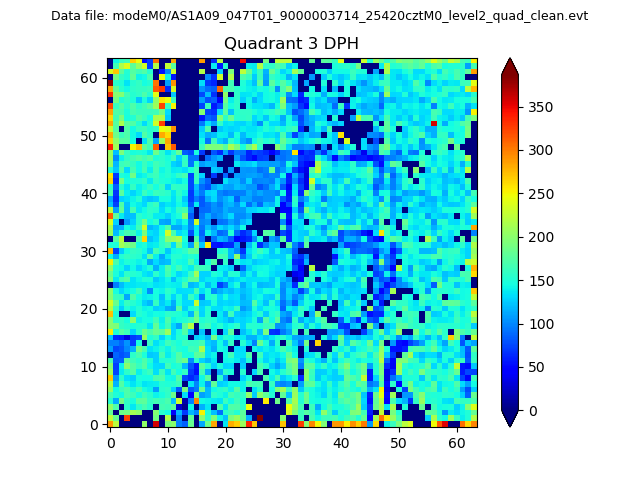 |
 |
Quadrant C |
| Plot type | Count rate plots | Images |
|---|---|---|
| Comparison with Poisson distribution Blue bars denote a histogram of data divided into 1 sec bins. Red curve is a Poisson curve with rate = median count rate of data. |
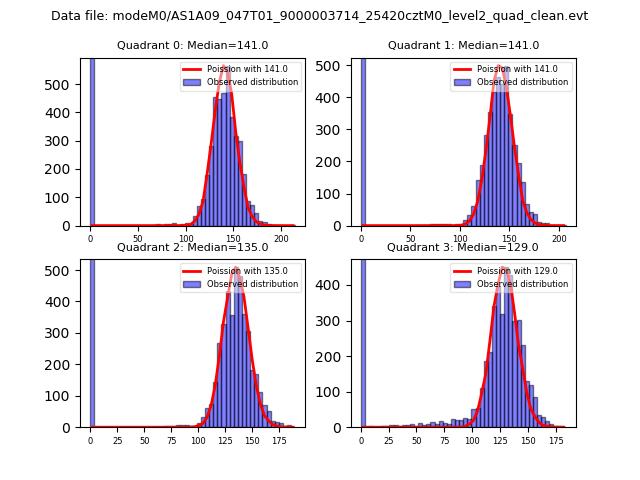 |
 |
| Quadrant-wise count rates Data is divided into 100 sec bins |
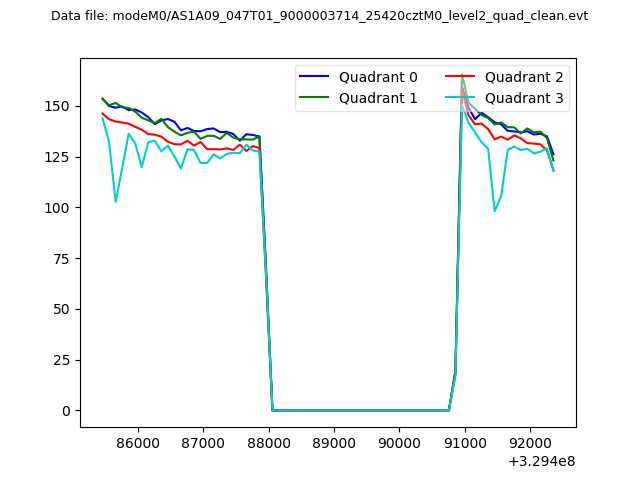 |
|
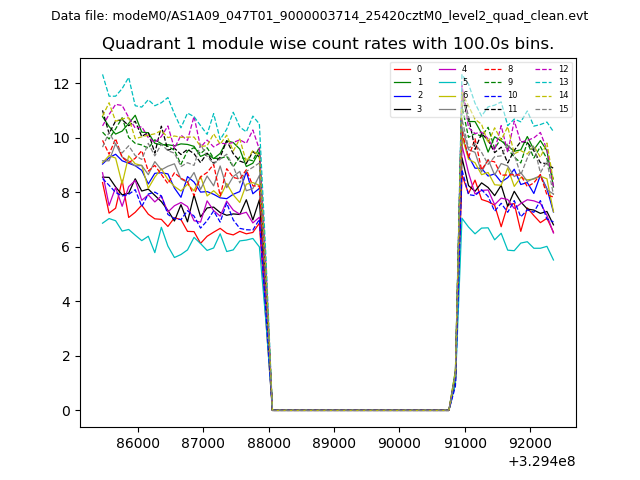
| Module-wise count rates for Quadrant A Data is divided into 100 sec bins |
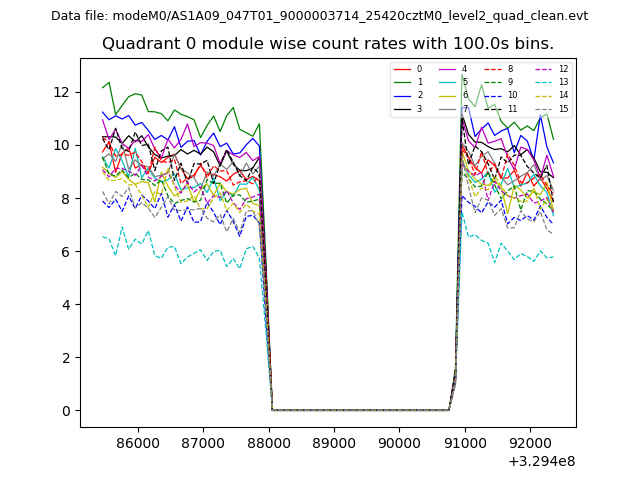 |
 |
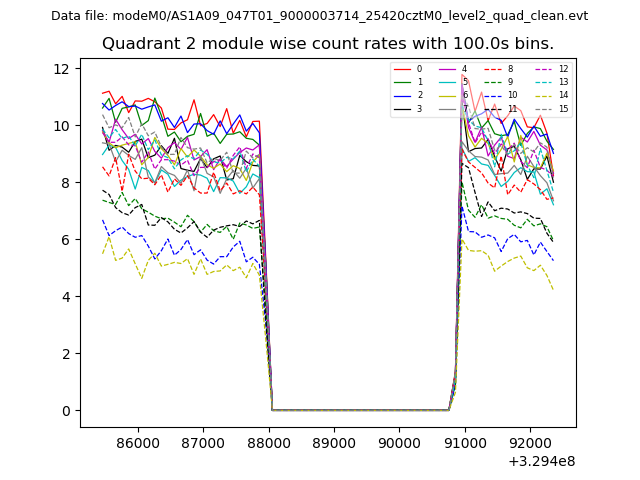
| Module-wise count rates for Quadrant B Data is divided into 100 sec bins |
 |
 |
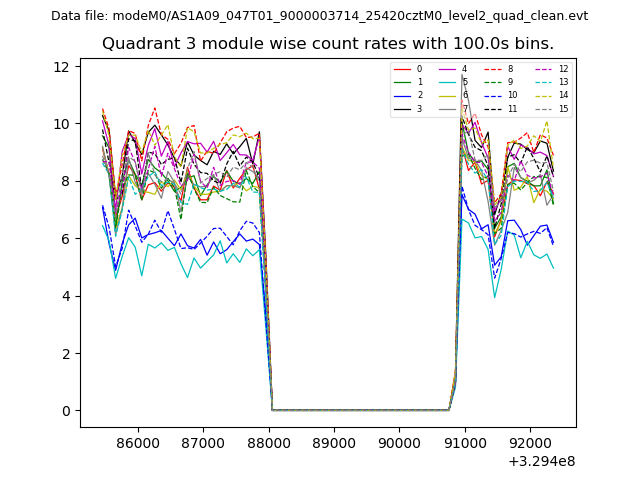
| Module-wise count rates for Quadrant C Data is divided into 100 sec bins |
 |
 |
| Module-wise count rates for Quadrant D Data is divided into 100 sec bins |
 |
 |
| Parameter | Plot |
|---|---|
| CZT HV Monitor | 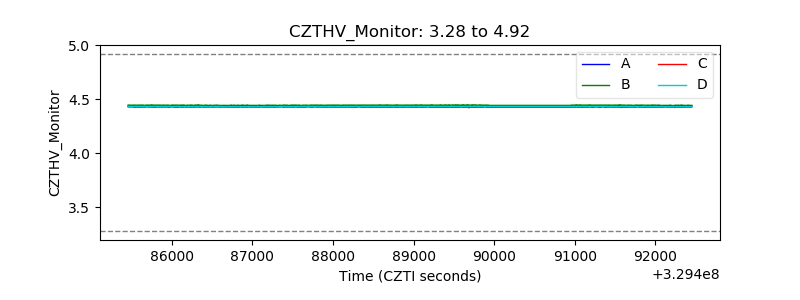 |
| D_VDD | 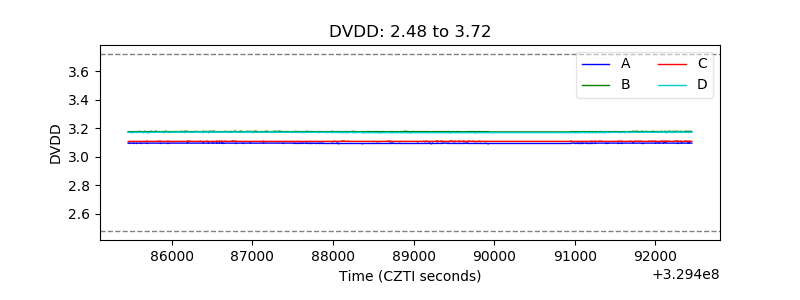 |
| Temperature 1 | 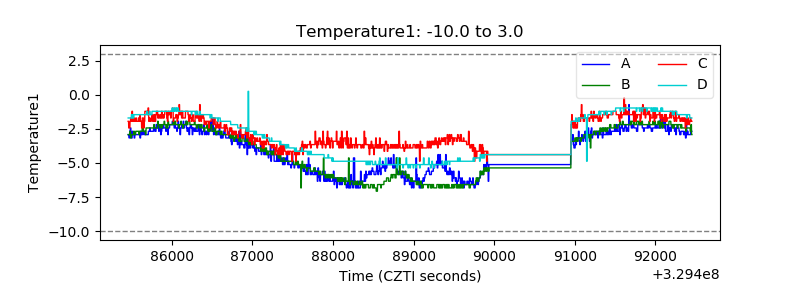 |
| Veto HV Monitor | 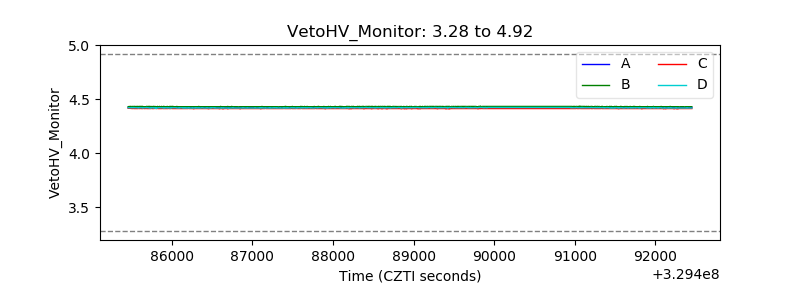 |
| Veto LLD | 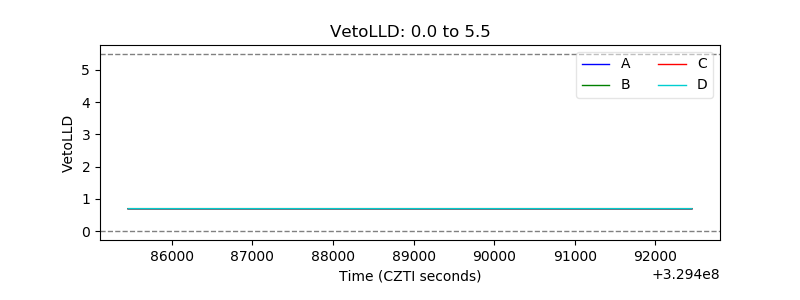 |
| Alpha Counter | 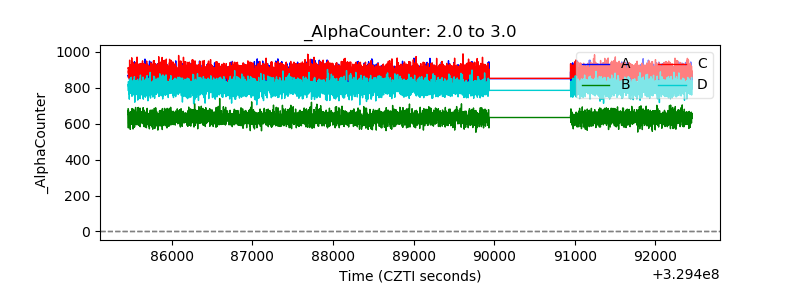 |
| _CPM_Rate | 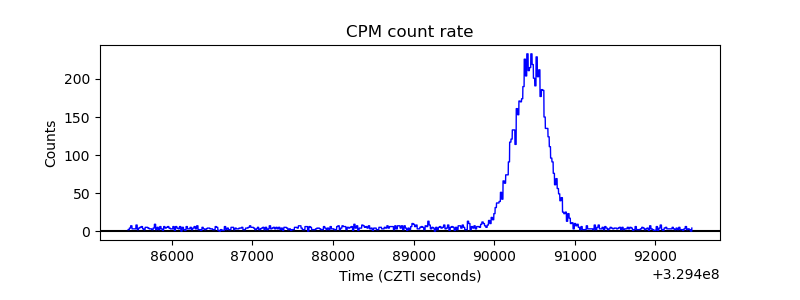 |
| CZT Counter | 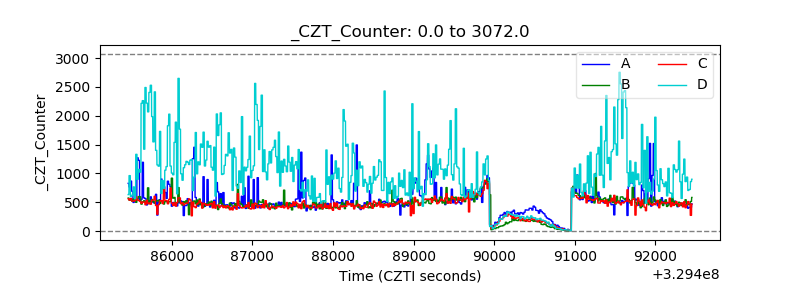 |
| +2.5 Volts monitor |  |
| +5 Volts monitor |  |
| _ROLL_ROT | 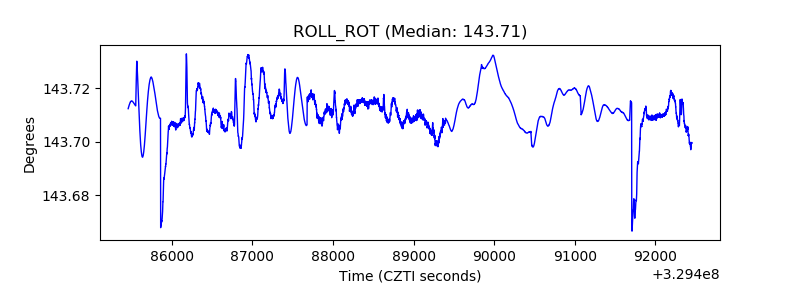 |
| _Roll_DEC | 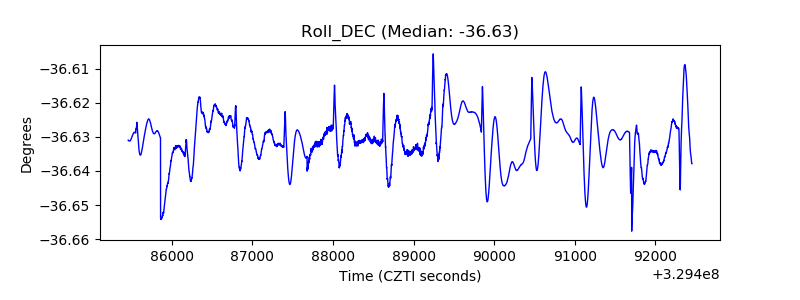 |
| _Roll_RA |  |
| Veto Counter | 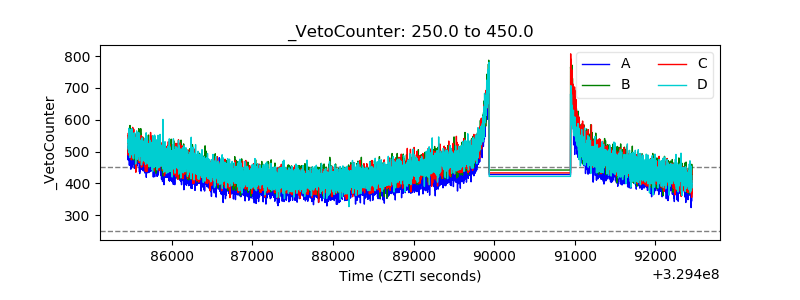 |