| Param | Original file | Final file |
|---|---|---|
| Filename | modeM0/AS1A09_047T01_9000003714_25421cztM0_level2.evt | modeM0/AS1A09_047T01_9000003714_25421cztM0_level2_quad_clean.evt |
| Size (bytes) | 585,192,960 | 95,901,120 |
| Size | 558.1 MB | 91.5 MB |
| Events in quadrant A | 4,090,445 | 627,635 |
| Events in quadrant B | 3,385,214 | 632,945 |
| Events in quadrant C | 3,260,096 | 607,817 |
| Events in quadrant D | 6,532,966 | 568,189 |
| Mode M9 | |||
|---|---|---|---|
| Quadrant | BADHDUFLAG | Total packets | Discarded packets |
| A | 0 | 5 | 0 |
| B | 0 | 5 | 0 |
| C | 0 | 5 | 0 |
| D | 0 | 5 | 0 |
| Mode M0 | |||
|---|---|---|---|
| Quadrant | BADHDUFLAG | Total packets | Discarded packets |
| A | 0 | 16491 | 0 |
| B | 0 | 14087 | 0 |
| C | 0 | 13966 | 0 |
| D | 0 | 24212 | 0 |
| Quadrant | Total seconds | Saturated seconds | Saturation percentage |
|---|---|---|---|
| A | 6701 | 133 | 1.984778% |
| B | 6702 | 85 | 1.268278% |
| C | 6702 | 93 | 1.387645% |
| D | 6701 | 473 | 7.058648% |
Noise dominated data is calculated using 1-second bins in cleaned event files. If a bin has >2000 counts, and if more than 50% of those come from <1% of pixels, then it is considered to be noise-dominated and hence unusable.
| Quadrant | # 1 sec bins | Bins with >0 counts | Bins with >2000 counts | High rate bins dominated by noise | Noise dominated (total time) | Noise dominated (detector-on time) | Marked lightcurve |
|---|---|---|---|---|---|---|---|
| A | 7251 | 6701 | 95 | 95 | 1.31% | 1.42% | 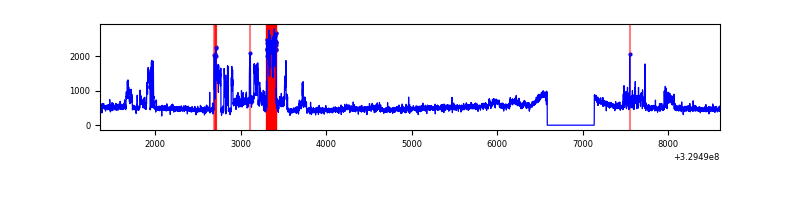 |
| B | 7252 | 6702 | 0 | 0 | 0.00% | 0.00% | 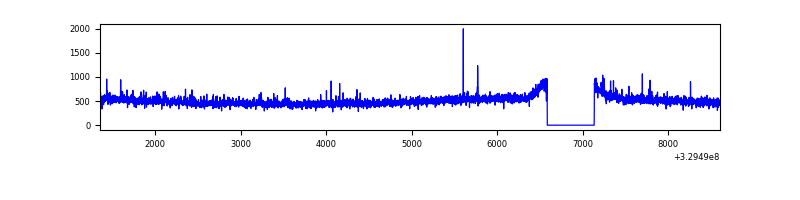 |
| C | 7252 | 6702 | 0 | 0 | 0.00% | 0.00% | 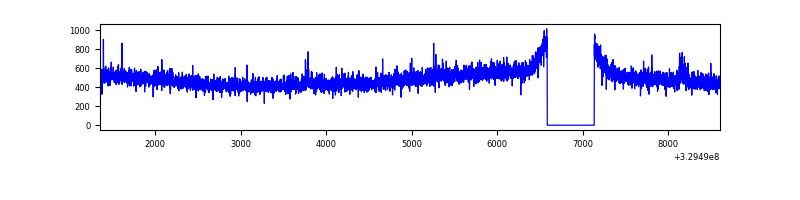 |
| D | 7251 | 6701 | 326 | 326 | 4.50% | 4.86% | 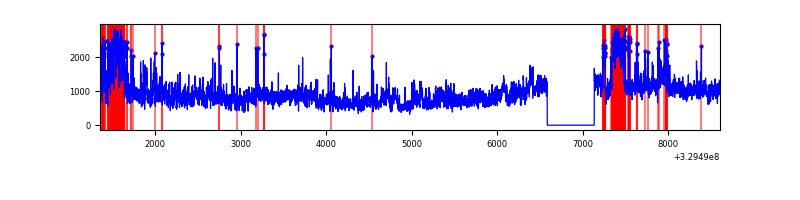 |
Top three noisy pixels from each quadrant. If the there are fewer than three noisy pixels in the level2.evt file, extra rows are filled as -1
| Pixel properties | Quadrant properties | ||||||
|---|---|---|---|---|---|---|---|
| Quadrant | DetID | PixID | Counts | Sigma | Mean | Median | Sigma |
| A | 6 | 16 | 838940 | 4978.18 | 841 | 823 | 168.4 |
| A | 13 | 254 | 10474 | 57.32 | 841 | 823 | 168.4 |
| A | 3 | 137 | 7782 | 41.33 | 841 | 823 | 168.4 |
| B | 3 | 112 | 69920 | 435.22 | 827 | 806 | 158.8 |
| B | 0 | 229 | 54784 | 339.9 | 827 | 806 | 158.8 |
| B | 12 | 111 | 19436 | 117.31 | 827 | 806 | 158.8 |
| C | 14 | 238 | 128873 | 688.4 | 794 | 798 | 186.0 |
| C | 7 | 247 | 31753 | 166.38 | 794 | 798 | 186.0 |
| C | 2 | 16 | 5555 | 25.57 | 794 | 798 | 186.0 |
| D | 1 | 52 | 2266202 | 11988.09 | 788 | 767 | 189.0 |
| D | 7 | 238 | 648523 | 3427.75 | 788 | 767 | 189.0 |
| D | 8 | 195 | 571819 | 3021.86 | 788 | 767 | 189.0 |
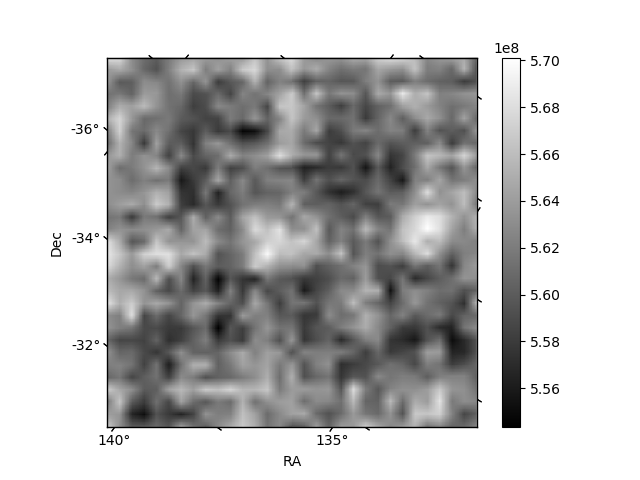
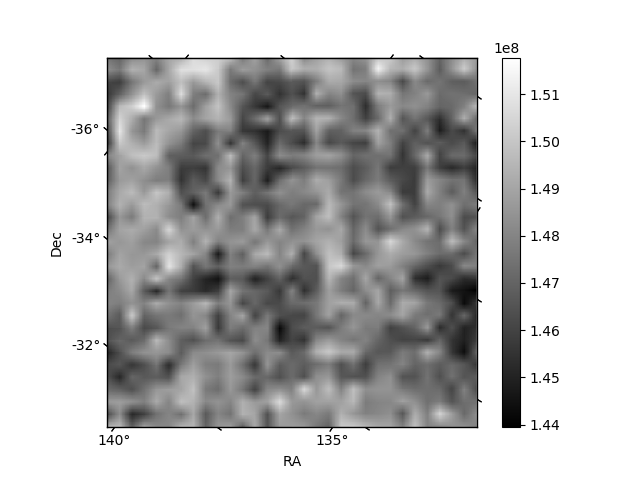
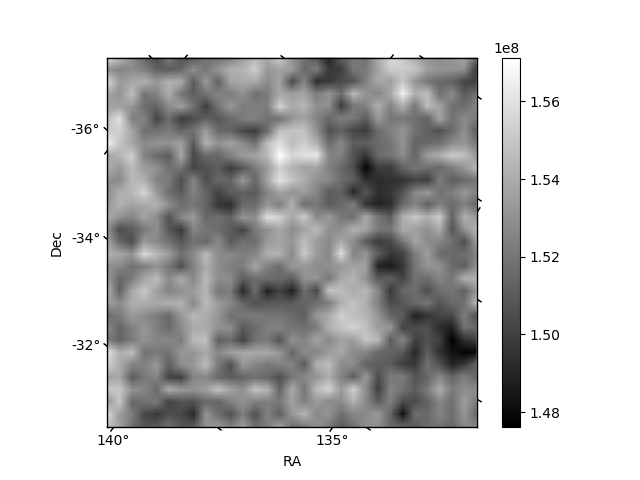
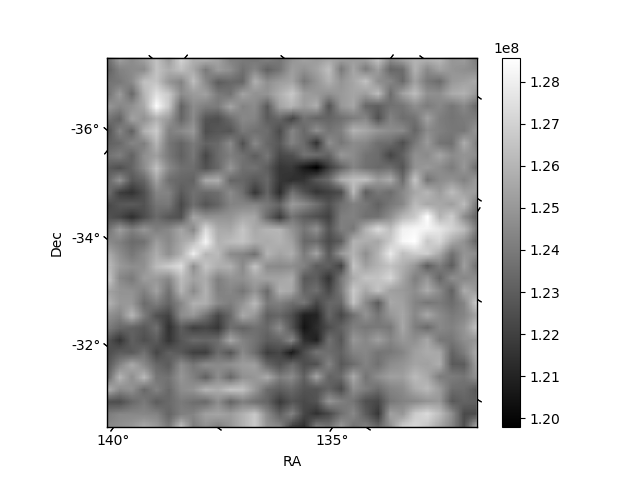
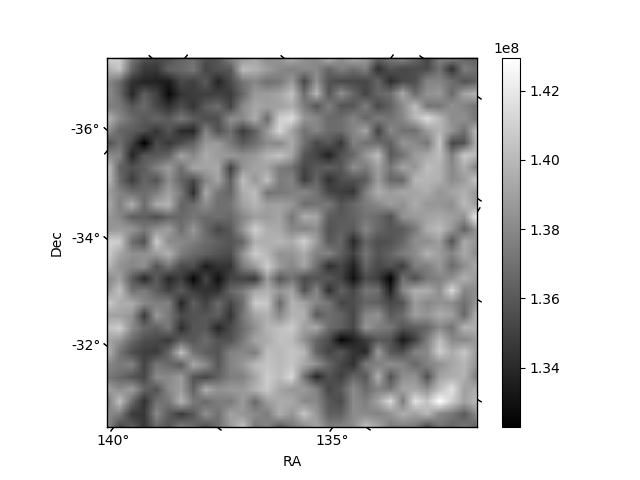
Histogram calculated using DETX and DETY for each event in the final _common_clean file
| Quadrant A | 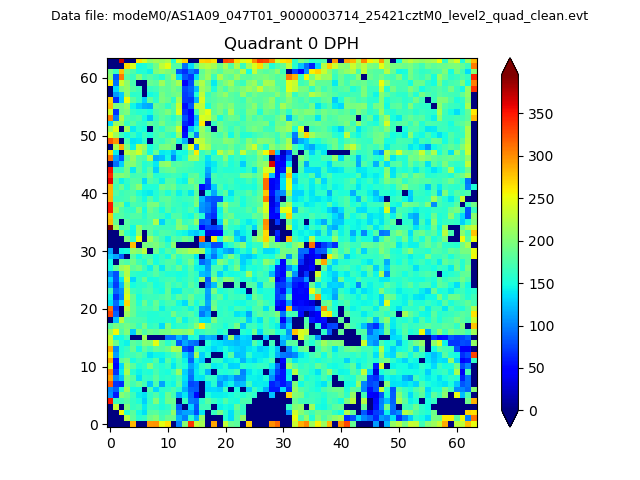 |
 |
Quadrant B |
|---|---|---|---|
| Quadrant D | 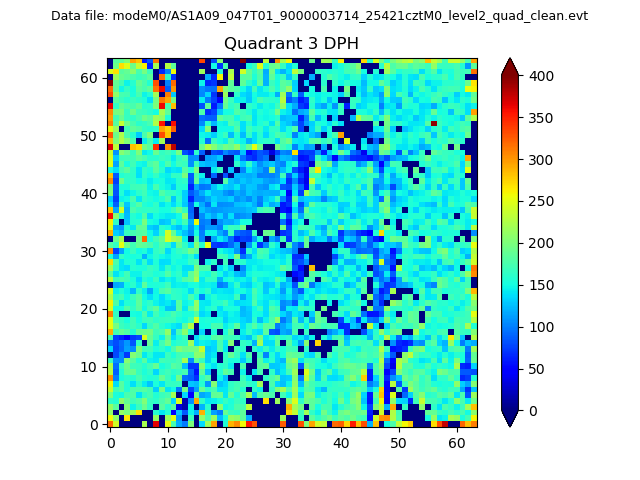 |
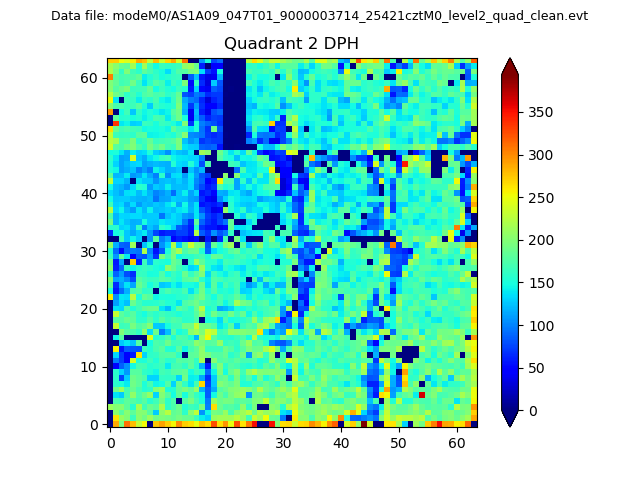 |
Quadrant C |
| Plot type | Count rate plots | Images |
|---|---|---|
| Comparison with Poisson distribution Blue bars denote a histogram of data divided into 1 sec bins. Red curve is a Poisson curve with rate = median count rate of data. |
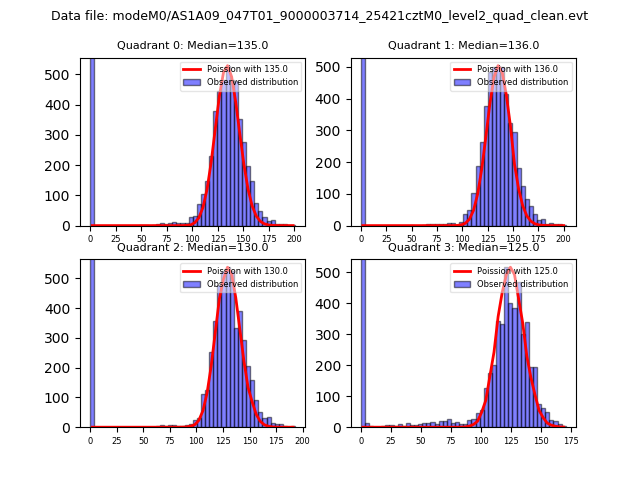 |
 |
| Quadrant-wise count rates Data is divided into 100 sec bins |
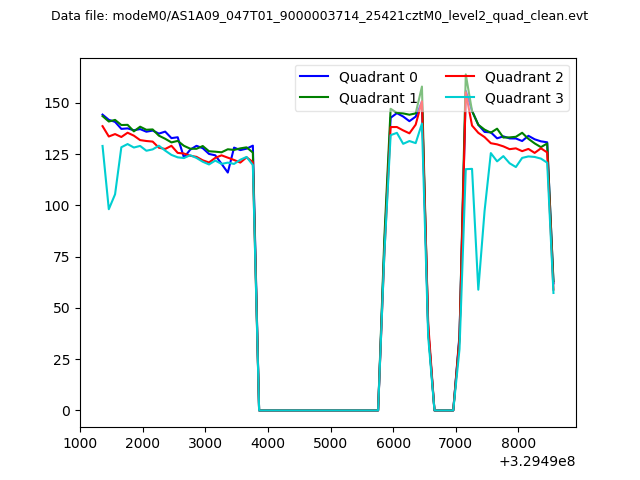 |
|
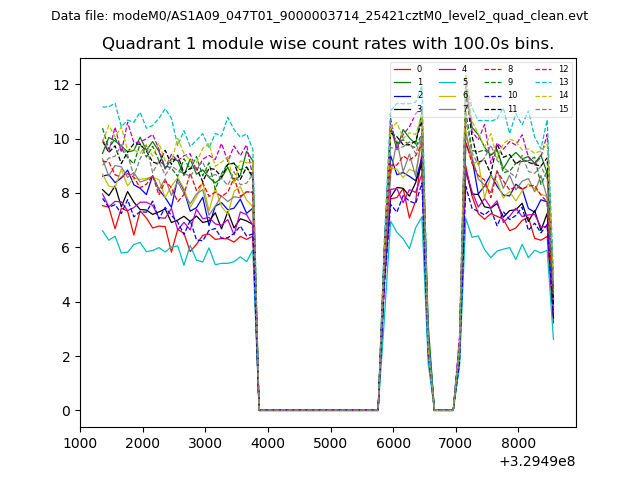
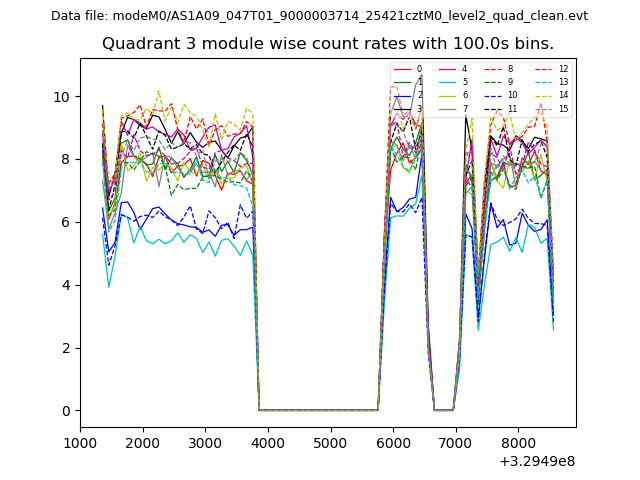
| Module-wise count rates for Quadrant A Data is divided into 100 sec bins |
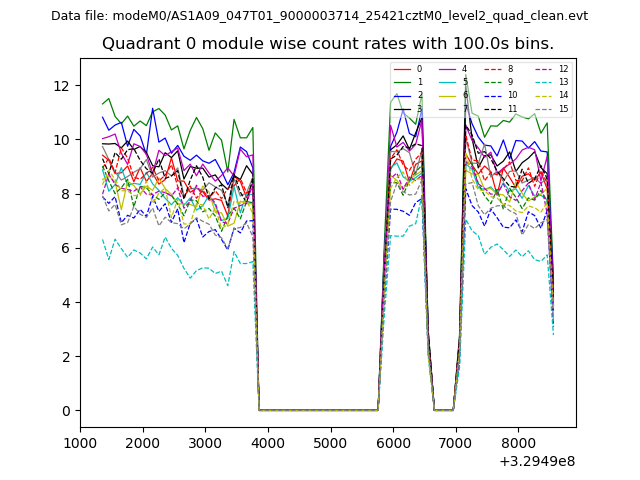 |
 |
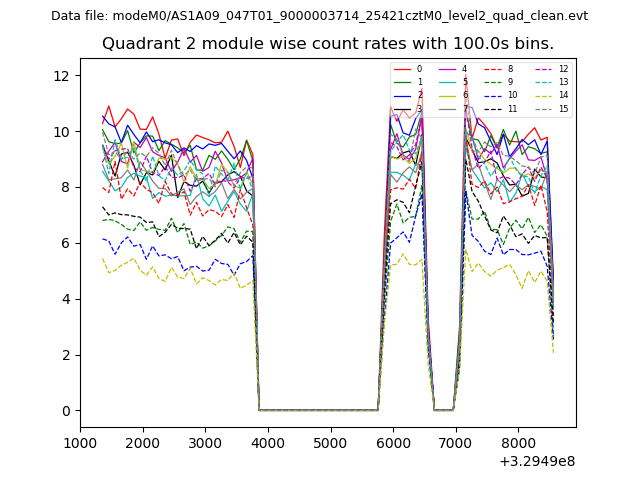
| Module-wise count rates for Quadrant B Data is divided into 100 sec bins |
 |
 |
| Module-wise count rates for Quadrant C Data is divided into 100 sec bins |
 |
 |
| Module-wise count rates for Quadrant D Data is divided into 100 sec bins |
 |
 |
| Parameter | Plot |
|---|---|
| CZT HV Monitor | 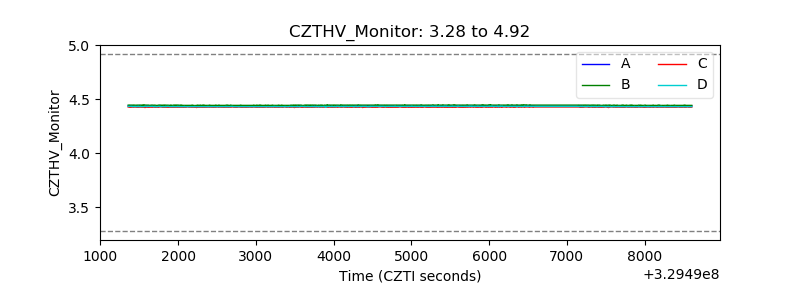 |
| D_VDD | 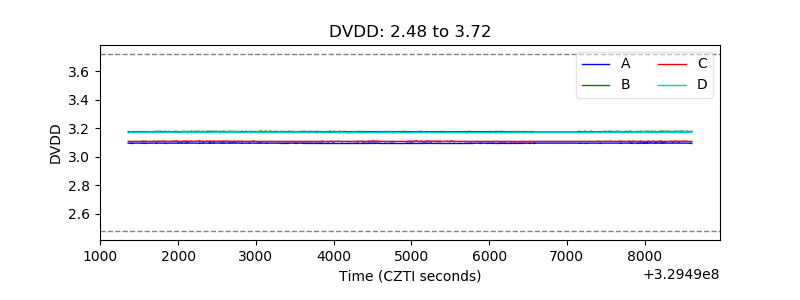 |
| Temperature 1 |  |
| Veto HV Monitor | 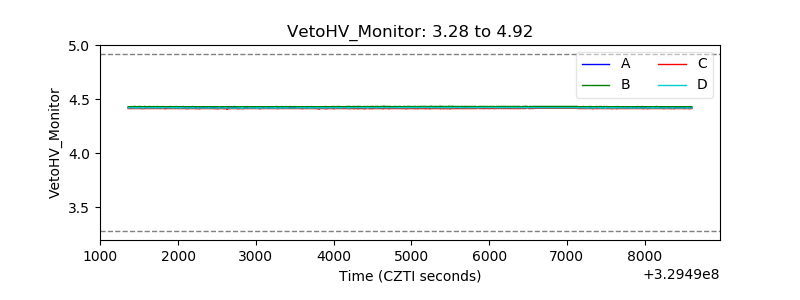 |
| Veto LLD |  |
| Alpha Counter | 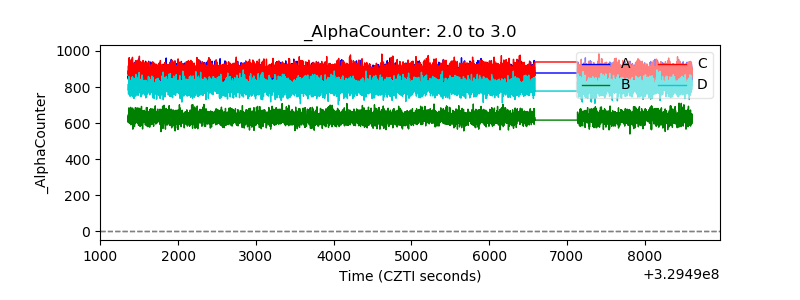 |
| _CPM_Rate | 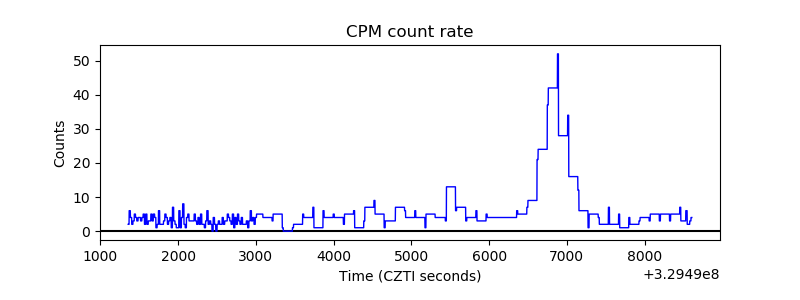 |
| CZT Counter | 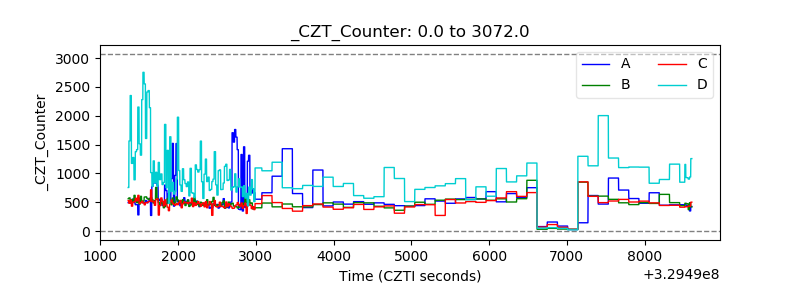 |
| +2.5 Volts monitor |  |
| +5 Volts monitor | 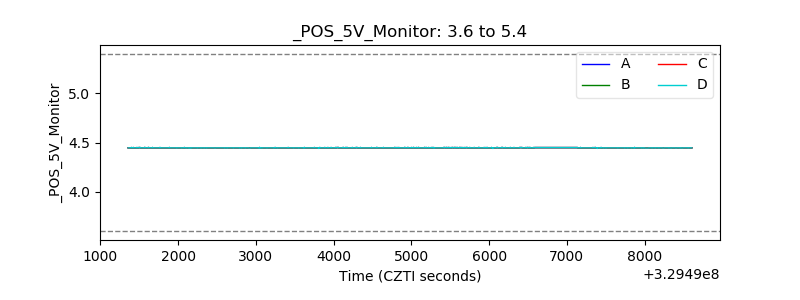 |
| _ROLL_ROT | 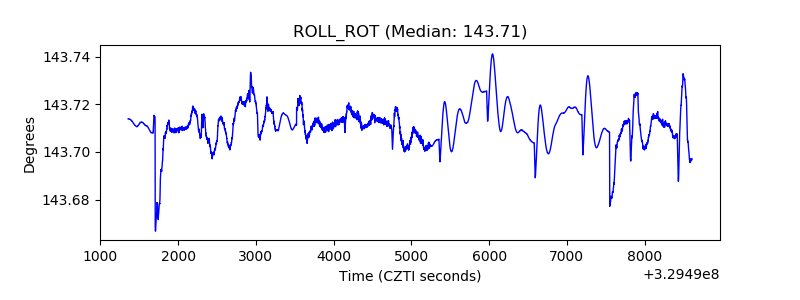 |
| _Roll_DEC | 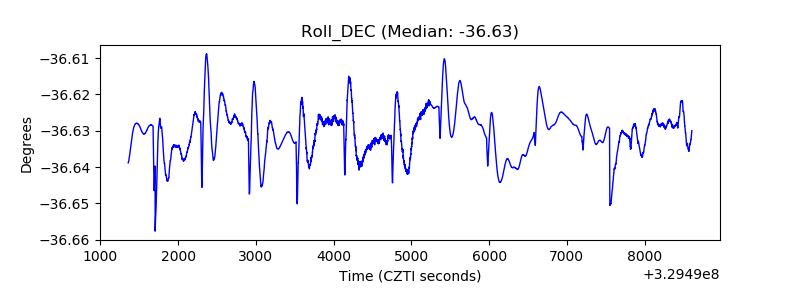 |
| _Roll_RA |  |
| Veto Counter | 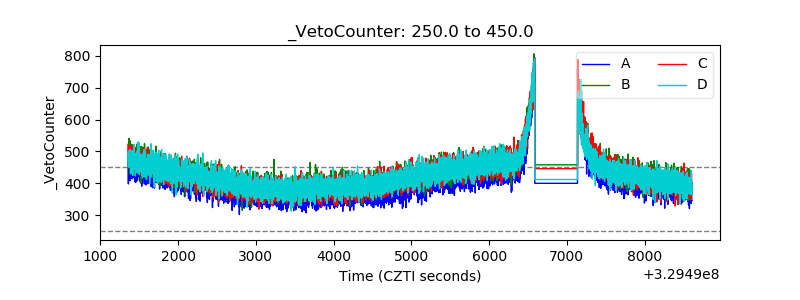 |