| Param | Original file | Final file |
|---|---|---|
| Filename | modeM0/AS1A09_047T01_9000003714_25422cztM0_level2.evt | modeM0/AS1A09_047T01_9000003714_25422cztM0_level2_quad_clean.evt |
| Size (bytes) | 625,147,200 | 110,471,040 |
| Size | 596.2 MB | 105.4 MB |
| Events in quadrant A | 3,860,985 | 727,633 |
| Events in quadrant B | 3,741,203 | 728,523 |
| Events in quadrant C | 3,613,450 | 699,725 |
| Events in quadrant D | 7,210,576 | 669,209 |
| Mode M9 | |||
|---|---|---|---|
| Quadrant | BADHDUFLAG | Total packets | Discarded packets |
| A | 0 | 1 | 0 |
| B | 0 | 1 | 0 |
| C | 0 | 1 | 0 |
| D | 0 | 1 | 0 |
| Mode M0 | |||
|---|---|---|---|
| Quadrant | BADHDUFLAG | Total packets | Discarded packets |
| A | 0 | 16243 | 0 |
| B | 0 | 15669 | 0 |
| C | 0 | 15551 | 0 |
| D | 0 | 26694 | 0 |
| Quadrant | Total seconds | Saturated seconds | Saturation percentage |
|---|---|---|---|
| A | 7470 | 108 | 1.445783% |
| B | 7471 | 121 | 1.619596% |
| C | 7471 | 146 | 1.954223% |
| D | 7471 | 468 | 6.264222% |
Noise dominated data is calculated using 1-second bins in cleaned event files. If a bin has >2000 counts, and if more than 50% of those come from <1% of pixels, then it is considered to be noise-dominated and hence unusable.
| Quadrant | # 1 sec bins | Bins with >0 counts | Bins with >2000 counts | High rate bins dominated by noise | Noise dominated (total time) | Noise dominated (detector-on time) | Marked lightcurve |
|---|---|---|---|---|---|---|---|
| A | 7640 | 7470 | 1 | 1 | 0.01% | 0.01% | 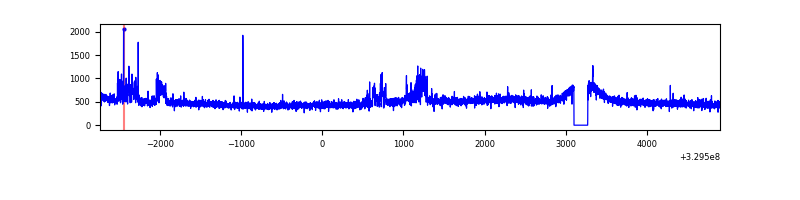 |
| B | 7641 | 7472 | 0 | 0 | 0.00% | 0.00% | 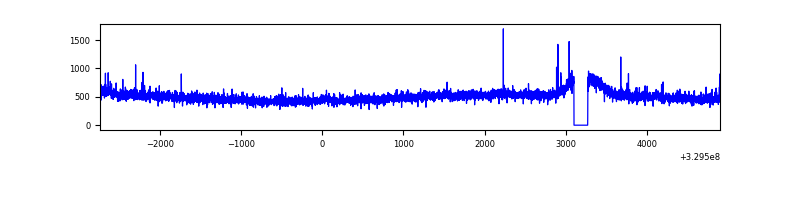 |
| C | 7641 | 7472 | 0 | 0 | 0.00% | 0.00% | 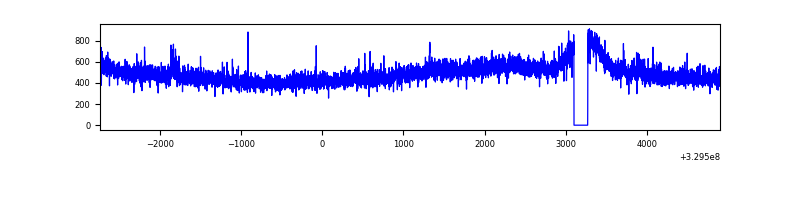 |
| D | 7641 | 7472 | 358 | 358 | 4.69% | 4.79% | 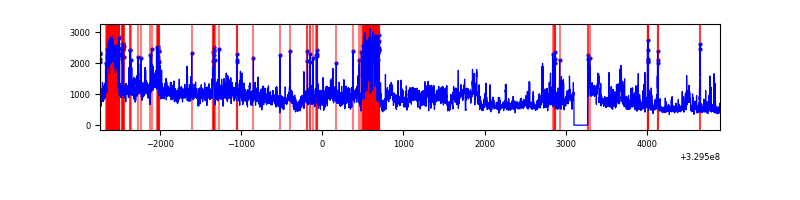 |
Top three noisy pixels from each quadrant. If the there are fewer than three noisy pixels in the level2.evt file, extra rows are filled as -1
| Pixel properties | Quadrant properties | ||||||
|---|---|---|---|---|---|---|---|
| Quadrant | DetID | PixID | Counts | Sigma | Mean | Median | Sigma |
| A | 6 | 16 | 255522 | 1368.47 | 932 | 914 | 186.1 |
| A | 13 | 254 | 11742 | 58.2 | 932 | 914 | 186.1 |
| A | 3 | 137 | 8789 | 42.33 | 932 | 914 | 186.1 |
| B | 3 | 112 | 66590 | 374.23 | 917 | 895 | 175.5 |
| B | 0 | 229 | 47808 | 267.24 | 917 | 895 | 175.5 |
| B | 12 | 111 | 21596 | 117.92 | 917 | 895 | 175.5 |
| C | 14 | 238 | 141998 | 682.91 | 881 | 885 | 206.6 |
| C | 7 | 247 | 34964 | 164.92 | 881 | 885 | 206.6 |
| C | 3 | 233 | 6367 | 26.53 | 881 | 885 | 206.6 |
| D | 1 | 52 | 2185789 | 10278.48 | 879 | 855 | 212.6 |
| D | 7 | 238 | 778591 | 3658.67 | 879 | 855 | 212.6 |
| D | 8 | 195 | 696189 | 3271.03 | 879 | 855 | 212.6 |
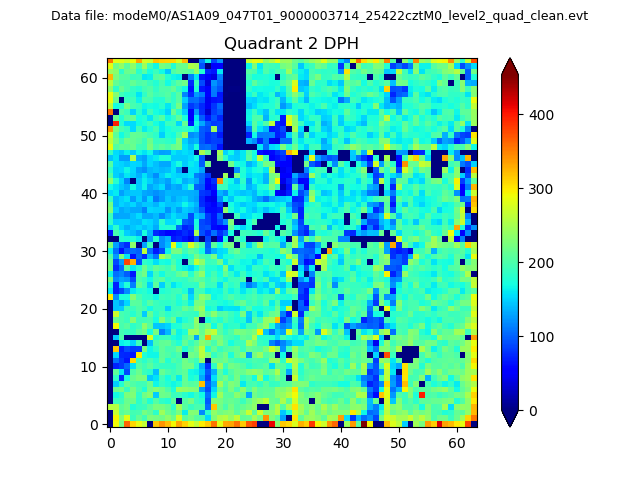
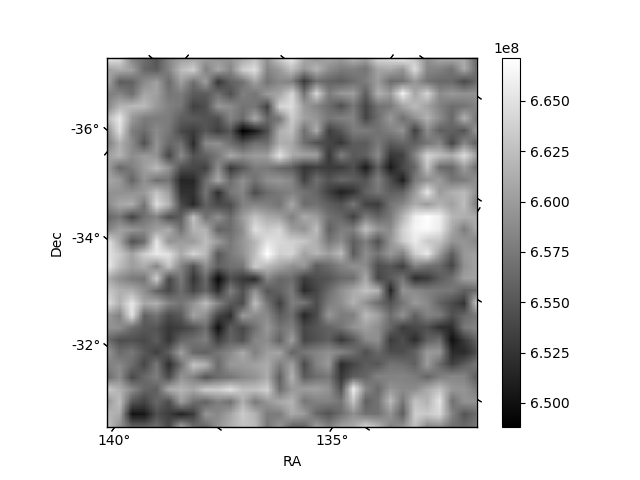
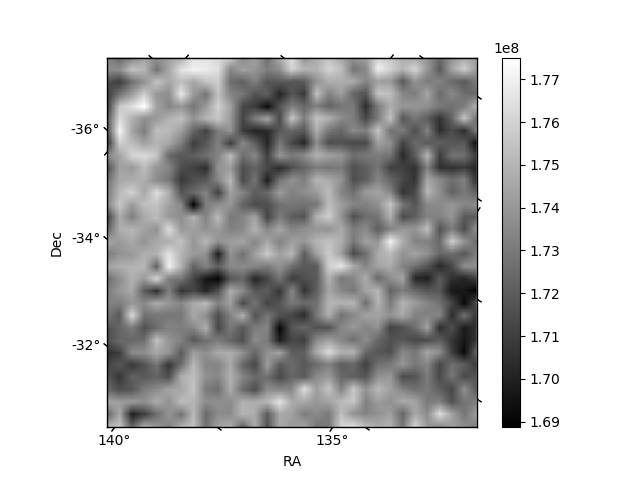
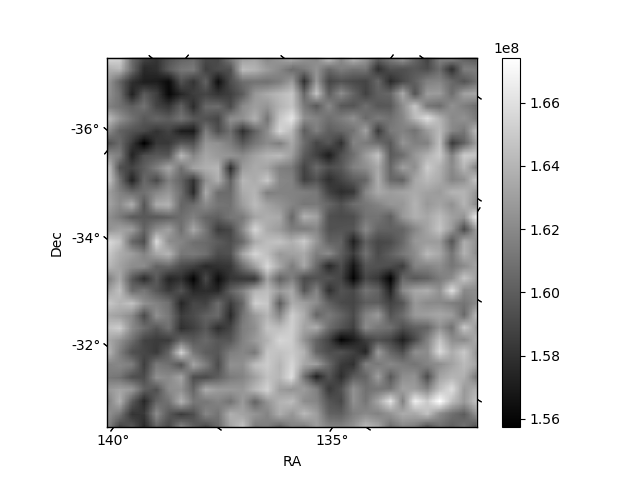
Histogram calculated using DETX and DETY for each event in the final _common_clean file
| Quadrant A | 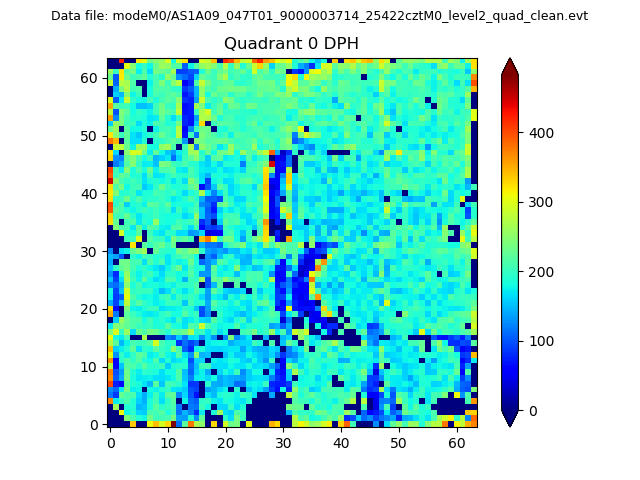 |
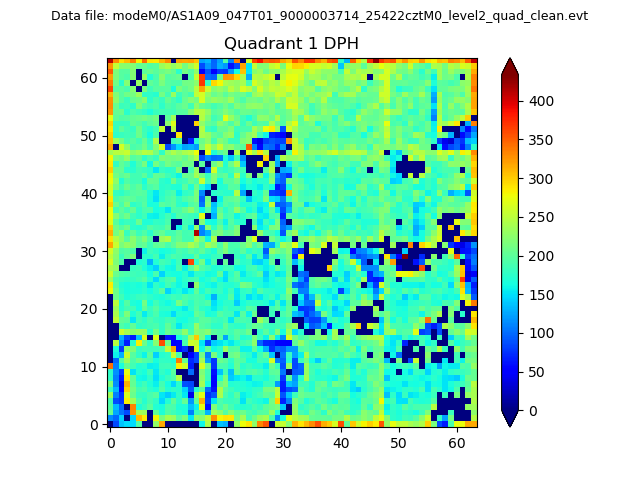 |
Quadrant B |
|---|---|---|---|
| Quadrant D | 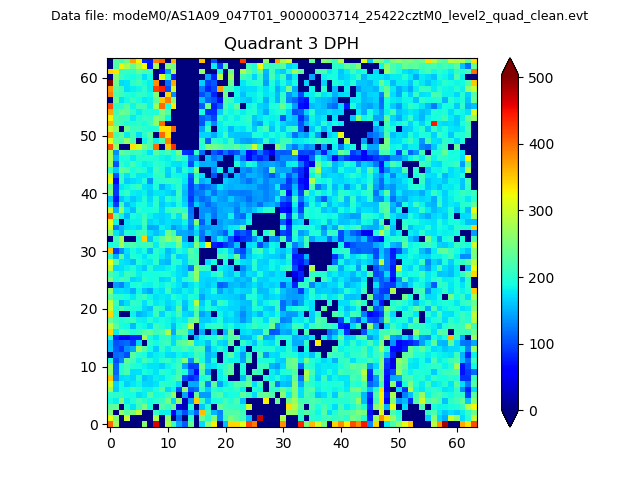 |
 |
Quadrant C |
| Plot type | Count rate plots | Images |
|---|---|---|
| Comparison with Poisson distribution Blue bars denote a histogram of data divided into 1 sec bins. Red curve is a Poisson curve with rate = median count rate of data. |
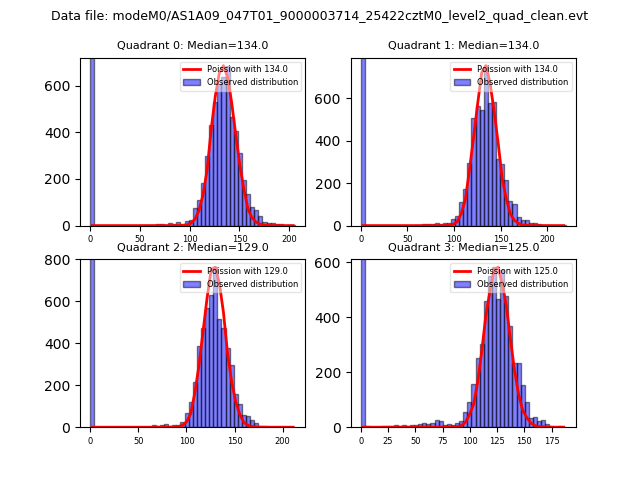 |
 |
| Quadrant-wise count rates Data is divided into 100 sec bins |
 |
|
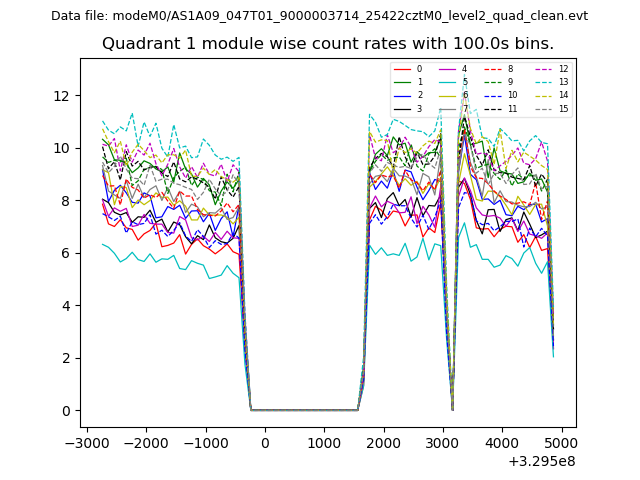
| Module-wise count rates for Quadrant A Data is divided into 100 sec bins |
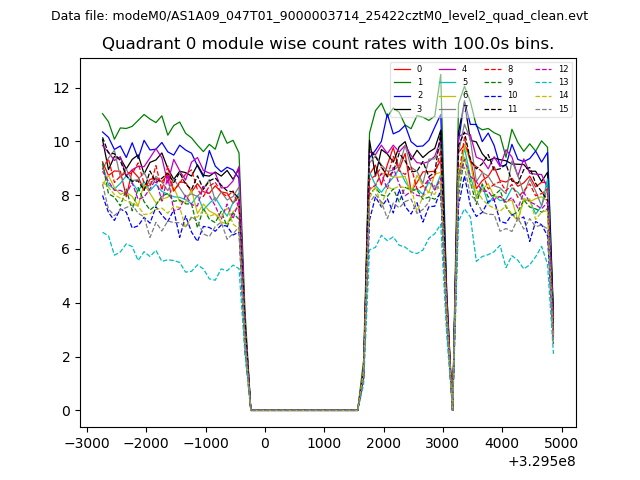 |
 |
| Module-wise count rates for Quadrant B Data is divided into 100 sec bins |
 |
 |
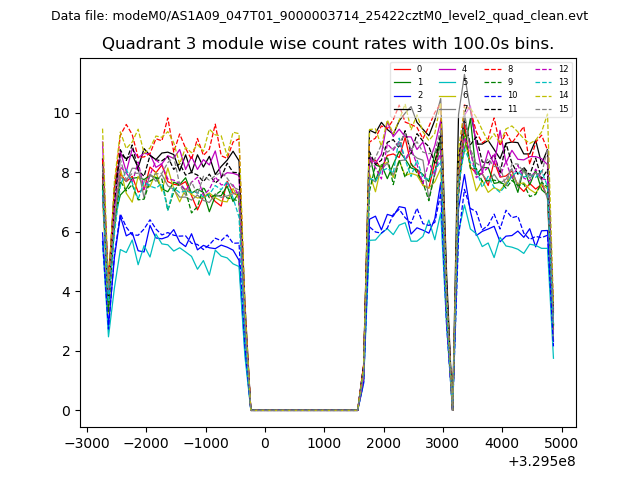
| Module-wise count rates for Quadrant C Data is divided into 100 sec bins |
 |
 |
| Module-wise count rates for Quadrant D Data is divided into 100 sec bins |
 |
 |
| Parameter | Plot |
|---|---|
| CZT HV Monitor | 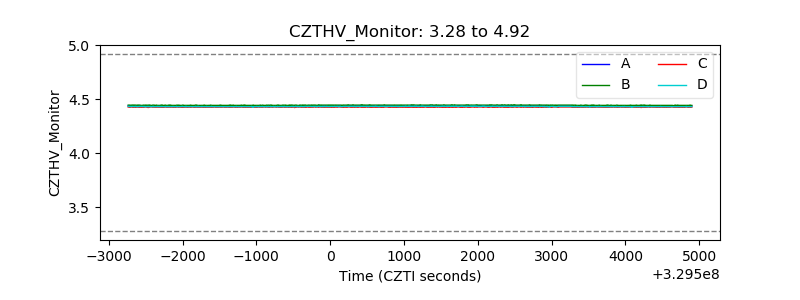 |
| D_VDD | 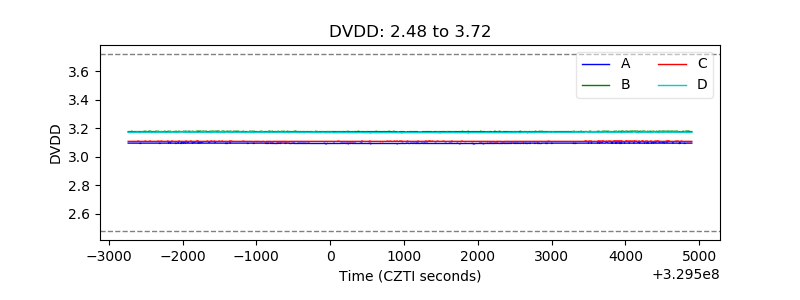 |
| Temperature 1 | 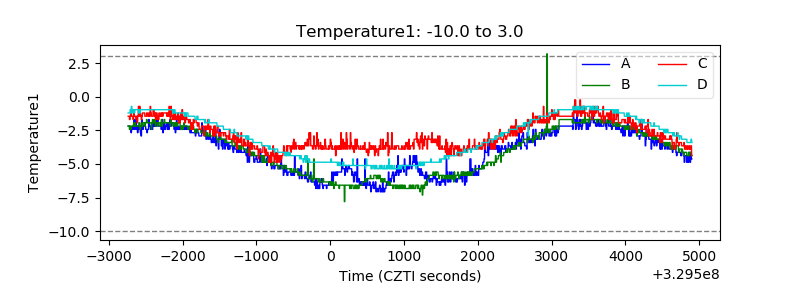 |
| Veto HV Monitor | 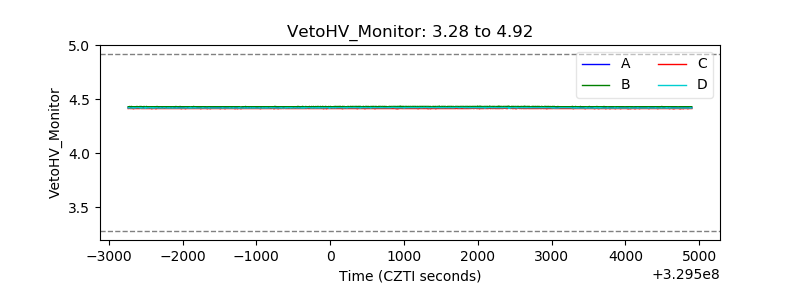 |
| Veto LLD | 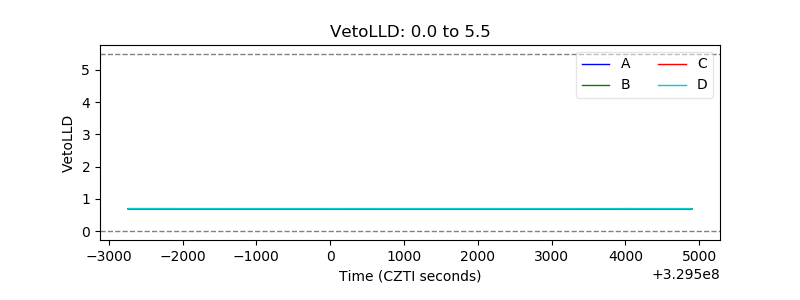 |
| Alpha Counter | 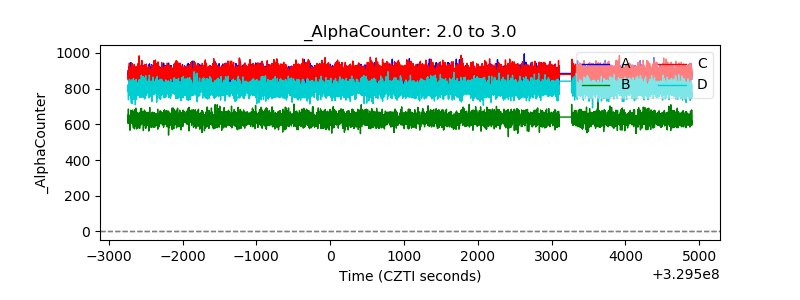 |
| _CPM_Rate |  |
| CZT Counter | 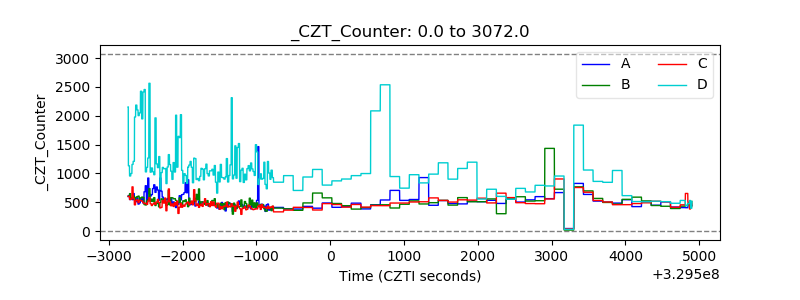 |
| +2.5 Volts monitor |  |
| +5 Volts monitor |  |
| _ROLL_ROT | 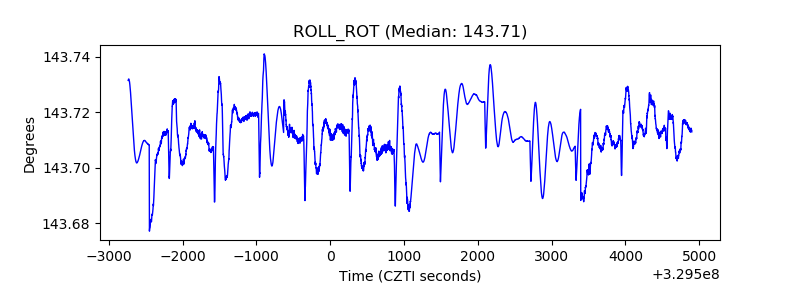 |
| _Roll_DEC | 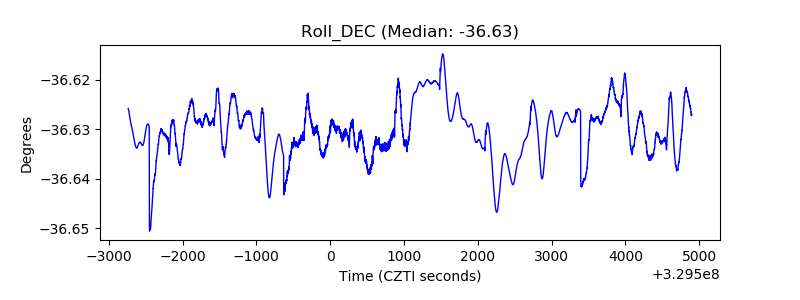 |
| _Roll_RA | 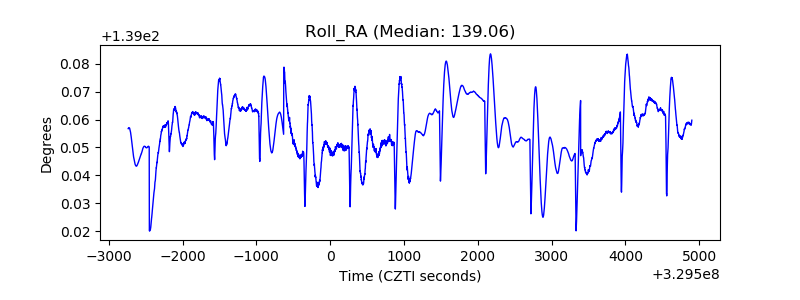 |
| Veto Counter | 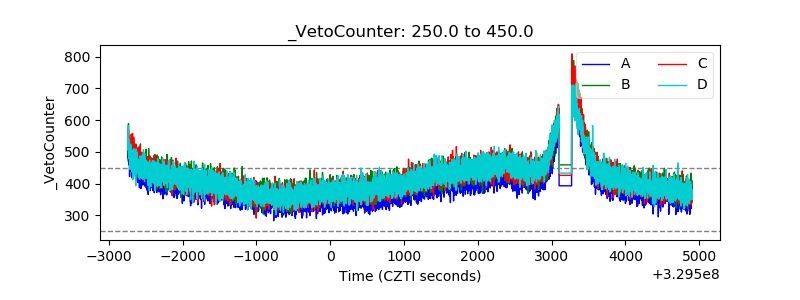 |