| Param | Original file | Final file |
|---|---|---|
| Filename | modeM0/AS1A09_047T01_9000003714_25426cztM0_level2.evt | modeM0/AS1A09_047T01_9000003714_25426cztM0_level2_quad_clean.evt |
| Size (bytes) | 1,467,521,280 | 230,811,840 |
| Size | 1.4 GB | 220.1 MB |
| Events in quadrant A | 10,514,074 | 1,469,785 |
| Events in quadrant B | 8,963,477 | 1,481,591 |
| Events in quadrant C | 9,268,772 | 1,416,192 |
| Events in quadrant D | 14,451,458 | 1,349,453 |
| Mode M9 | |||
|---|---|---|---|
| Quadrant | BADHDUFLAG | Total packets | Discarded packets |
| A | 0 | 20 | 0 |
| B | 0 | 21 | 0 |
| C | 0 | 21 | 0 |
| D | 0 | 21 | 0 |
| Mode M0 | |||
|---|---|---|---|
| Quadrant | BADHDUFLAG | Total packets | Discarded packets |
| A | 0 | 43150 | 0 |
| B | 0 | 38165 | 0 |
| C | 0 | 39379 | 0 |
| D | 0 | 55897 | 0 |
| Quadrant | Total seconds | Saturated seconds | Saturation percentage |
|---|---|---|---|
| A | 18469 | 141 | 0.763441% |
| B | 18468 | 147 | 0.795971% |
| C | 18468 | 223 | 1.207494% |
| D | 18468 | 904 | 4.894953% |
Noise dominated data is calculated using 1-second bins in cleaned event files. If a bin has >2000 counts, and if more than 50% of those come from <1% of pixels, then it is considered to be noise-dominated and hence unusable.
| Quadrant | # 1 sec bins | Bins with >0 counts | Bins with >2000 counts | High rate bins dominated by noise | Noise dominated (total time) | Noise dominated (detector-on time) | Marked lightcurve |
|---|---|---|---|---|---|---|---|
| A | 20409 | 18469 | 0 | 0 | 0.00% | 0.00% | 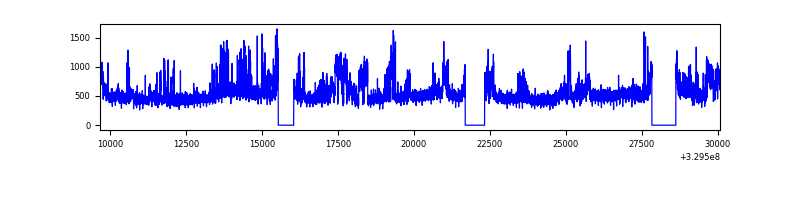 |
| B | 20408 | 18469 | 0 | 0 | 0.00% | 0.00% | 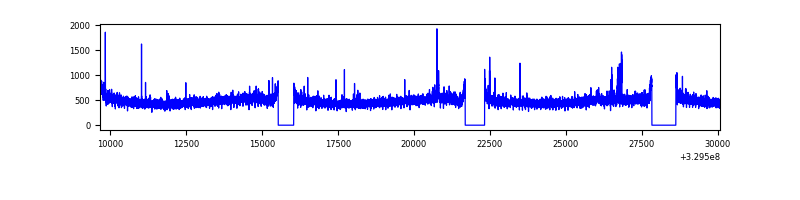 |
| C | 20408 | 18469 | 20 | 20 | 0.10% | 0.11% | 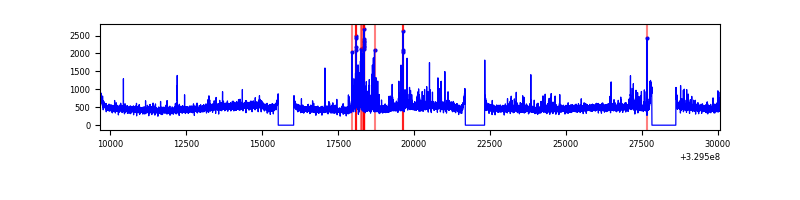 |
| D | 20408 | 18468 | 632 | 632 | 3.10% | 3.42% | 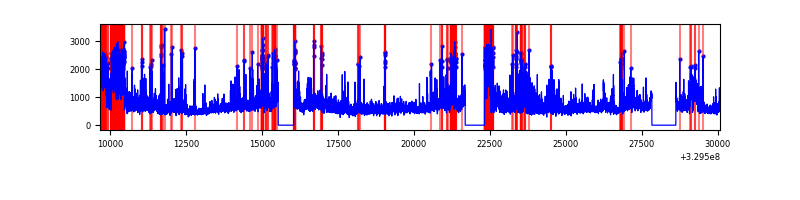 |
Top three noisy pixels from each quadrant. If the there are fewer than three noisy pixels in the level2.evt file, extra rows are filled as -1
| Pixel properties | Quadrant properties | ||||||
|---|---|---|---|---|---|---|---|
| Quadrant | DetID | PixID | Counts | Sigma | Mean | Median | Sigma |
| A | 6 | 16 | 1843433 | 4090.63 | 2242 | 2195 | 450.1 |
| A | 13 | 254 | 28866 | 59.25 | 2242 | 2195 | 450.1 |
| A | 3 | 137 | 21040 | 41.87 | 2242 | 2195 | 450.1 |
| B | 0 | 229 | 132016 | 307.78 | 2219 | 2160 | 421.9 |
| B | 0 | 190 | 82933 | 191.44 | 2219 | 2160 | 421.9 |
| B | 12 | 111 | 53080 | 120.69 | 2219 | 2160 | 421.9 |
| C | 7 | 247 | 606383 | 1218.75 | 2123 | 2136 | 495.8 |
| C | 14 | 238 | 339806 | 681.07 | 2123 | 2136 | 495.8 |
| C | 2 | 16 | 29245 | 54.68 | 2123 | 2136 | 495.8 |
| D | 8 | 195 | 2855277 | 5497.96 | 2125 | 2060 | 519.0 |
| D | 1 | 52 | 1753508 | 3374.93 | 2125 | 2060 | 519.0 |
| D | 7 | 238 | 1187423 | 2284.12 | 2125 | 2060 | 519.0 |
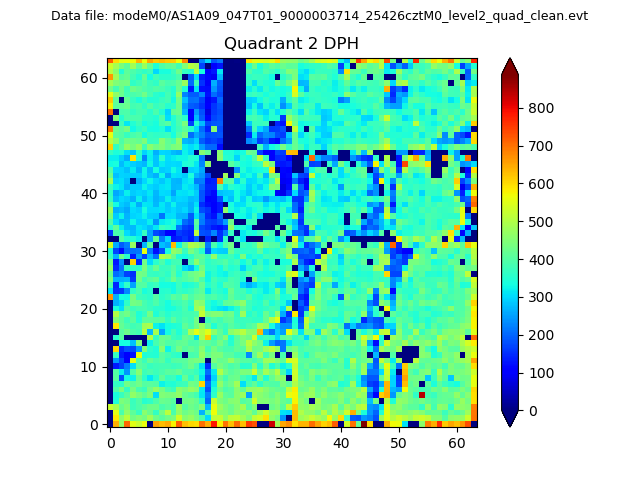
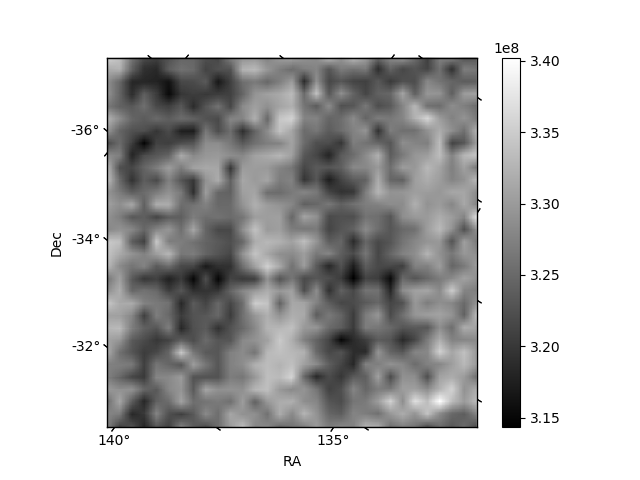
Histogram calculated using DETX and DETY for each event in the final _common_clean file
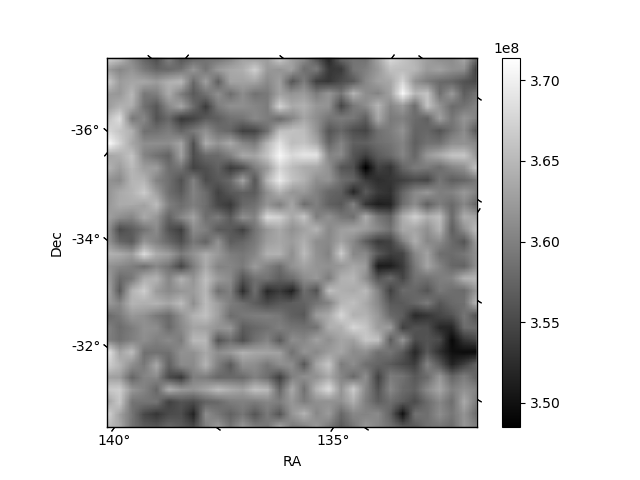
| Quadrant A | 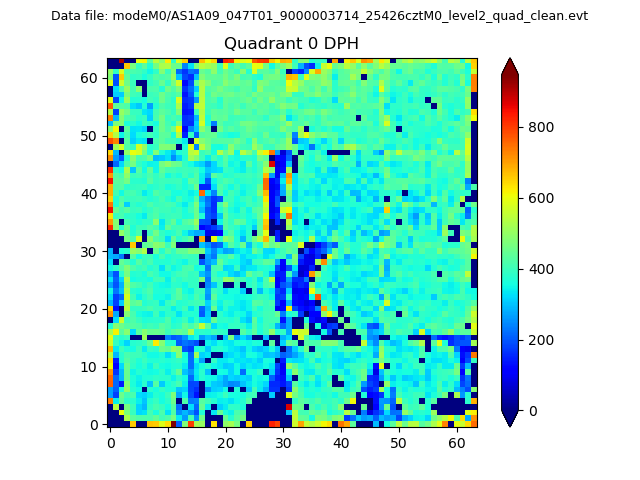 |
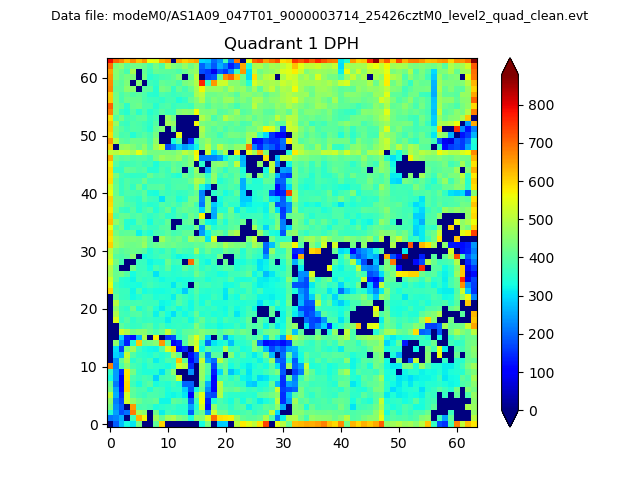 |
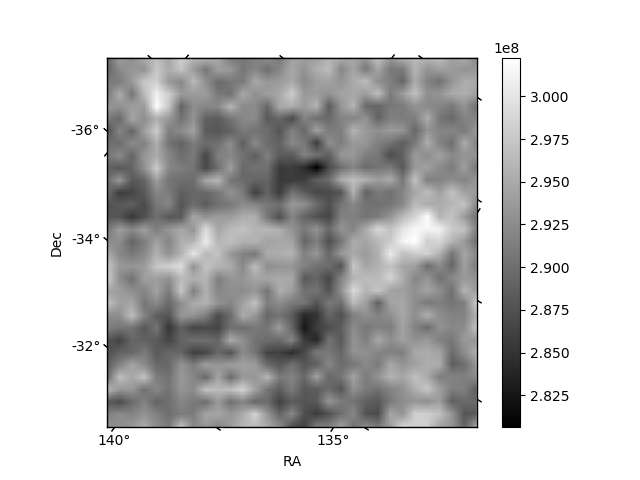
Quadrant B |
|---|---|---|---|
| Quadrant D | 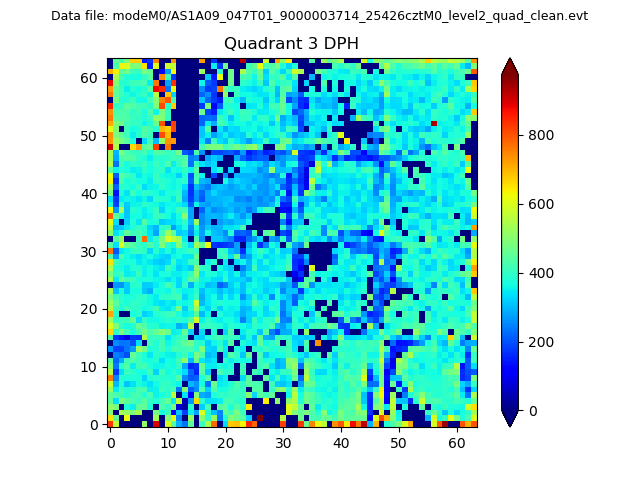 |
 |
Quadrant C |
| Plot type | Count rate plots | Images |
|---|---|---|
| Comparison with Poisson distribution Blue bars denote a histogram of data divided into 1 sec bins. Red curve is a Poisson curve with rate = median count rate of data. |
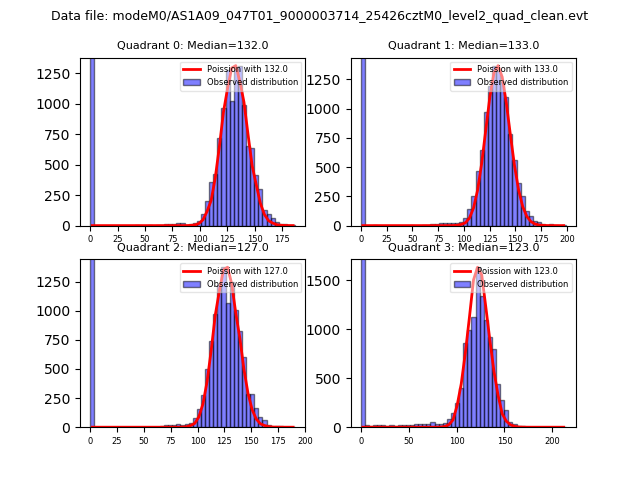 |
 |
| Quadrant-wise count rates Data is divided into 100 sec bins |
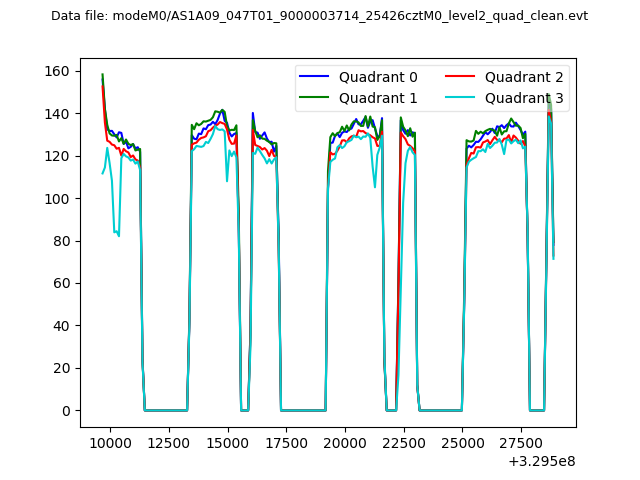 |
|
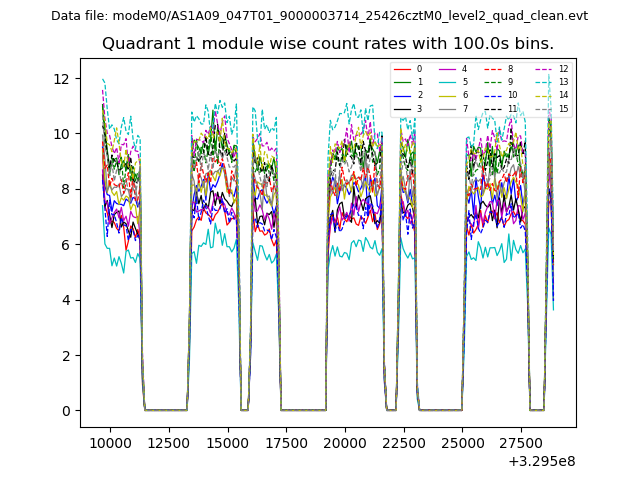
| Module-wise count rates for Quadrant A Data is divided into 100 sec bins |
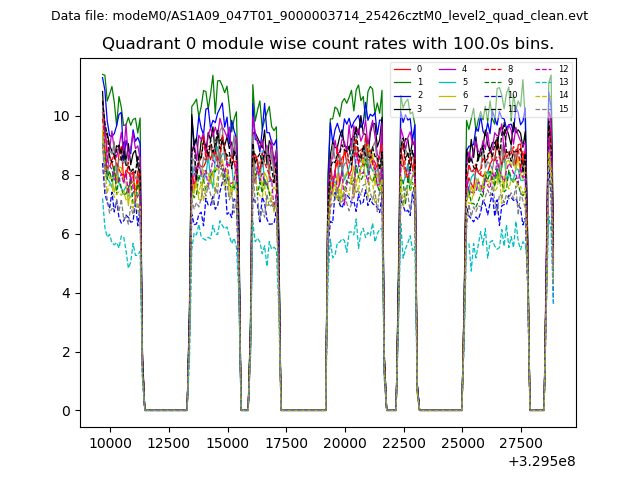 |
 |
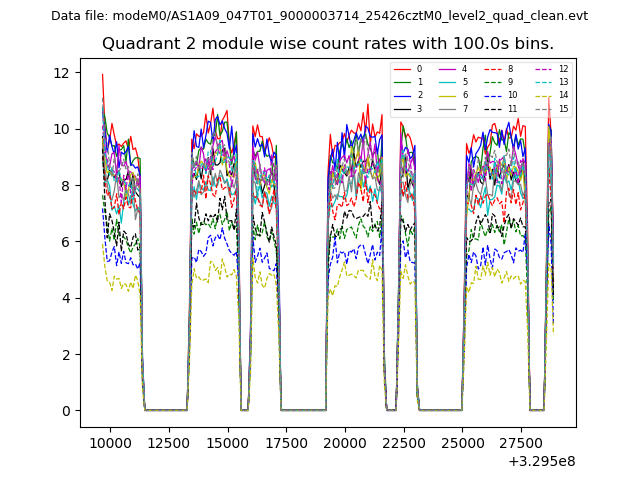
| Module-wise count rates for Quadrant B Data is divided into 100 sec bins |
 |
 |
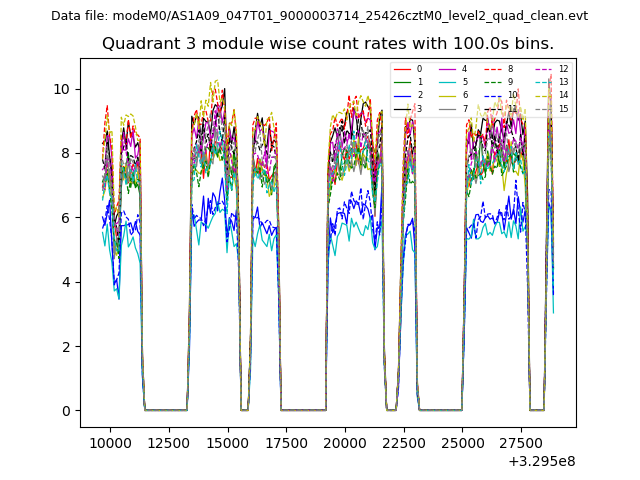
| Module-wise count rates for Quadrant C Data is divided into 100 sec bins |
 |
 |
| Module-wise count rates for Quadrant D Data is divided into 100 sec bins |
 |
 |
| Parameter | Plot |
|---|---|
| CZT HV Monitor | 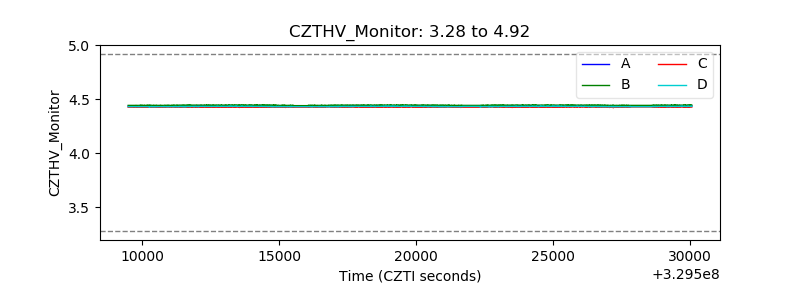 |
| D_VDD | 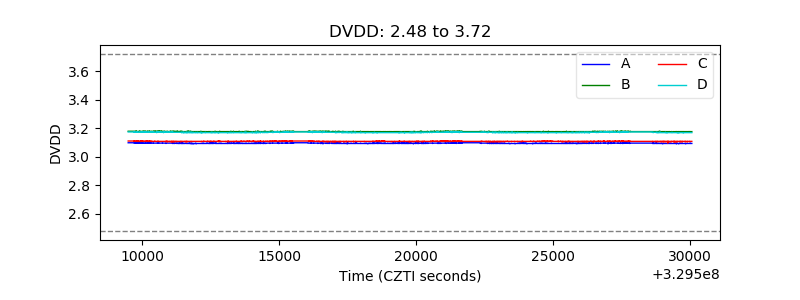 |
| Temperature 1 | 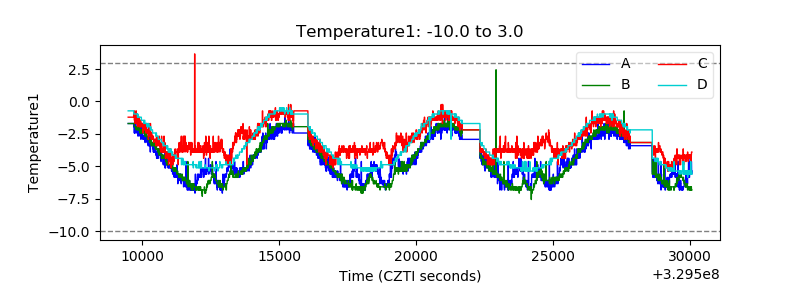 |
| Veto HV Monitor | 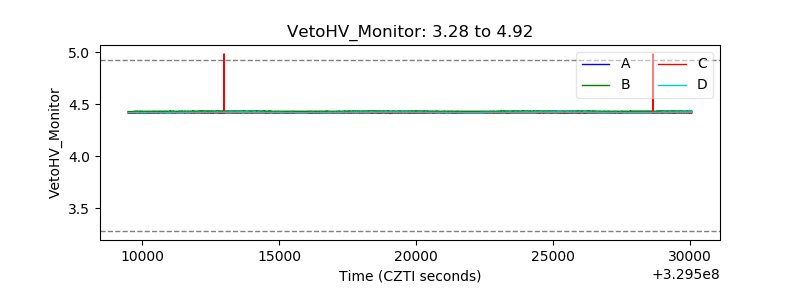 |
| Veto LLD | 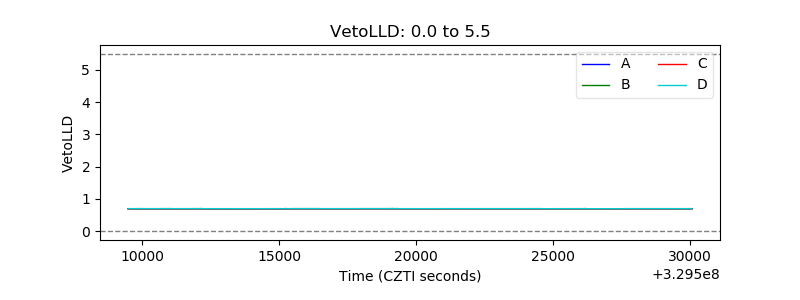 |
| Alpha Counter | 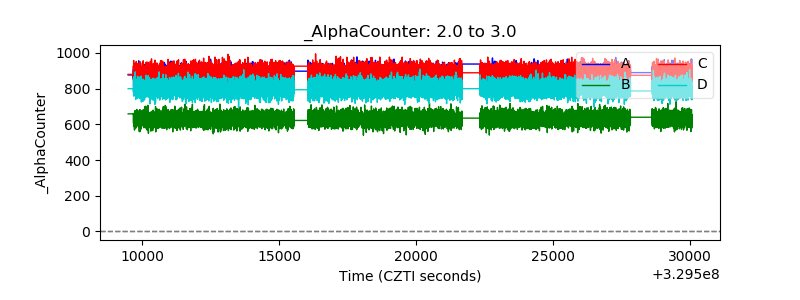 |
| _CPM_Rate | 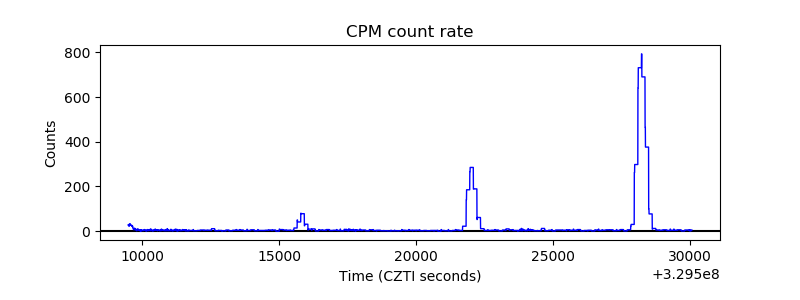 |
| CZT Counter | 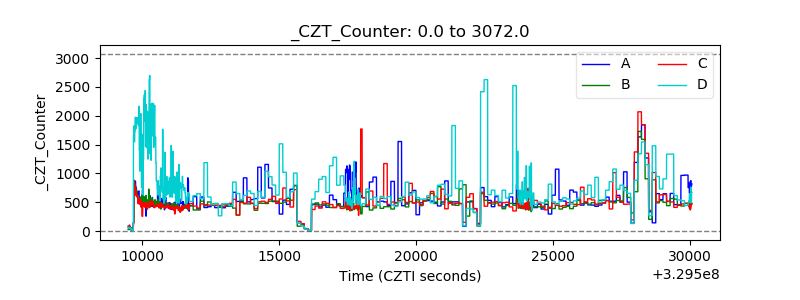 |
| +2.5 Volts monitor |  |
| +5 Volts monitor |  |
| _ROLL_ROT | 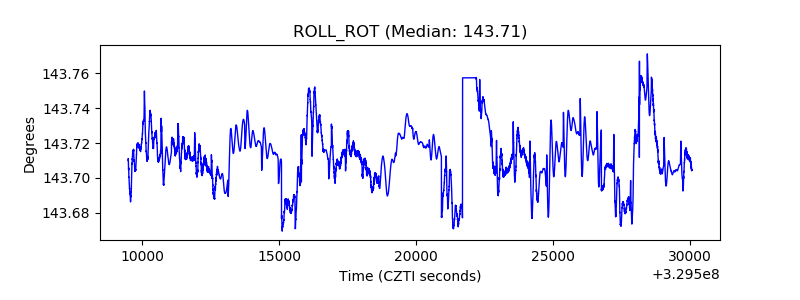 |
| _Roll_DEC | 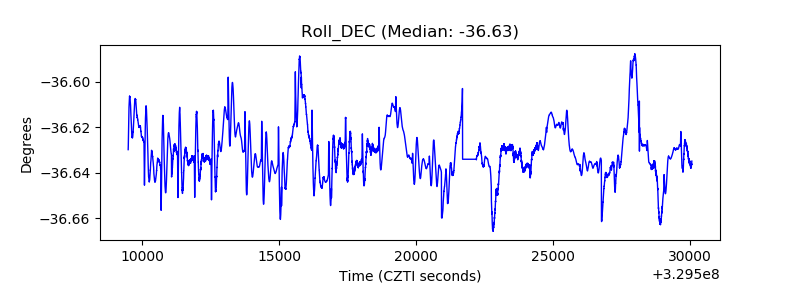 |
| _Roll_RA |  |
| Veto Counter | 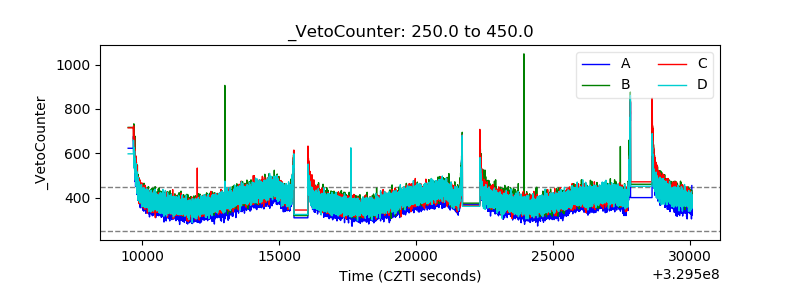 |