| Param | Original file | Final file |
|---|---|---|
| Filename | modeM0/AS1A09_047T01_9000003714_25427cztM0_level2.evt | modeM0/AS1A09_047T01_9000003714_25427cztM0_level2_quad_clean.evt |
| Size (bytes) | 626,731,200 | 72,947,520 |
| Size | 597.7 MB | 69.6 MB |
| Events in quadrant A | 4,417,329 | 455,946 |
| Events in quadrant B | 3,476,307 | 463,460 |
| Events in quadrant C | 3,545,114 | 444,809 |
| Events in quadrant D | 7,072,175 | 360,648 |
| Mode M9 | |||
|---|---|---|---|
| Quadrant | BADHDUFLAG | Total packets | Discarded packets |
| A | 0 | 18 | 0 |
| B | 0 | 18 | 0 |
| C | 0 | 18 | 0 |
| D | 0 | 18 | 0 |
| Mode M0 | |||
|---|---|---|---|
| Quadrant | BADHDUFLAG | Total packets | Discarded packets |
| A | 0 | 17803 | 0 |
| B | 0 | 14519 | 0 |
| C | 0 | 14750 | 0 |
| D | 0 | 25712 | 0 |
| Quadrant | Total seconds | Saturated seconds | Saturation percentage |
|---|---|---|---|
| A | 6942 | 72 | 1.037165% |
| B | 6943 | 71 | 1.022613% |
| C | 6943 | 94 | 1.353882% |
| D | 6943 | 1103 | 15.886504% |
Noise dominated data is calculated using 1-second bins in cleaned event files. If a bin has >2000 counts, and if more than 50% of those come from <1% of pixels, then it is considered to be noise-dominated and hence unusable.
| Quadrant | # 1 sec bins | Bins with >0 counts | Bins with >2000 counts | High rate bins dominated by noise | Noise dominated (total time) | Noise dominated (detector-on time) | Marked lightcurve |
|---|---|---|---|---|---|---|---|
| A | 8727 | 6942 | 0 | 0 | 0.00% | 0.00% | 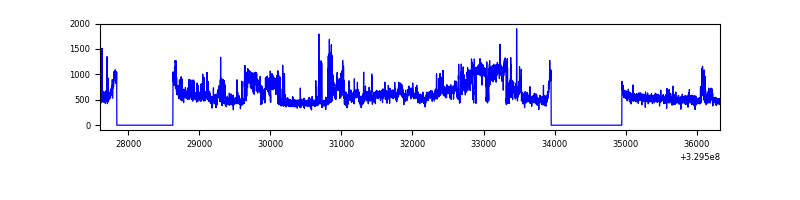 |
| B | 8728 | 6943 | 0 | 0 | 0.00% | 0.00% | 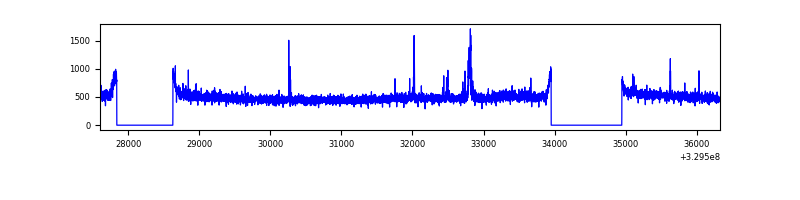 |
| C | 8728 | 6943 | 1 | 1 | 0.01% | 0.01% | 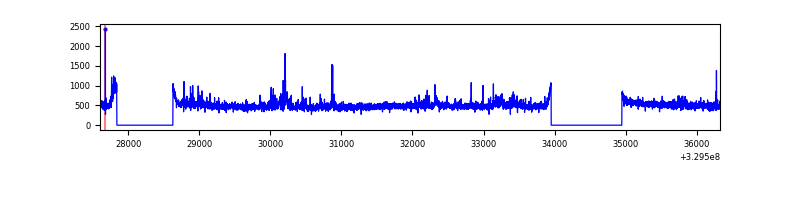 |
| D | 8728 | 6943 | 1052 | 1052 | 12.05% | 15.15% | 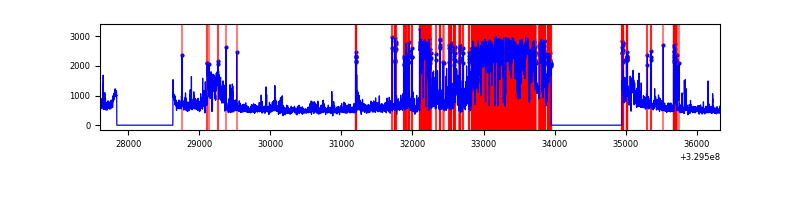 |
Top three noisy pixels from each quadrant. If the there are fewer than three noisy pixels in the level2.evt file, extra rows are filled as -1
| Pixel properties | Quadrant properties | ||||||
|---|---|---|---|---|---|---|---|
| Quadrant | DetID | PixID | Counts | Sigma | Mean | Median | Sigma |
| A | 6 | 16 | 1076805 | 6223.15 | 865 | 846 | 172.9 |
| A | 13 | 254 | 10445 | 55.52 | 865 | 846 | 172.9 |
| A | 3 | 137 | 7922 | 40.93 | 865 | 846 | 172.9 |
| B | 0 | 229 | 35033 | 206.05 | 861 | 839 | 165.9 |
| B | 0 | 190 | 30409 | 178.19 | 861 | 839 | 165.9 |
| B | 12 | 111 | 20372 | 117.71 | 861 | 839 | 165.9 |
| C | 7 | 247 | 173002 | 891.86 | 825 | 829 | 193.0 |
| C | 14 | 238 | 132864 | 683.94 | 825 | 829 | 193.0 |
| C | 2 | 16 | 23135 | 115.55 | 825 | 829 | 193.0 |
| D | 1 | 52 | 2890993 | 15487.4 | 772 | 748 | 186.6 |
| D | 8 | 195 | 861117 | 4610.29 | 772 | 748 | 186.6 |
| D | 7 | 238 | 347376 | 1857.41 | 772 | 748 | 186.6 |
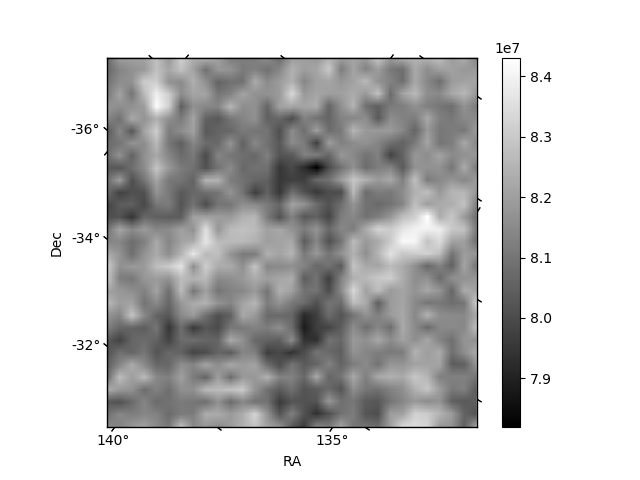
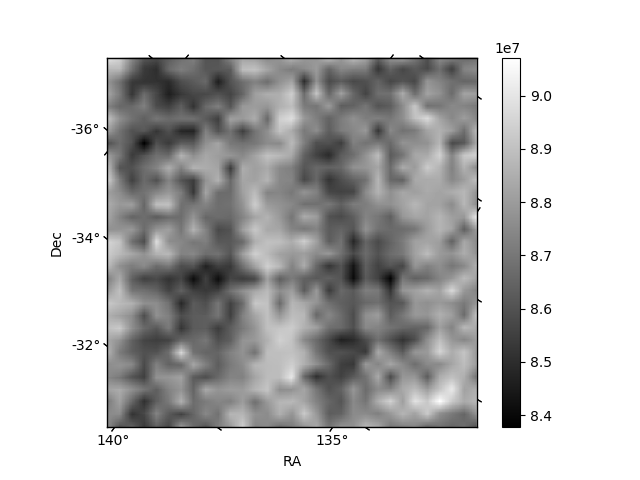
Histogram calculated using DETX and DETY for each event in the final _common_clean file
| Quadrant A |  |
 |
Quadrant B |
|---|---|---|---|
| Quadrant D |  |
 |
Quadrant C |
| Plot type | Count rate plots | Images |
|---|---|---|
| Comparison with Poisson distribution Blue bars denote a histogram of data divided into 1 sec bins. Red curve is a Poisson curve with rate = median count rate of data. |
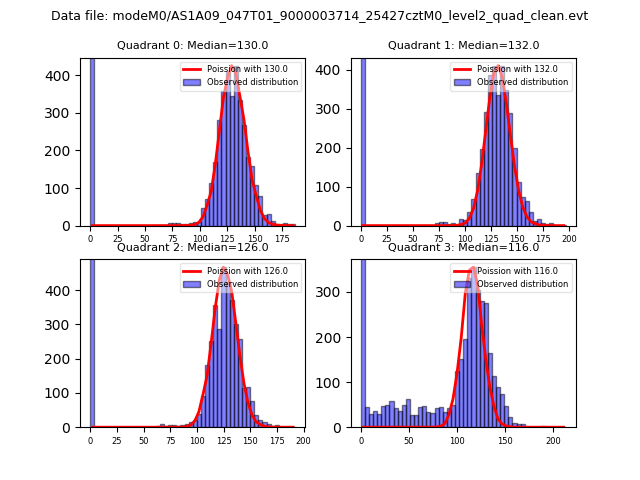 |
 |
| Quadrant-wise count rates Data is divided into 100 sec bins |
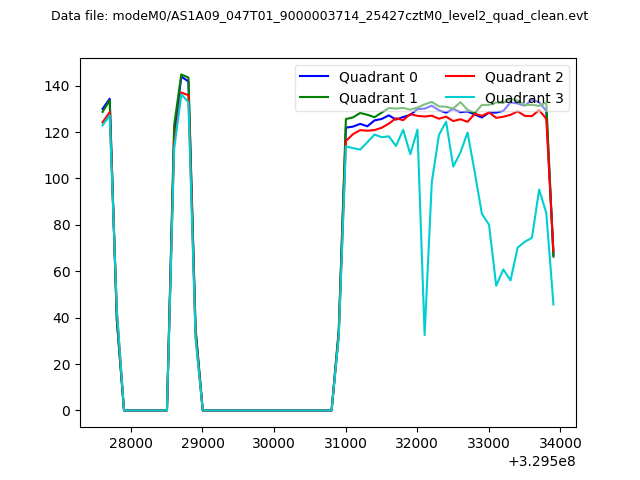 |
|
| Module-wise count rates for Quadrant A Data is divided into 100 sec bins |
 |
 |
| Module-wise count rates for Quadrant B Data is divided into 100 sec bins |
 |
 |
| Module-wise count rates for Quadrant C Data is divided into 100 sec bins |
 |
 |
| Module-wise count rates for Quadrant D Data is divided into 100 sec bins |
 |
 |
| Parameter | Plot |
|---|---|
| CZT HV Monitor |  |
| D_VDD |  |
| Temperature 1 |  |
| Veto HV Monitor |  |
| Veto LLD |  |
| Alpha Counter | 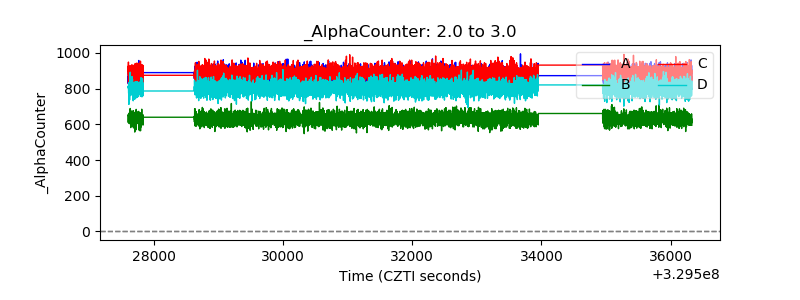 |
| _CPM_Rate | 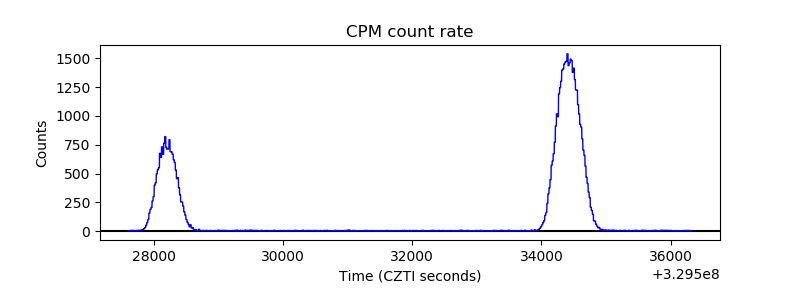 |
| CZT Counter |  |
| +2.5 Volts monitor |  |
| +5 Volts monitor |  |
| _ROLL_ROT |  |
| _Roll_DEC |  |
| _Roll_RA |  |
| Veto Counter |  |