| Param | Original file | Final file |
|---|---|---|
| Filename | modeM0/AS1A09_047T01_9000003714_25429cztM0_level2.evt | modeM0/AS1A09_047T01_9000003714_25429cztM0_level2_quad_clean.evt |
| Size (bytes) | 542,560,320 | 69,416,640 |
| Size | 517.4 MB | 66.2 MB |
| Events in quadrant A | 3,382,451 | 432,932 |
| Events in quadrant B | 3,332,977 | 436,900 |
| Events in quadrant C | 3,331,846 | 419,351 |
| Events in quadrant D | 5,943,745 | 359,158 |
| Mode M9 | |||
|---|---|---|---|
| Quadrant | BADHDUFLAG | Total packets | Discarded packets |
| A | 0 | 17 | 0 |
| B | 0 | 18 | 0 |
| C | 0 | 18 | 0 |
| D | 0 | 18 | 0 |
| Mode M0 | |||
|---|---|---|---|
| Quadrant | BADHDUFLAG | Total packets | Discarded packets |
| A | 0 | 13963 | 0 |
| B | 0 | 13728 | 0 |
| C | 0 | 13854 | 0 |
| D | 0 | 22118 | 0 |
| Quadrant | Total seconds | Saturated seconds | Saturation percentage |
|---|---|---|---|
| A | 6497 | 15 | 0.230876% |
| B | 6496 | 35 | 0.538793% |
| C | 6496 | 76 | 1.169951% |
| D | 6496 | 707 | 10.883621% |
Noise dominated data is calculated using 1-second bins in cleaned event files. If a bin has >2000 counts, and if more than 50% of those come from <1% of pixels, then it is considered to be noise-dominated and hence unusable.
| Quadrant | # 1 sec bins | Bins with >0 counts | Bins with >2000 counts | High rate bins dominated by noise | Noise dominated (total time) | Noise dominated (detector-on time) | Marked lightcurve |
|---|---|---|---|---|---|---|---|
| A | 7622 | 6498 | 0 | 0 | 0.00% | 0.00% | 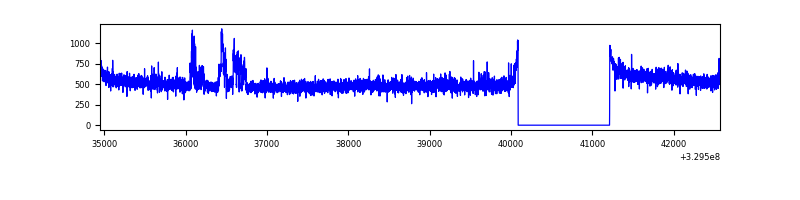 |
| B | 7621 | 6496 | 0 | 0 | 0.00% | 0.00% | 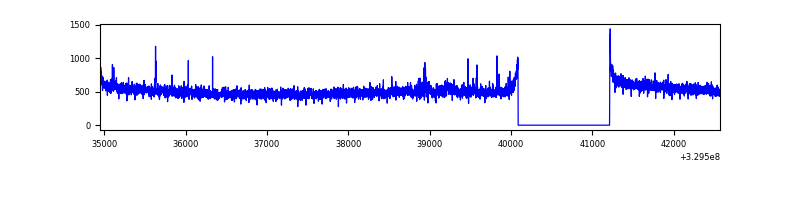 |
| C | 7621 | 6496 | 0 | 0 | 0.00% | 0.00% | 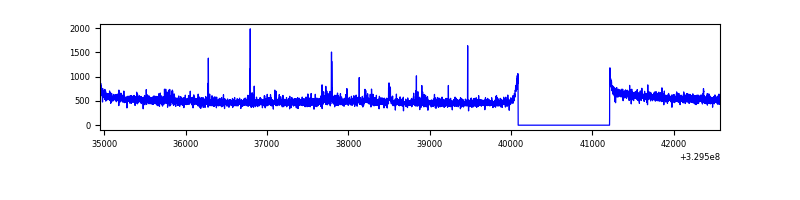 |
| D | 7621 | 6497 | 653 | 653 | 8.57% | 10.05% | 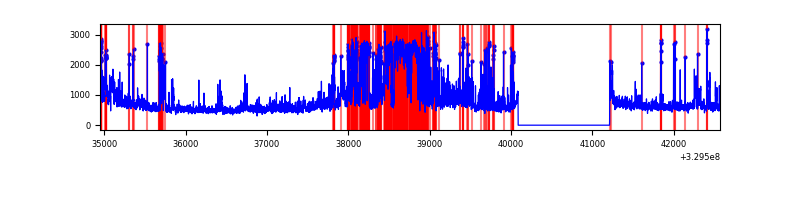 |
Top three noisy pixels from each quadrant. If the there are fewer than three noisy pixels in the level2.evt file, extra rows are filled as -1
| Pixel properties | Quadrant properties | ||||||
|---|---|---|---|---|---|---|---|
| Quadrant | DetID | PixID | Counts | Sigma | Mean | Median | Sigma |
| A | 6 | 16 | 133337 | 791.33 | 841 | 825 | 167.5 |
| A | 13 | 254 | 9194 | 49.98 | 841 | 825 | 167.5 |
| A | 3 | 137 | 7338 | 38.89 | 841 | 825 | 167.5 |
| B | 0 | 229 | 50631 | 319.71 | 833 | 814 | 155.8 |
| B | 12 | 111 | 19176 | 117.84 | 833 | 814 | 155.8 |
| B | 11 | 111 | 17255 | 105.51 | 833 | 814 | 155.8 |
| C | 14 | 238 | 131665 | 708.22 | 804 | 811 | 184.8 |
| C | 7 | 247 | 64571 | 345.09 | 804 | 811 | 184.8 |
| C | 13 | 61 | 5613 | 25.99 | 804 | 811 | 184.8 |
| D | 1 | 52 | 1291954 | 6961.92 | 768 | 745 | 185.5 |
| D | 7 | 238 | 881016 | 4746.23 | 768 | 745 | 185.5 |
| D | 8 | 195 | 730626 | 3935.36 | 768 | 745 | 185.5 |
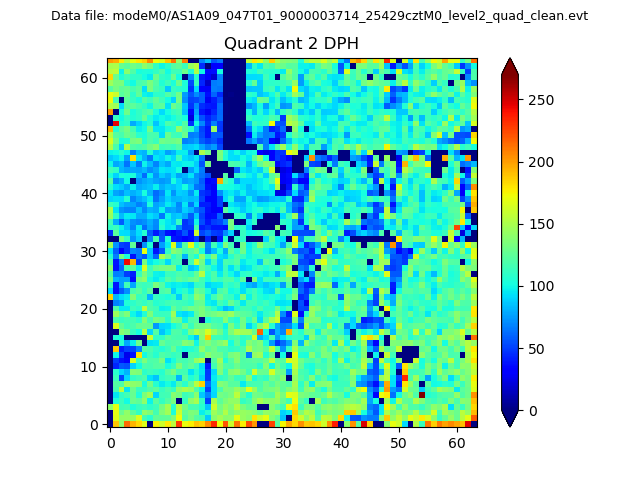
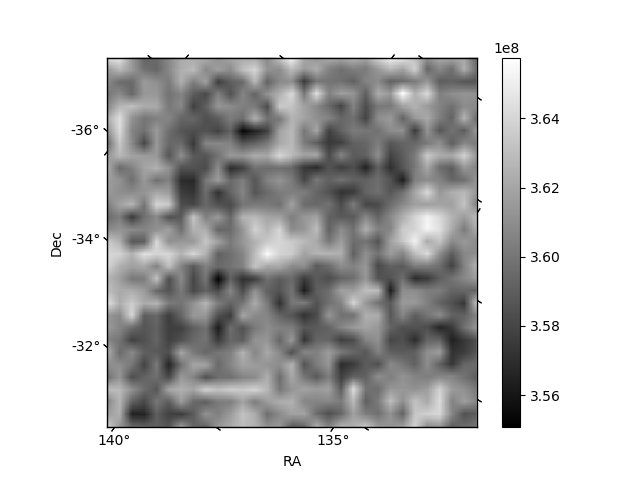
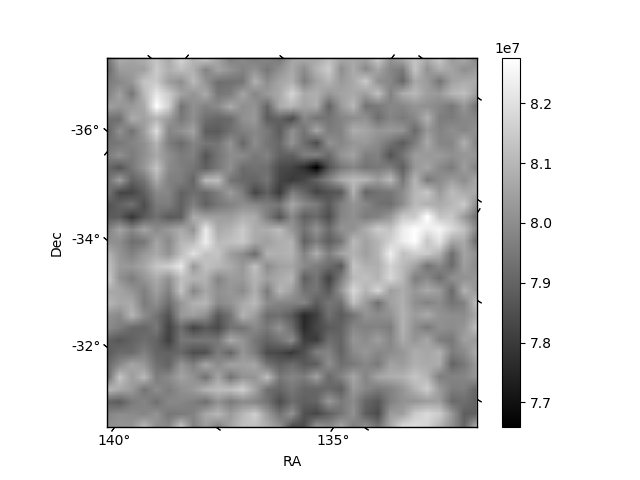
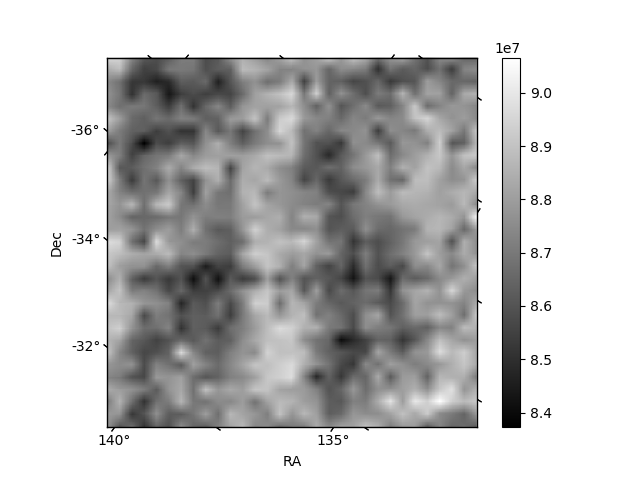
Histogram calculated using DETX and DETY for each event in the final _common_clean file
| Quadrant A | 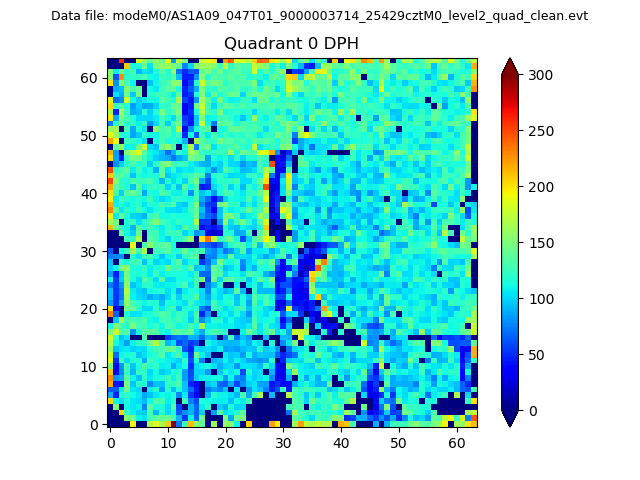 |
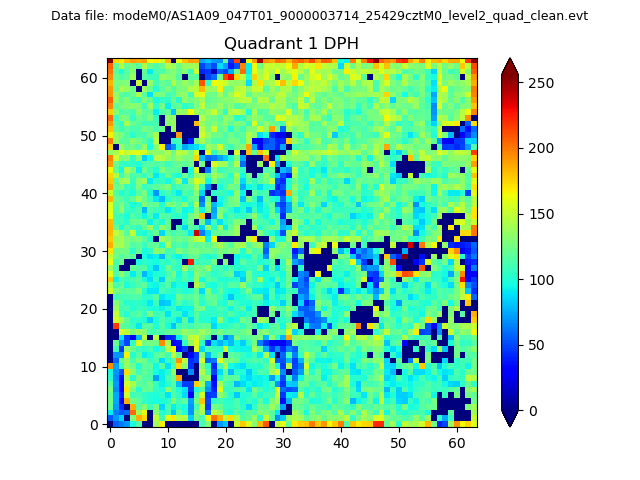 |
Quadrant B |
|---|---|---|---|
| Quadrant D | 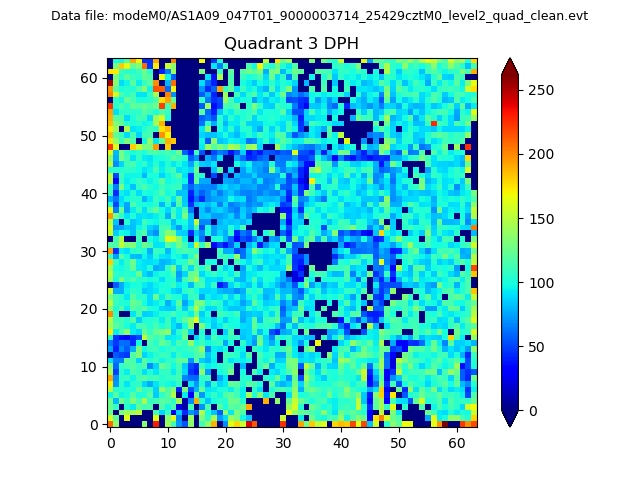 |
 |
Quadrant C |
| Plot type | Count rate plots | Images |
|---|---|---|
| Comparison with Poisson distribution Blue bars denote a histogram of data divided into 1 sec bins. Red curve is a Poisson curve with rate = median count rate of data. |
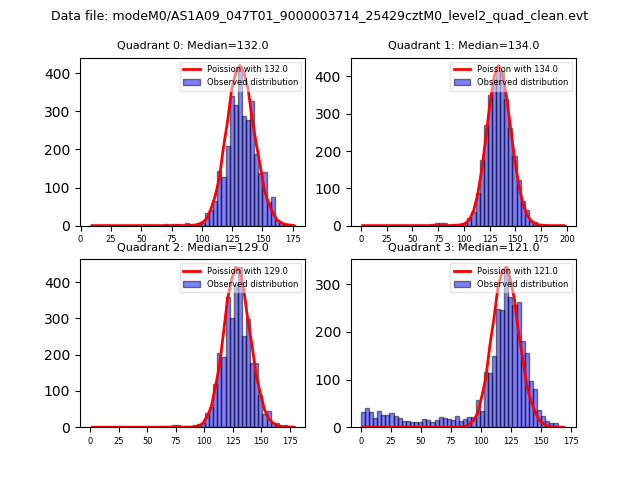 |
 |
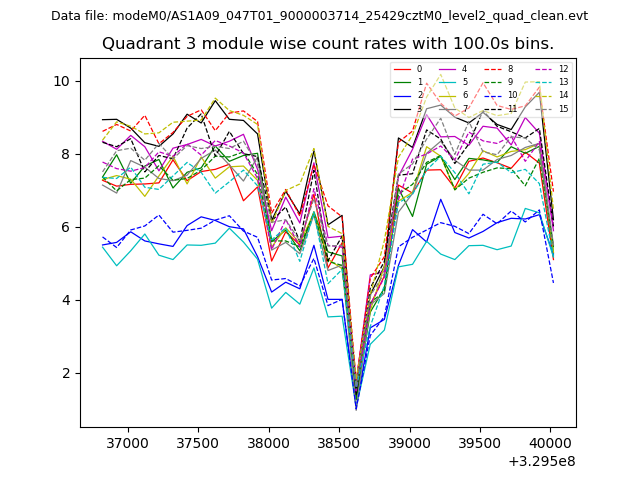
| Quadrant-wise count rates Data is divided into 100 sec bins |
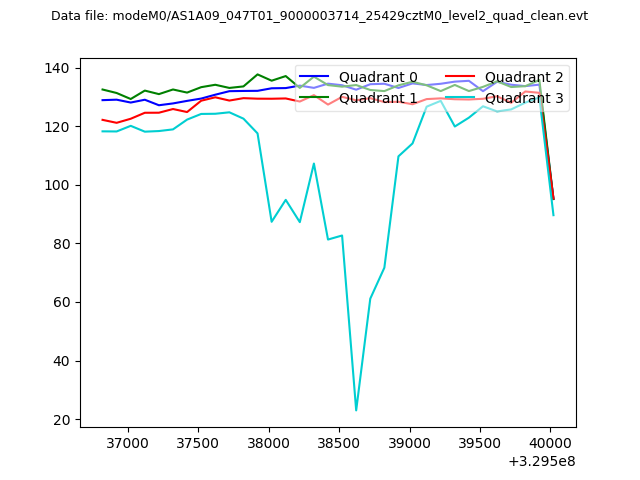 |
|
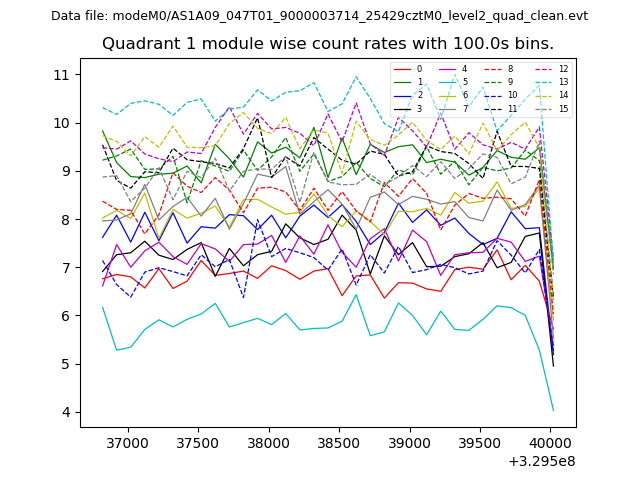
| Module-wise count rates for Quadrant A Data is divided into 100 sec bins |
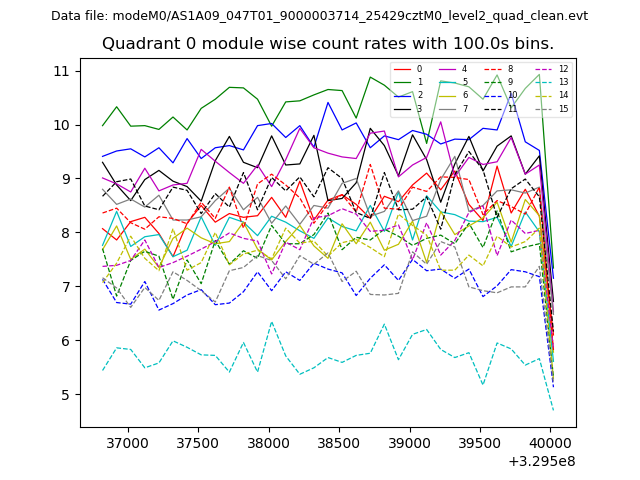 |
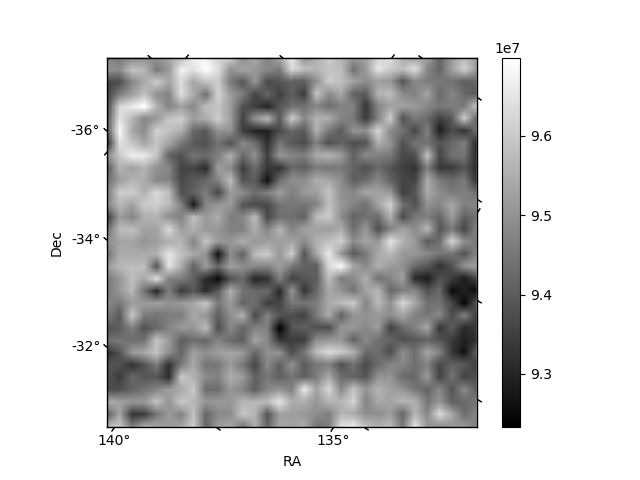 |
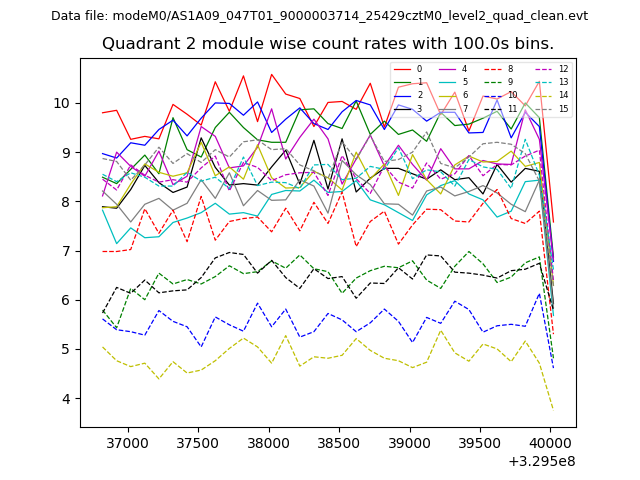
| Module-wise count rates for Quadrant B Data is divided into 100 sec bins |
 |
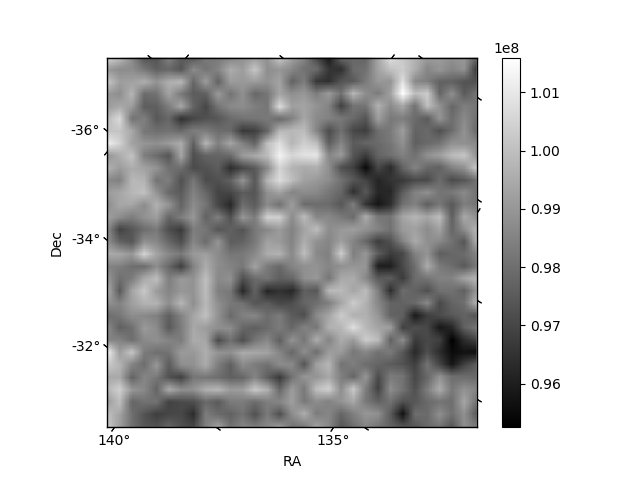 |
| Module-wise count rates for Quadrant C Data is divided into 100 sec bins |
 |
 |
| Module-wise count rates for Quadrant D Data is divided into 100 sec bins |
 |
 |
| Parameter | Plot |
|---|---|
| CZT HV Monitor | 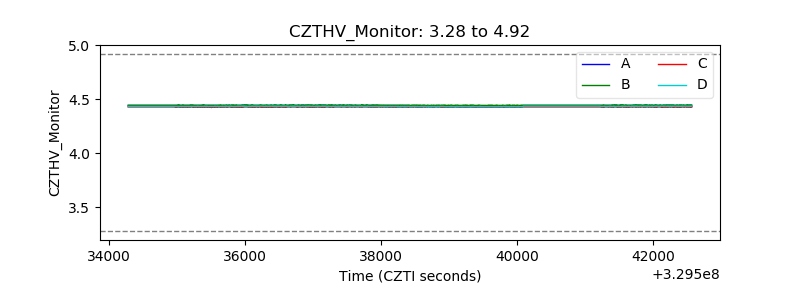 |
| D_VDD | 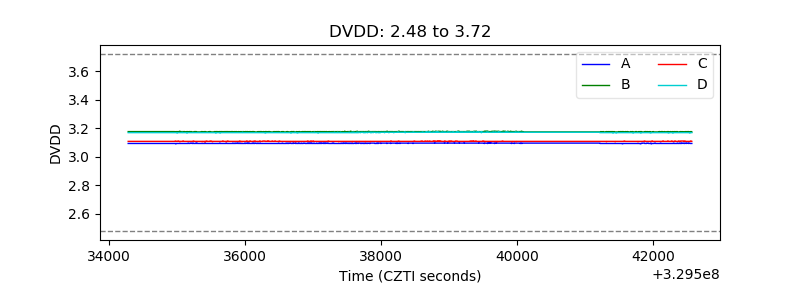 |
| Temperature 1 | 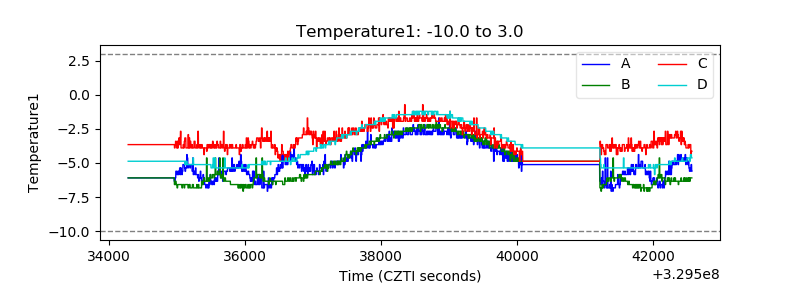 |
| Veto HV Monitor | 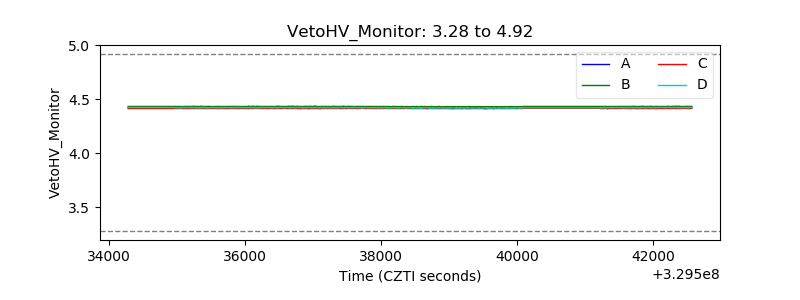 |
| Veto LLD | 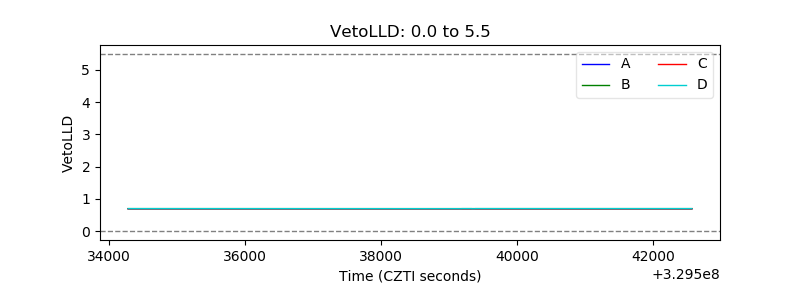 |
| Alpha Counter | 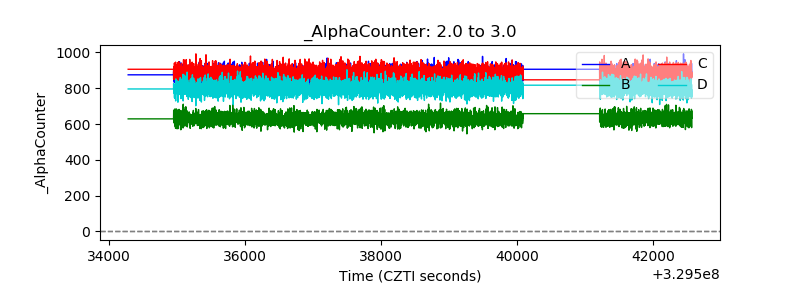 |
| _CPM_Rate | 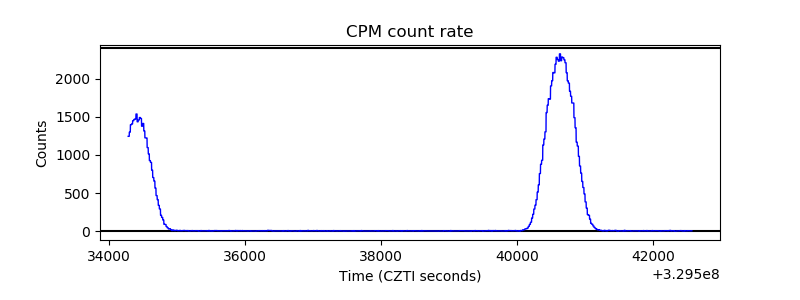 |
| CZT Counter | 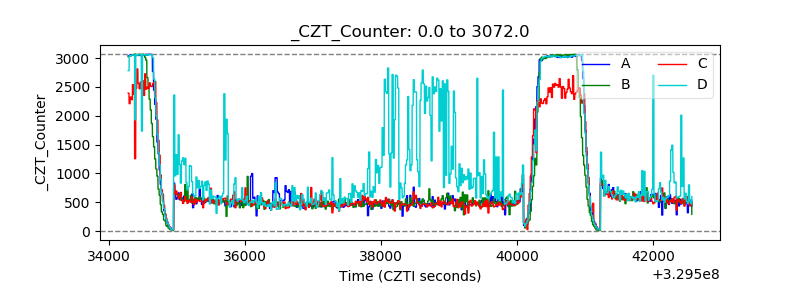 |
| +2.5 Volts monitor | 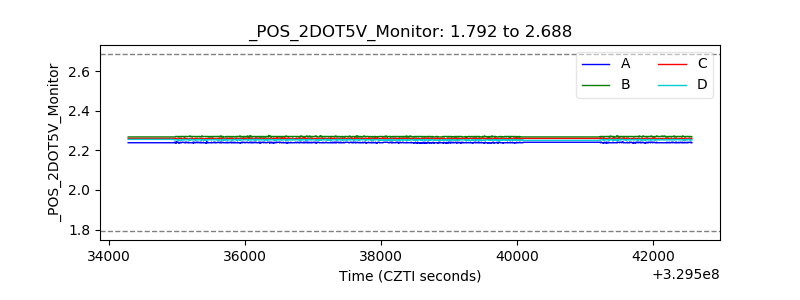 |
| +5 Volts monitor | 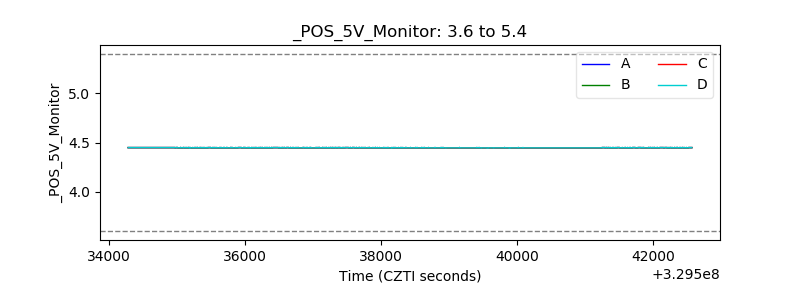 |
| _ROLL_ROT | 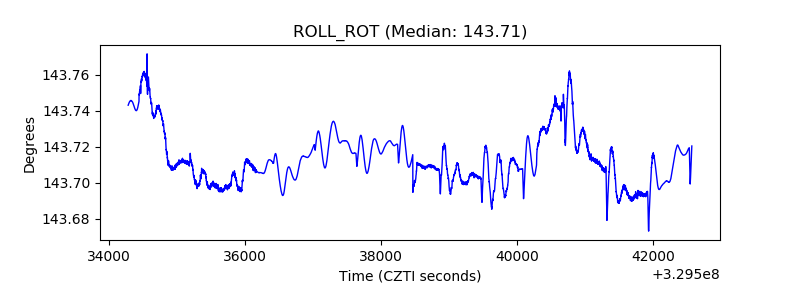 |
| _Roll_DEC |  |
| _Roll_RA | 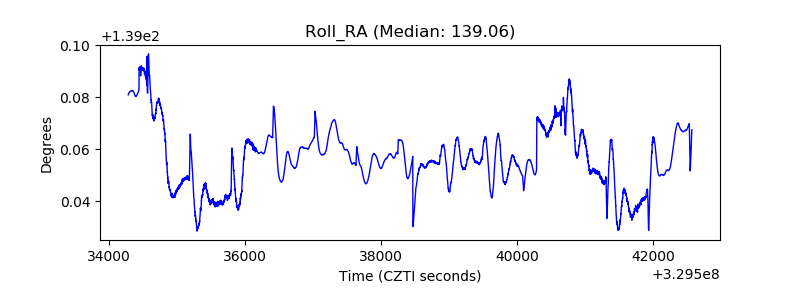 |
| Veto Counter | 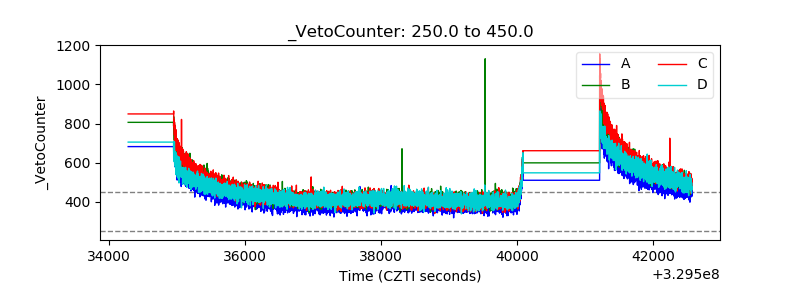 |