| Param | Original file | Final file |
|---|---|---|
| Filename | modeM0/AS1A09_047T01_9000003714_25430cztM0_level2.evt | modeM0/AS1A09_047T01_9000003714_25430cztM0_level2_quad_clean.evt |
| Size (bytes) | 541,319,040 | 89,458,560 |
| Size | 516.2 MB | 85.3 MB |
| Events in quadrant A | 3,584,586 | 578,672 |
| Events in quadrant B | 3,554,506 | 582,731 |
| Events in quadrant C | 3,545,690 | 559,665 |
| Events in quadrant D | 5,265,907 | 531,763 |
| Mode M9 | |||
|---|---|---|---|
| Quadrant | BADHDUFLAG | Total packets | Discarded packets |
| A | 0 | 15 | 0 |
| B | 0 | 16 | 0 |
| C | 0 | 16 | 0 |
| D | 0 | 16 | 0 |
| Mode M0 | |||
|---|---|---|---|
| Quadrant | BADHDUFLAG | Total packets | Discarded packets |
| A | 0 | 14659 | 0 |
| B | 0 | 14634 | 0 |
| C | 0 | 14708 | 0 |
| D | 0 | 20374 | 0 |
| Quadrant | Total seconds | Saturated seconds | Saturation percentage |
|---|---|---|---|
| A | 6543 | 61 | 0.932294% |
| B | 6542 | 84 | 1.284011% |
| C | 6542 | 145 | 2.216448% |
| D | 6542 | 417 | 6.374197% |
Noise dominated data is calculated using 1-second bins in cleaned event files. If a bin has >2000 counts, and if more than 50% of those come from <1% of pixels, then it is considered to be noise-dominated and hence unusable.
| Quadrant | # 1 sec bins | Bins with >0 counts | Bins with >2000 counts | High rate bins dominated by noise | Noise dominated (total time) | Noise dominated (detector-on time) | Marked lightcurve |
|---|---|---|---|---|---|---|---|
| A | 7753 | 6543 | 1 | 1 | 0.01% | 0.02% | 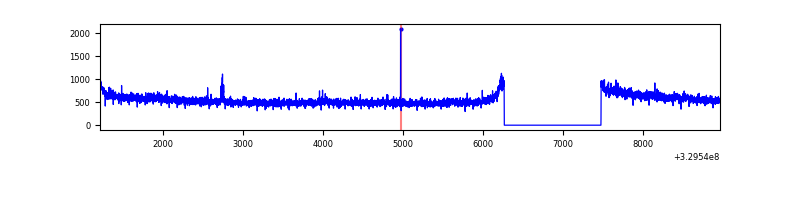 |
| B | 7752 | 6542 | 3 | 3 | 0.04% | 0.05% | 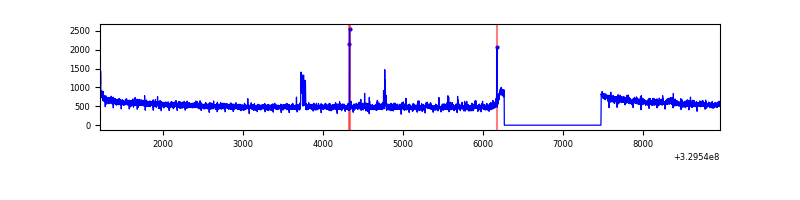 |
| C | 7752 | 6542 | 0 | 0 | 0.00% | 0.00% | 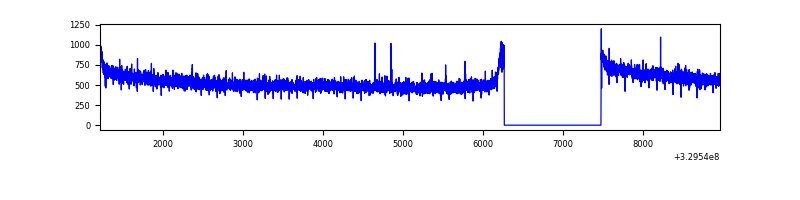 |
| D | 7752 | 6542 | 353 | 353 | 4.55% | 5.40% | 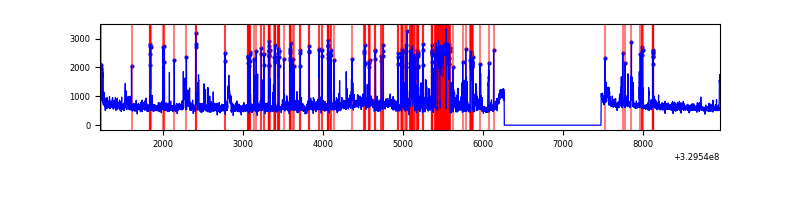 |
Top three noisy pixels from each quadrant. If the there are fewer than three noisy pixels in the level2.evt file, extra rows are filled as -1
| Pixel properties | Quadrant properties | ||||||
|---|---|---|---|---|---|---|---|
| Quadrant | DetID | PixID | Counts | Sigma | Mean | Median | Sigma |
| A | 6 | 16 | 102171 | 572.03 | 902 | 885 | 177.1 |
| A | 13 | 254 | 9594 | 49.19 | 902 | 885 | 177.1 |
| A | 0 | 226 | 7920 | 39.73 | 902 | 885 | 177.1 |
| B | 0 | 230 | 44610 | 266.06 | 889 | 871 | 164.4 |
| B | 12 | 111 | 19742 | 114.79 | 889 | 871 | 164.4 |
| B | 11 | 111 | 17647 | 102.05 | 889 | 871 | 164.4 |
| C | 14 | 238 | 142547 | 719.04 | 865 | 875 | 197.0 |
| C | 7 | 247 | 23872 | 116.72 | 865 | 875 | 197.0 |
| C | 13 | 61 | 6033 | 26.18 | 865 | 875 | 197.0 |
| D | 1 | 52 | 1217856 | 5896.44 | 863 | 840 | 206.4 |
| D | 8 | 195 | 649095 | 3140.79 | 863 | 840 | 206.4 |
| D | 2 | 82 | 81334 | 389.99 | 863 | 840 | 206.4 |
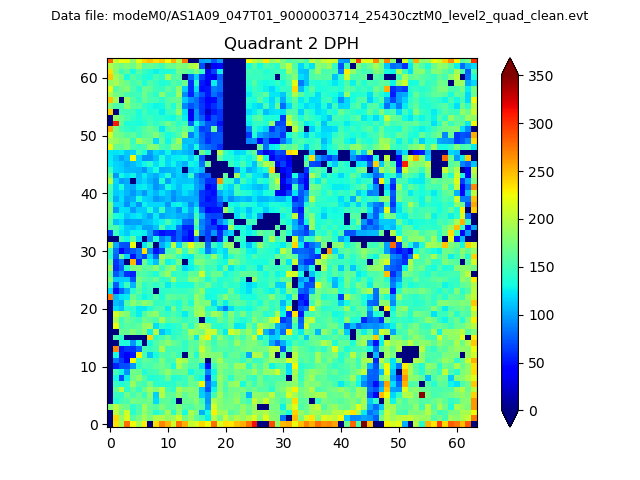
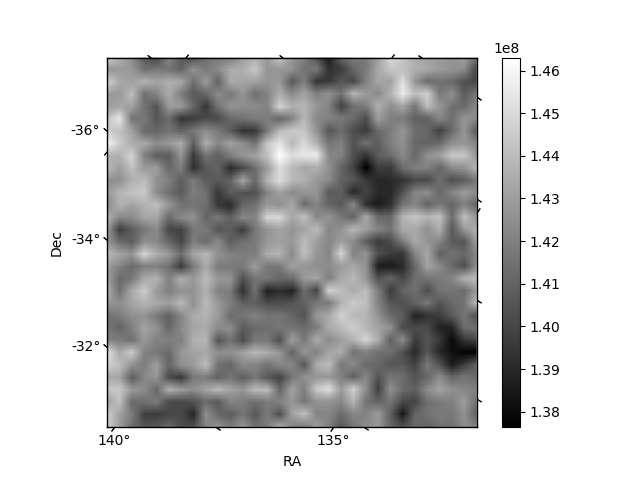
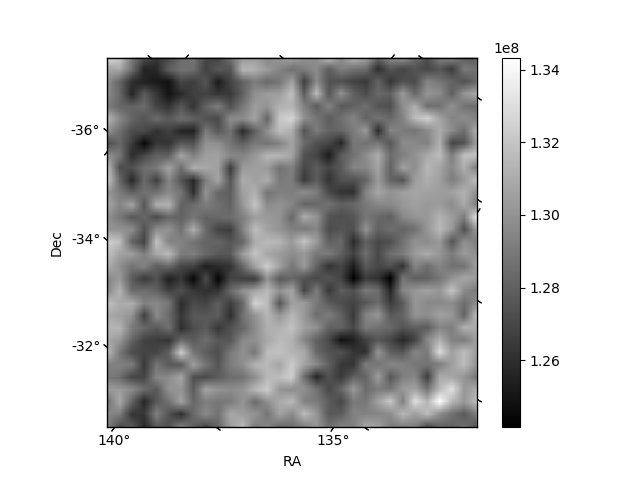
Histogram calculated using DETX and DETY for each event in the final _common_clean file
| Quadrant A | 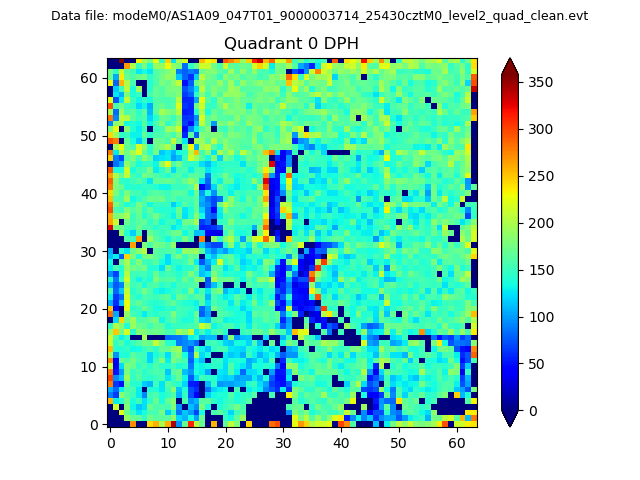 |
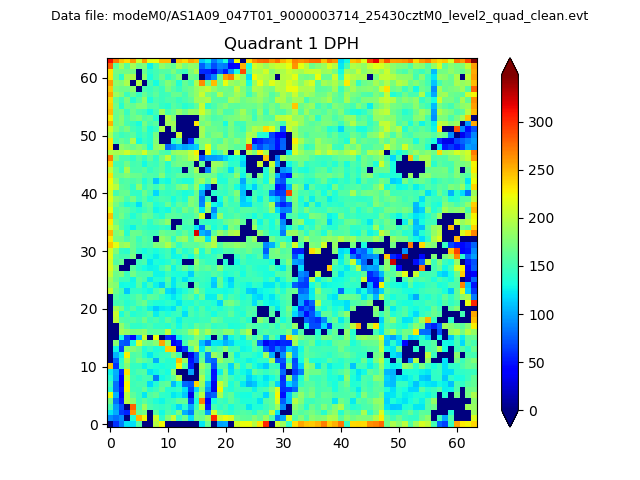 |
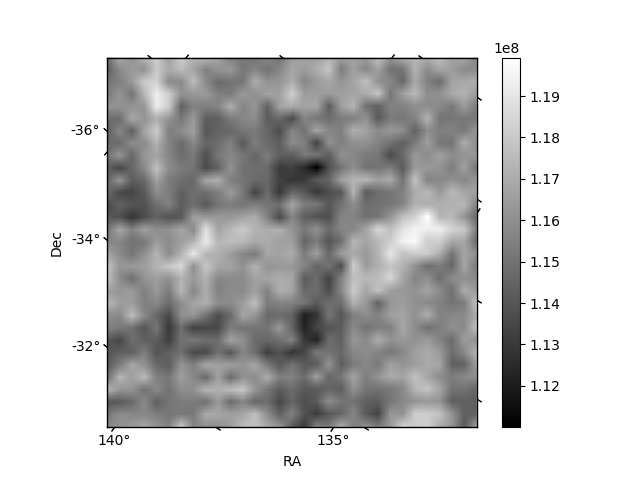
Quadrant B |
|---|---|---|---|
| Quadrant D | 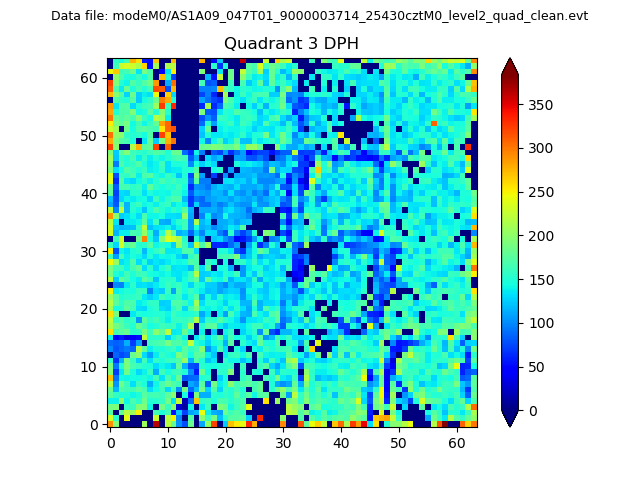 |
 |
Quadrant C |
| Plot type | Count rate plots | Images |
|---|---|---|
| Comparison with Poisson distribution Blue bars denote a histogram of data divided into 1 sec bins. Red curve is a Poisson curve with rate = median count rate of data. |
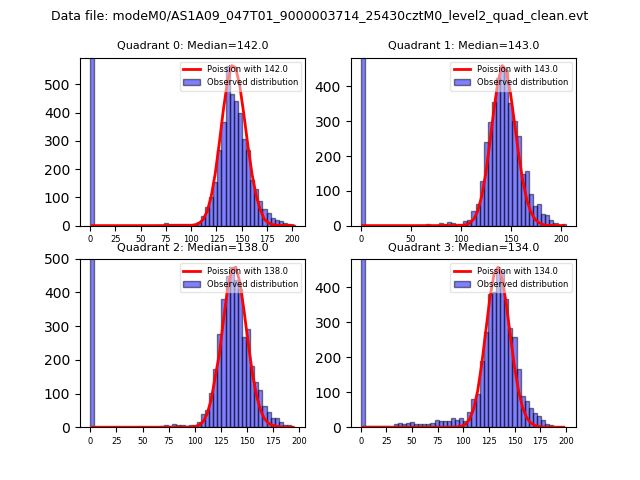 |
 |
| Quadrant-wise count rates Data is divided into 100 sec bins |
 |
|
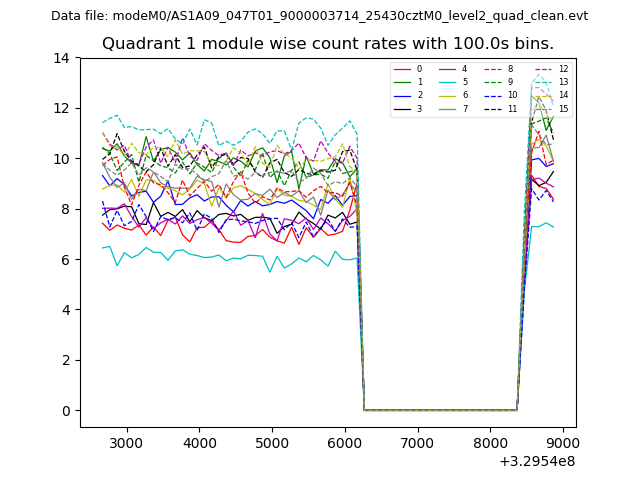
| Module-wise count rates for Quadrant A Data is divided into 100 sec bins |
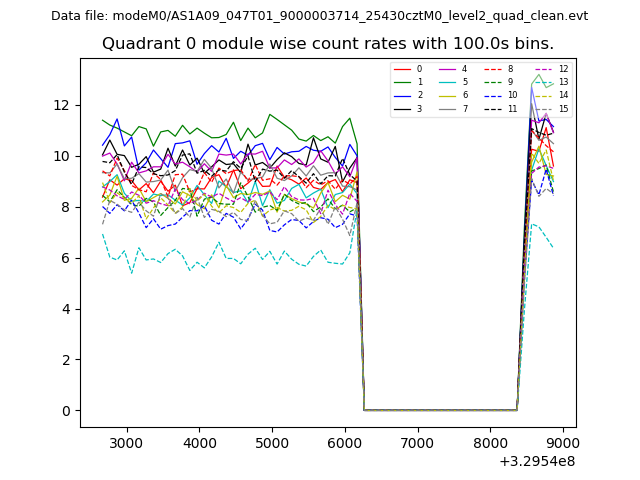 |
 |
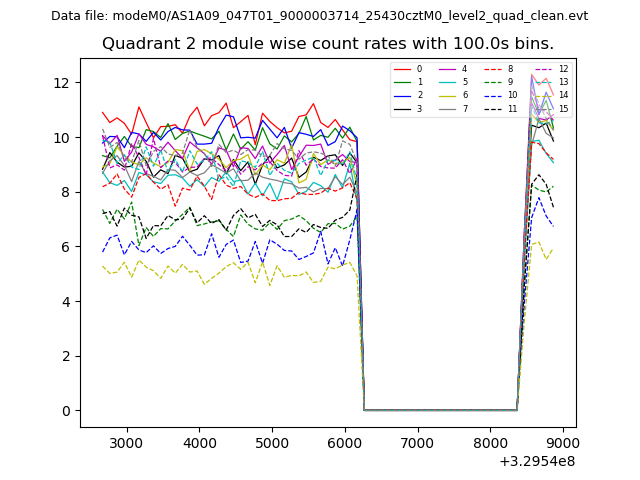
| Module-wise count rates for Quadrant B Data is divided into 100 sec bins |
 |
 |
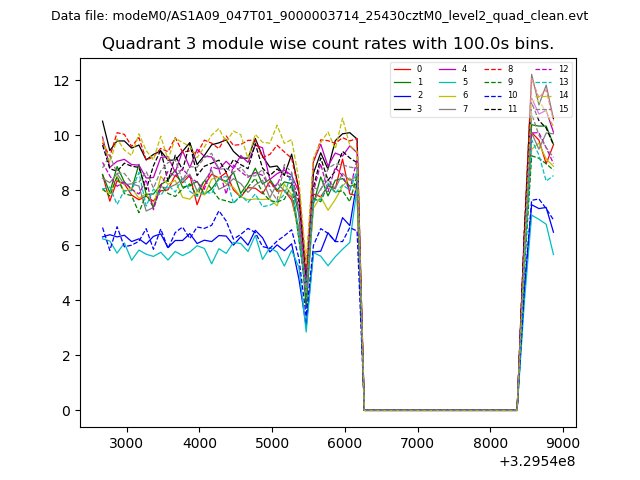
| Module-wise count rates for Quadrant C Data is divided into 100 sec bins |
 |
 |
| Module-wise count rates for Quadrant D Data is divided into 100 sec bins |
 |
 |
| Parameter | Plot |
|---|---|
| CZT HV Monitor | 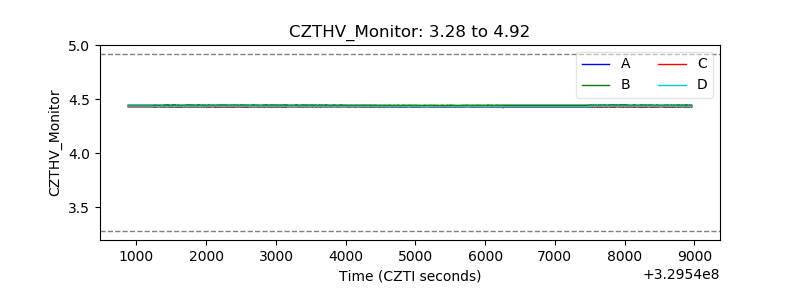 |
| D_VDD | 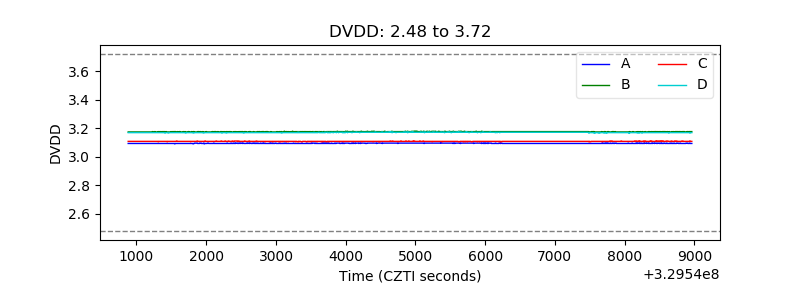 |
| Temperature 1 | 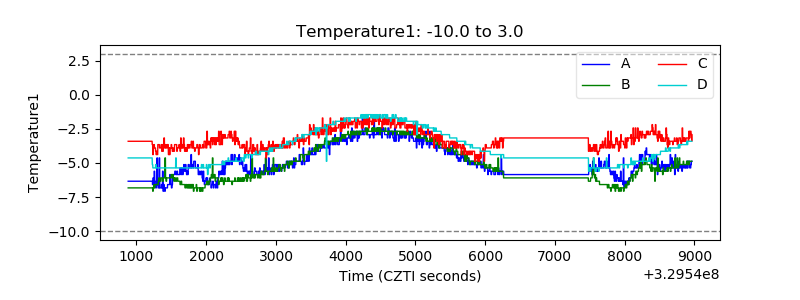 |
| Veto HV Monitor |  |
| Veto LLD |  |
| Alpha Counter | 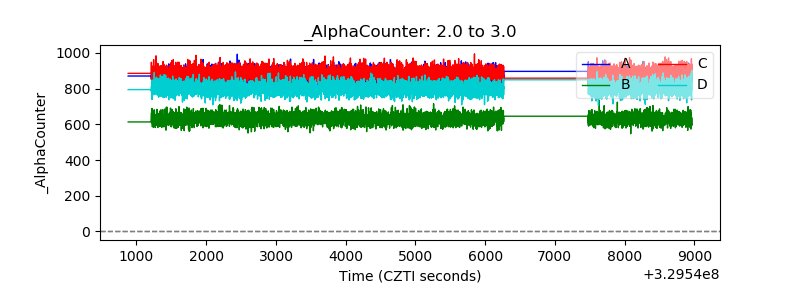 |
| _CPM_Rate | 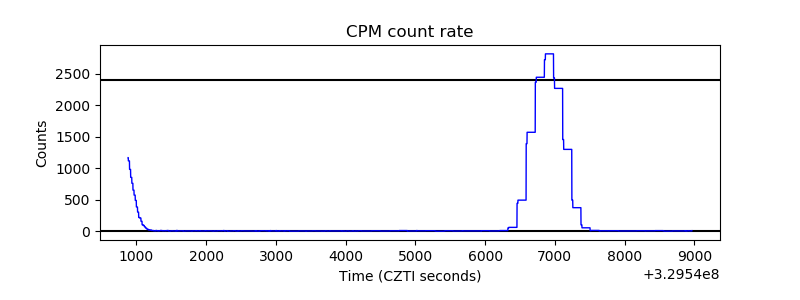 |
| CZT Counter | 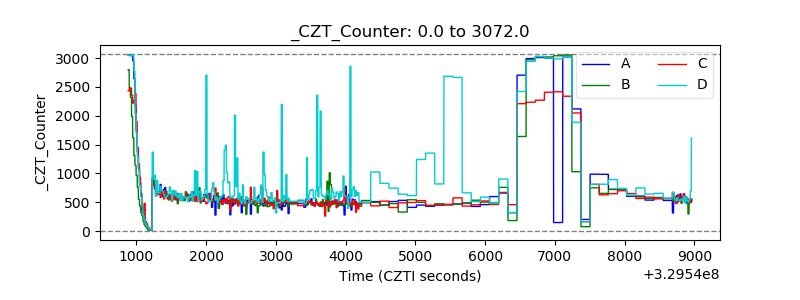 |
| +2.5 Volts monitor |  |
| +5 Volts monitor |  |
| _ROLL_ROT | 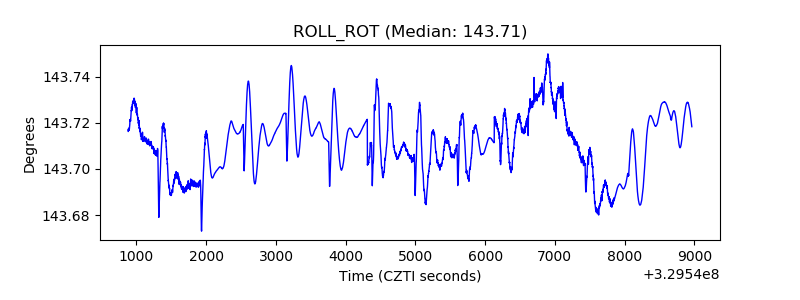 |
| _Roll_DEC | 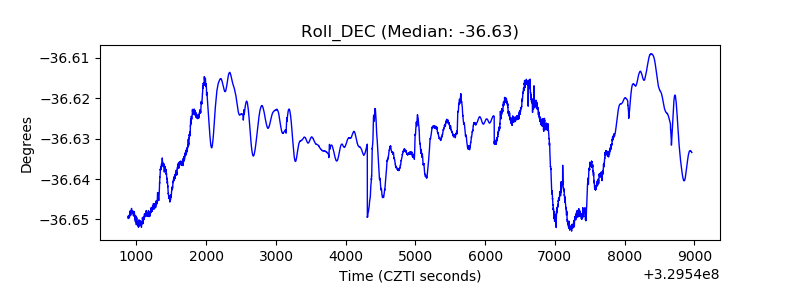 |
| _Roll_RA | 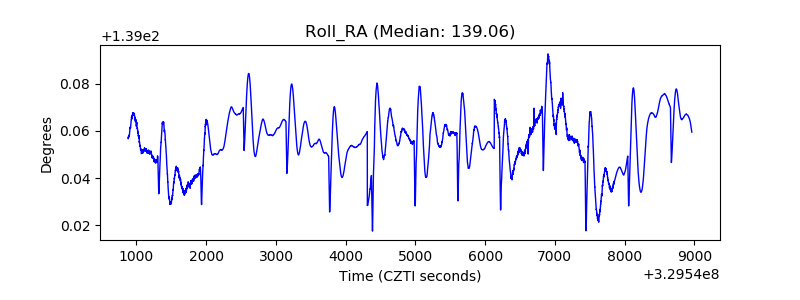 |
| Veto Counter | 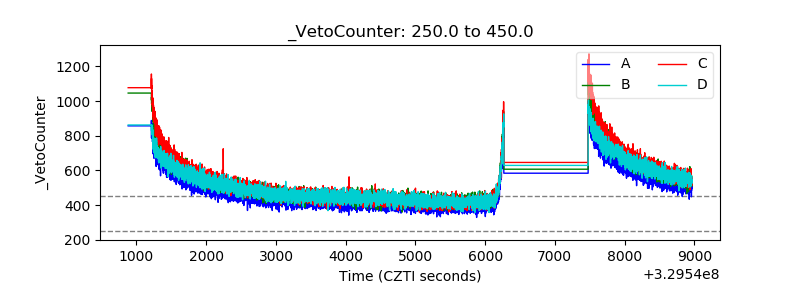 |