| Param | Original file | Final file |
|---|---|---|
| Filename | modeM0/AS1A09_047T01_9000003714_25432cztM0_level2.evt | modeM0/AS1A09_047T01_9000003714_25432cztM0_level2_quad_clean.evt |
| Size (bytes) | 692,078,400 | 106,899,840 |
| Size | 660.0 MB | 101.9 MB |
| Events in quadrant A | 3,374,009 | 796,996 |
| Events in quadrant B | 3,275,369 | 801,191 |
| Events in quadrant C | 3,289,827 | 765,100 |
| Events in quadrant D | 10,624,446 | 464,032 |
| Mode M9 | |||
|---|---|---|---|
| Quadrant | BADHDUFLAG | Total packets | Discarded packets |
| A | 0 | 14 | 0 |
| B | 0 | 14 | 0 |
| C | 0 | 14 | 0 |
| D | 0 | 14 | 0 |
| Mode M0 | |||
|---|---|---|---|
| Quadrant | BADHDUFLAG | Total packets | Discarded packets |
| A | 0 | 13882 | 0 |
| B | 0 | 13458 | 0 |
| C | 0 | 13638 | 0 |
| D | 0 | 35804 | 0 |
| Quadrant | Total seconds | Saturated seconds | Saturation percentage |
|---|---|---|---|
| A | 5854 | 94 | 1.605740% |
| B | 5855 | 101 | 1.725021% |
| C | 5855 | 155 | 2.647310% |
| D | 5855 | 3268 | 55.815542% |
Noise dominated data is calculated using 1-second bins in cleaned event files. If a bin has >2000 counts, and if more than 50% of those come from <1% of pixels, then it is considered to be noise-dominated and hence unusable.
| Quadrant | # 1 sec bins | Bins with >0 counts | Bins with >2000 counts | High rate bins dominated by noise | Noise dominated (total time) | Noise dominated (detector-on time) | Marked lightcurve |
|---|---|---|---|---|---|---|---|
| A | 7199 | 5854 | 0 | 0 | 0.00% | 0.00% | 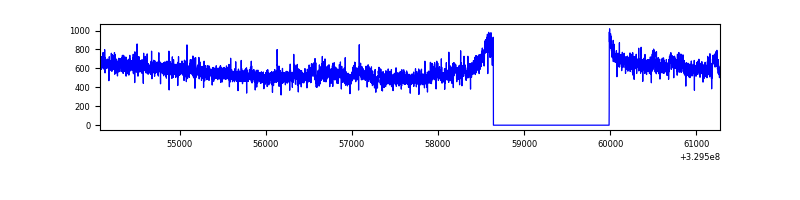 |
| B | 7200 | 5855 | 9 | 9 | 0.12% | 0.15% | 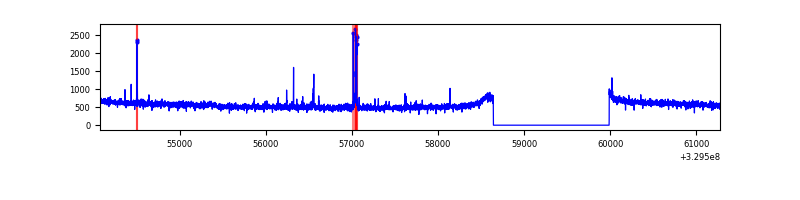 |
| C | 7200 | 5855 | 0 | 0 | 0.00% | 0.00% | 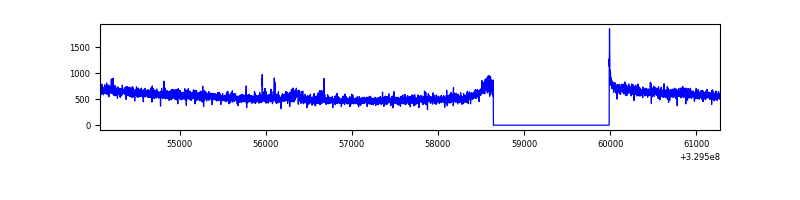 |
| D | 7200 | 5855 | 3150 | 3150 | 43.75% | 53.80% | 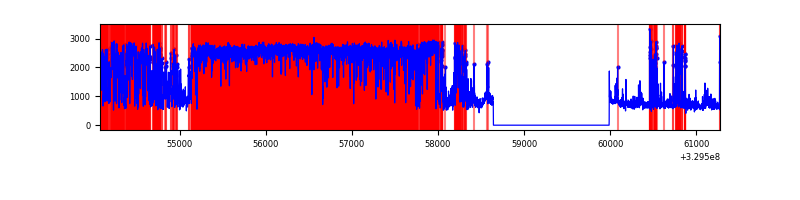 |
Top three noisy pixels from each quadrant. If the there are fewer than three noisy pixels in the level2.evt file, extra rows are filled as -1
| Pixel properties | Quadrant properties | ||||||
|---|---|---|---|---|---|---|---|
| Quadrant | DetID | PixID | Counts | Sigma | Mean | Median | Sigma |
| A | 6 | 16 | 125054 | 746.62 | 842 | 829 | 166.4 |
| A | 13 | 254 | 8512 | 46.18 | 842 | 829 | 166.4 |
| A | 0 | 226 | 7427 | 39.66 | 842 | 829 | 166.4 |
| B | 5 | 172 | 44772 | 289.59 | 818 | 800 | 151.8 |
| B | 12 | 111 | 17595 | 110.61 | 818 | 800 | 151.8 |
| B | 0 | 245 | 16959 | 106.42 | 818 | 800 | 151.8 |
| C | 14 | 238 | 132943 | 728.42 | 798 | 806 | 181.4 |
| C | 7 | 247 | 33134 | 178.21 | 798 | 806 | 181.4 |
| C | 0 | 10 | 8111 | 40.27 | 798 | 806 | 181.4 |
| D | 12 | 233 | 3898708 | 27577.62 | 589 | 574 | 141.4 |
| D | 1 | 52 | 2749411 | 19446.84 | 589 | 574 | 141.4 |
| D | 2 | 244 | 1347029 | 9525.59 | 589 | 574 | 141.4 |
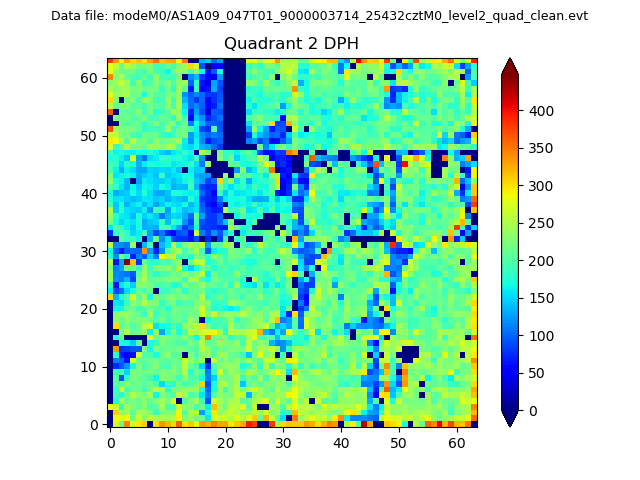
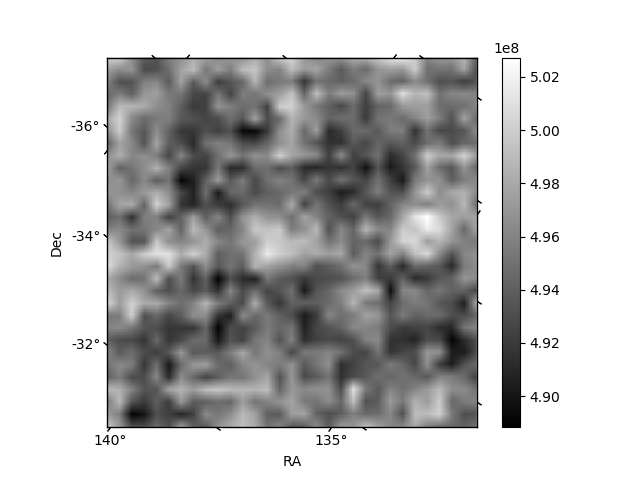
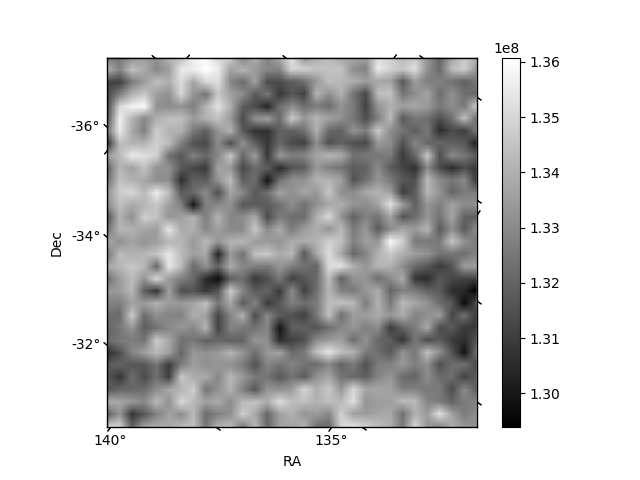
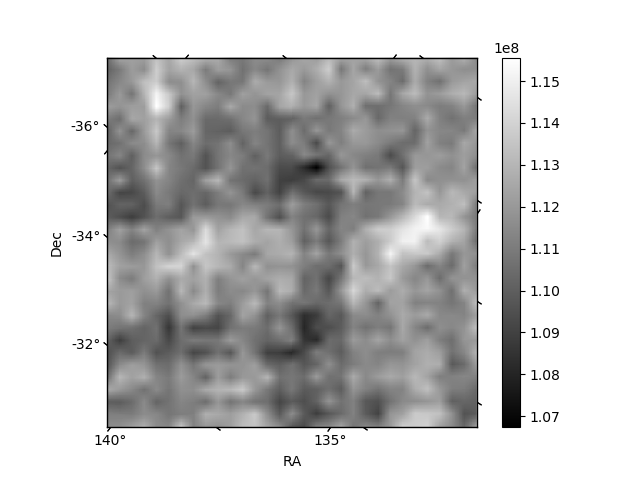
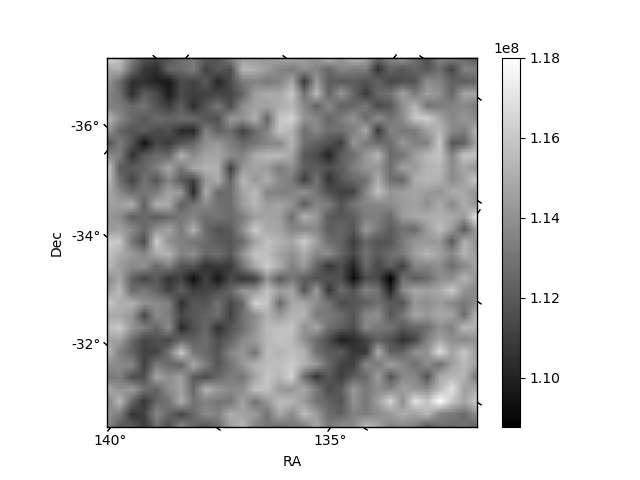
Histogram calculated using DETX and DETY for each event in the final _common_clean file
| Quadrant A | 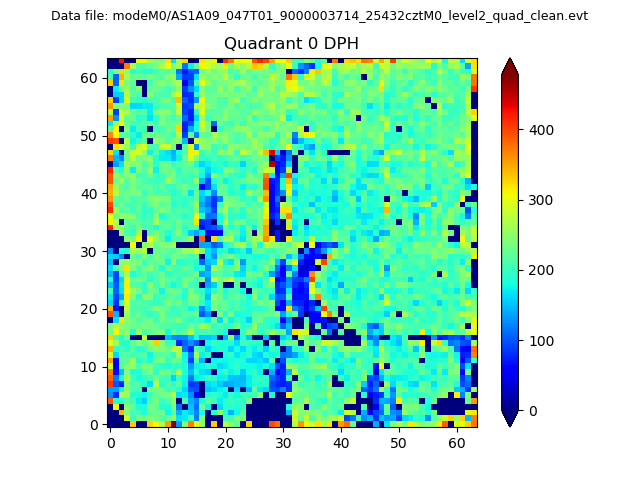 |
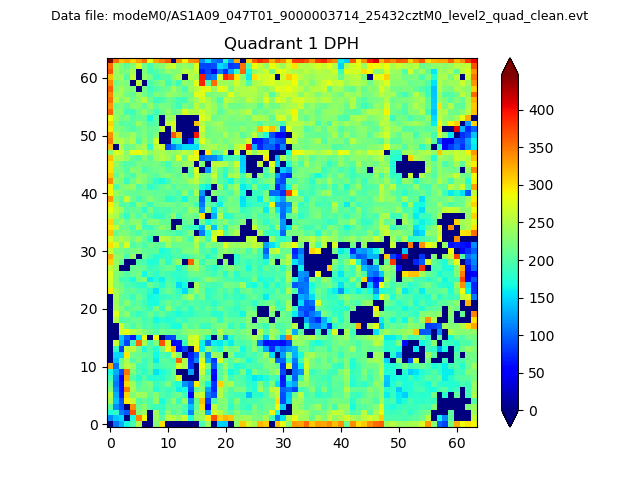 |
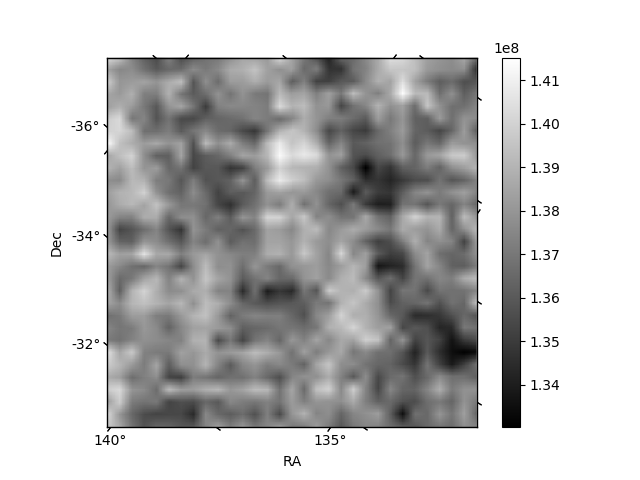
Quadrant B |
|---|---|---|---|
| Quadrant D | 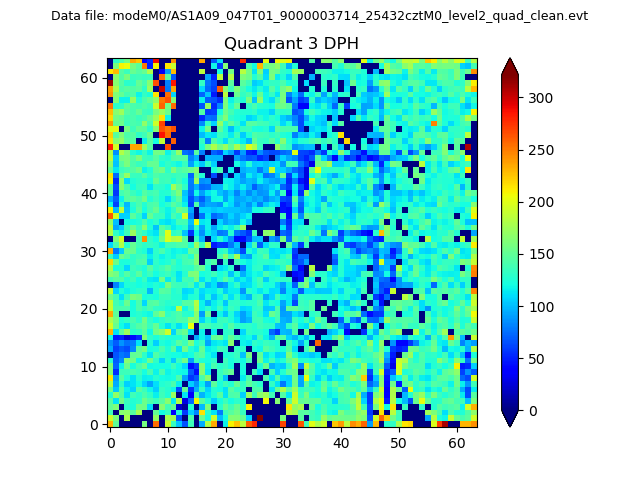 |
 |
Quadrant C |
| Plot type | Count rate plots | Images |
|---|---|---|
| Comparison with Poisson distribution Blue bars denote a histogram of data divided into 1 sec bins. Red curve is a Poisson curve with rate = median count rate of data. |
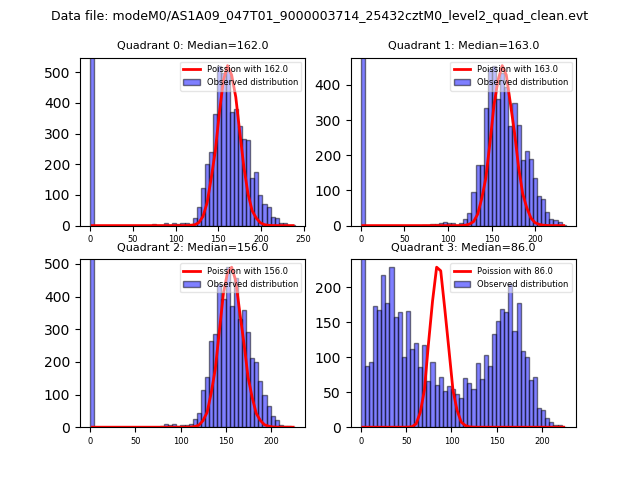 |
 |
| Quadrant-wise count rates Data is divided into 100 sec bins |
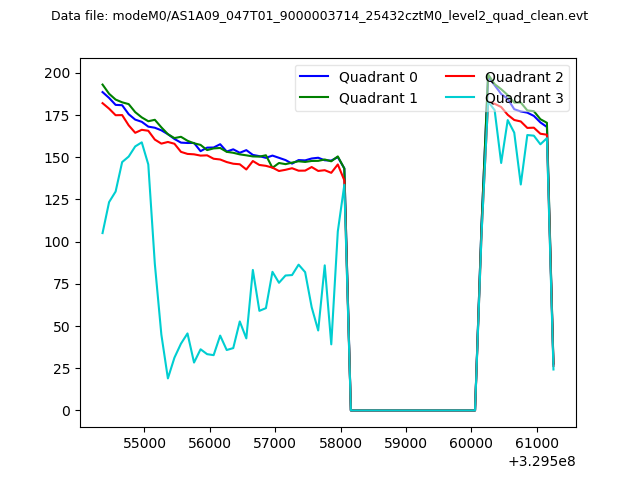 |
|
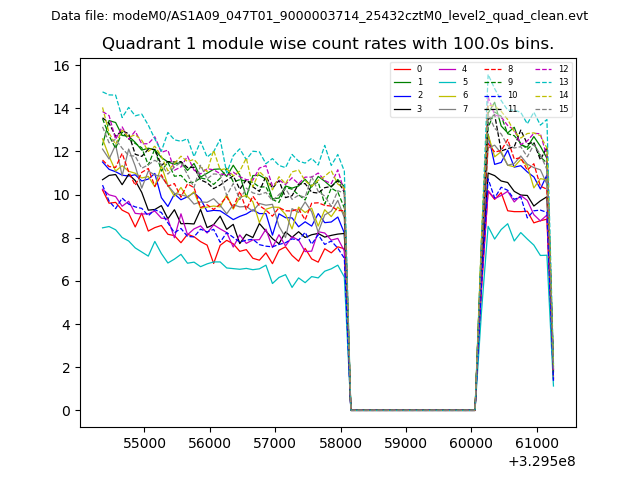
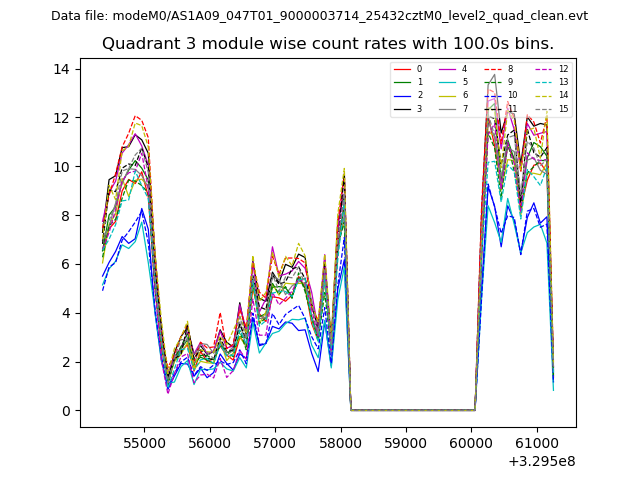
| Module-wise count rates for Quadrant A Data is divided into 100 sec bins |
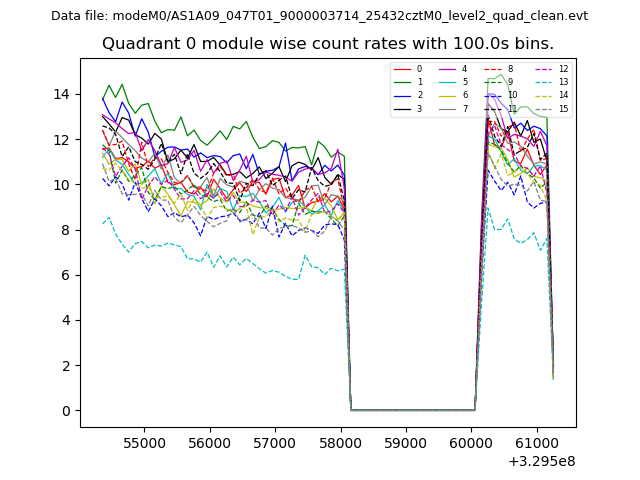 |
 |
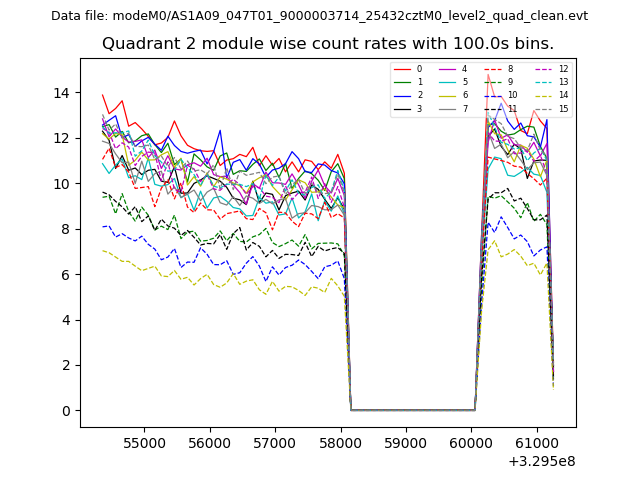
| Module-wise count rates for Quadrant B Data is divided into 100 sec bins |
 |
 |
| Module-wise count rates for Quadrant C Data is divided into 100 sec bins |
 |
 |
| Module-wise count rates for Quadrant D Data is divided into 100 sec bins |
 |
 |
| Parameter | Plot |
|---|---|
| CZT HV Monitor | 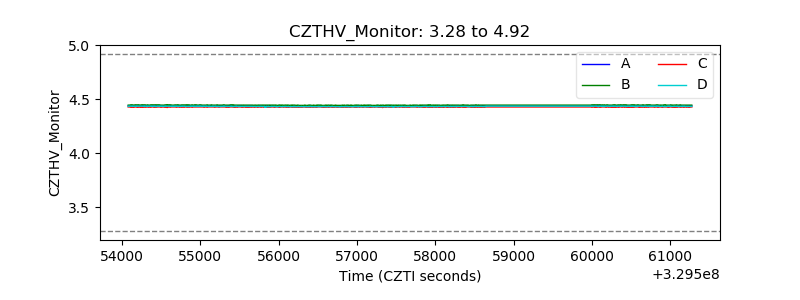 |
| D_VDD | 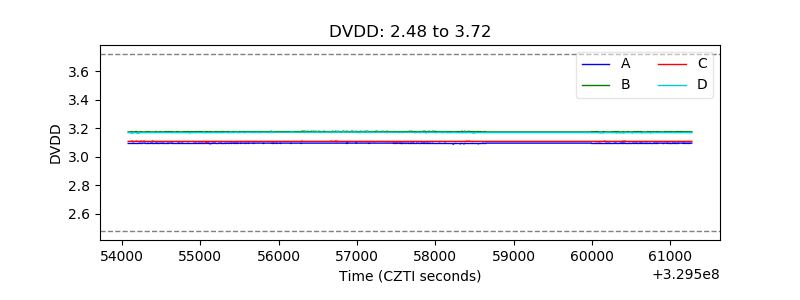 |
| Temperature 1 | 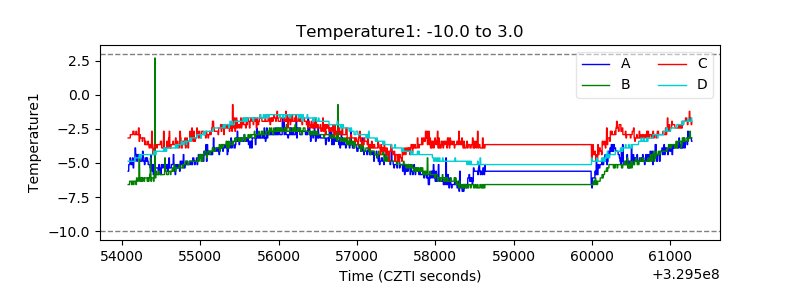 |
| Veto HV Monitor | 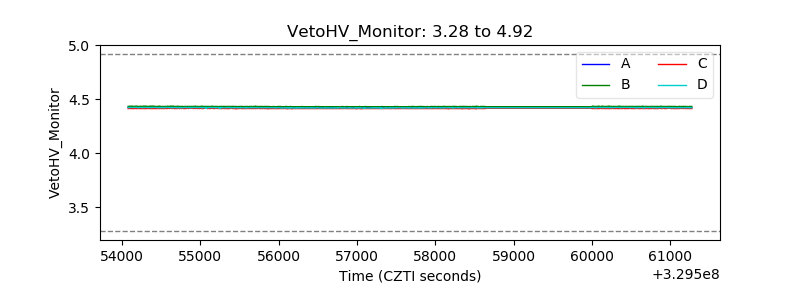 |
| Veto LLD | 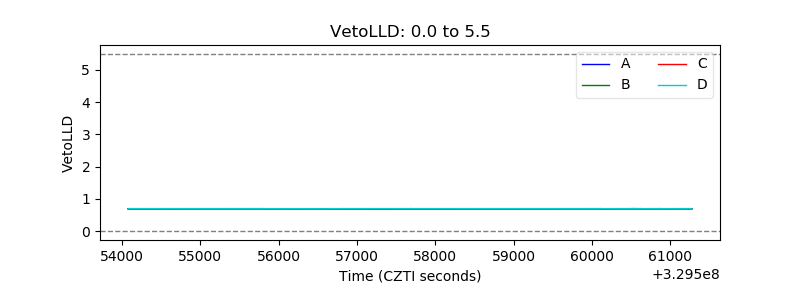 |
| Alpha Counter | 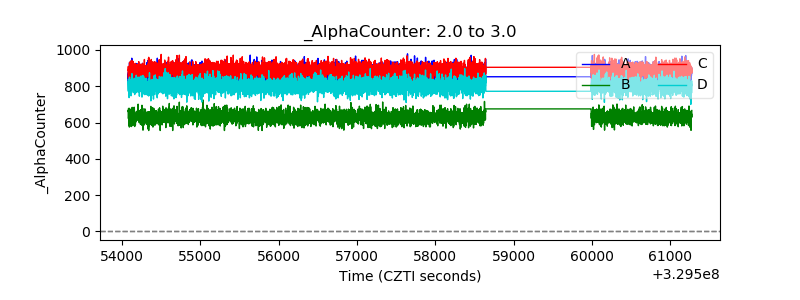 |
| _CPM_Rate | 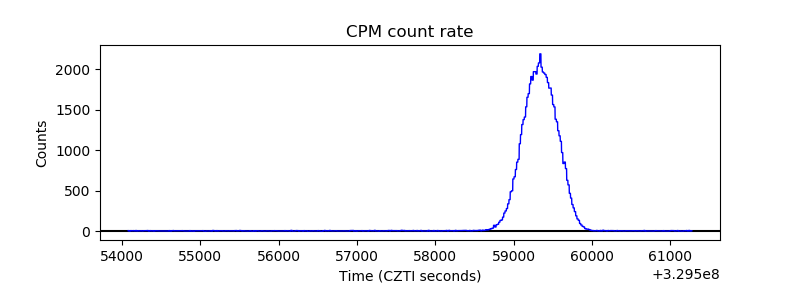 |
| CZT Counter | 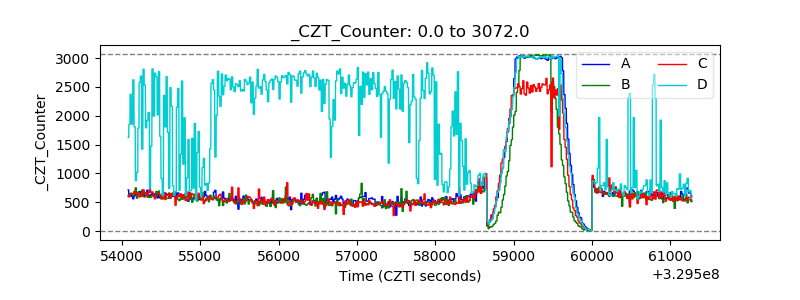 |
| +2.5 Volts monitor |  |
| +5 Volts monitor |  |
| _ROLL_ROT | 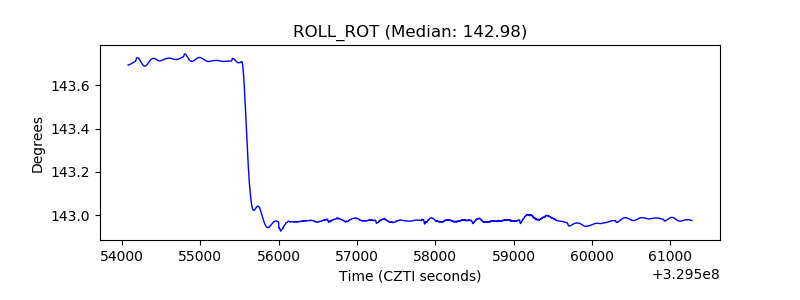 |
| _Roll_DEC | 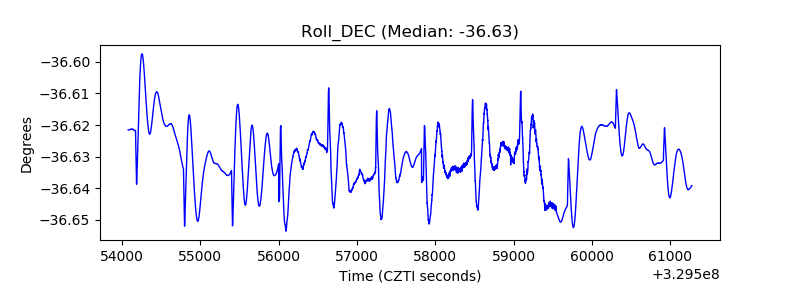 |
| _Roll_RA | 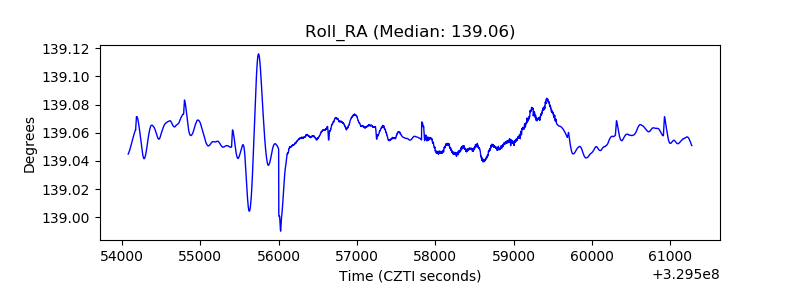 |
| Veto Counter | 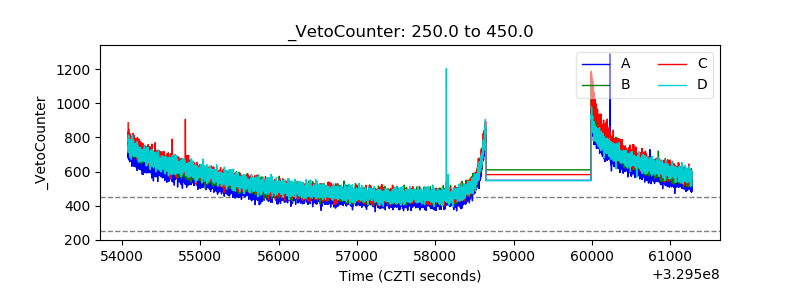 |