| Param | Original file | Final file |
|---|---|---|
| Filename | modeM0/AS1A09_047T01_9000003714_25433cztM0_level2.evt | modeM0/AS1A09_047T01_9000003714_25433cztM0_level2_quad_clean.evt |
| Size (bytes) | 587,672,640 | 123,120,000 |
| Size | 560.4 MB | 117.4 MB |
| Events in quadrant A | 3,435,064 | 864,589 |
| Events in quadrant B | 3,383,367 | 863,305 |
| Events in quadrant C | 3,402,519 | 823,152 |
| Events in quadrant D | 7,151,605 | 739,552 |
| Mode M9 | |||
|---|---|---|---|
| Quadrant | BADHDUFLAG | Total packets | Discarded packets |
| A | 0 | 13 | 0 |
| B | 0 | 13 | 0 |
| C | 0 | 13 | 0 |
| D | 0 | 13 | 0 |
| Mode M0 | |||
|---|---|---|---|
| Quadrant | BADHDUFLAG | Total packets | Discarded packets |
| A | 0 | 14224 | 0 |
| B | 0 | 13955 | 0 |
| C | 0 | 14049 | 0 |
| D | 0 | 25872 | 0 |
| Quadrant | Total seconds | Saturated seconds | Saturation percentage |
|---|---|---|---|
| A | 6275 | 82 | 1.306773% |
| B | 6276 | 98 | 1.561504% |
| C | 6276 | 168 | 2.676864% |
| D | 6276 | 1196 | 19.056724% |
Noise dominated data is calculated using 1-second bins in cleaned event files. If a bin has >2000 counts, and if more than 50% of those come from <1% of pixels, then it is considered to be noise-dominated and hence unusable.
| Quadrant | # 1 sec bins | Bins with >0 counts | Bins with >2000 counts | High rate bins dominated by noise | Noise dominated (total time) | Noise dominated (detector-on time) | Marked lightcurve |
|---|---|---|---|---|---|---|---|
| A | 7620 | 6275 | 0 | 0 | 0.00% | 0.00% | 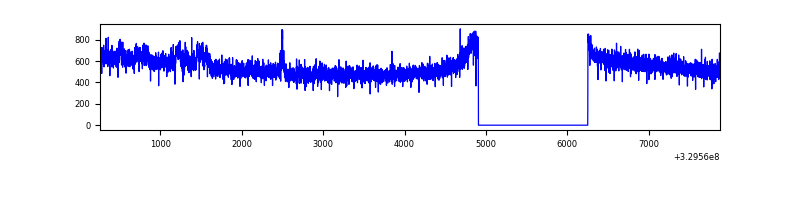 |
| B | 7621 | 6276 | 0 | 0 | 0.00% | 0.00% | 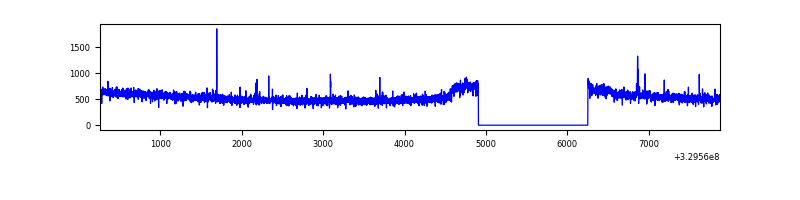 |
| C | 7621 | 6276 | 0 | 0 | 0.00% | 0.00% | 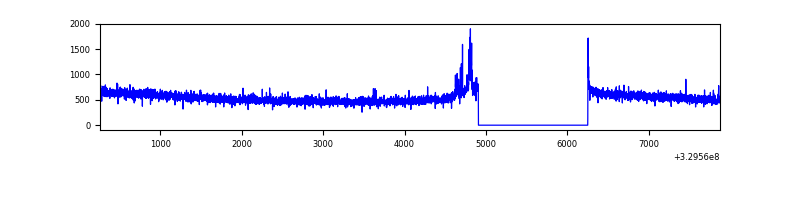 |
| D | 7621 | 6276 | 1078 | 1078 | 14.15% | 17.18% | 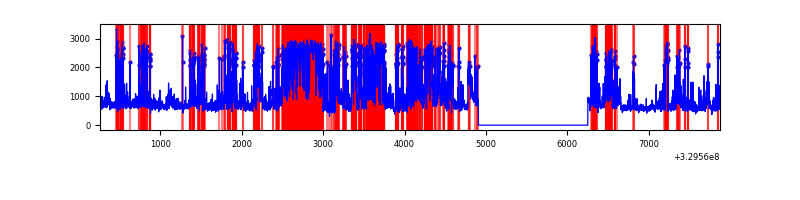 |
Top three noisy pixels from each quadrant. If the there are fewer than three noisy pixels in the level2.evt file, extra rows are filled as -1
| Pixel properties | Quadrant properties | ||||||
|---|---|---|---|---|---|---|---|
| Quadrant | DetID | PixID | Counts | Sigma | Mean | Median | Sigma |
| A | 6 | 16 | 81295 | 469.62 | 870 | 854 | 171.3 |
| A | 13 | 254 | 9610 | 51.12 | 870 | 854 | 171.3 |
| A | 0 | 226 | 7519 | 38.91 | 870 | 854 | 171.3 |
| B | 0 | 230 | 49933 | 311.68 | 846 | 826 | 157.6 |
| B | 12 | 111 | 18519 | 112.3 | 846 | 826 | 157.6 |
| B | 11 | 111 | 16665 | 100.53 | 846 | 826 | 157.6 |
| C | 14 | 238 | 134284 | 712.05 | 822 | 828 | 187.4 |
| C | 7 | 247 | 55095 | 289.54 | 822 | 828 | 187.4 |
| C | 0 | 10 | 7677 | 36.54 | 822 | 828 | 187.4 |
| D | 1 | 52 | 3499448 | 18508.76 | 785 | 765 | 189.0 |
| D | 8 | 195 | 348902 | 1841.72 | 785 | 765 | 189.0 |
| D | 12 | 233 | 224287 | 1182.48 | 785 | 765 | 189.0 |
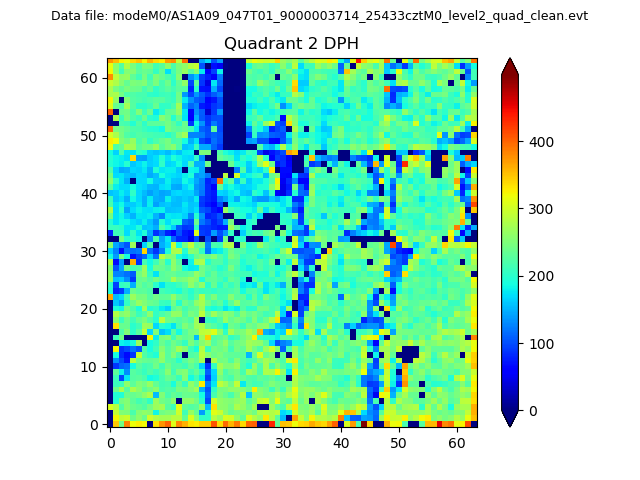
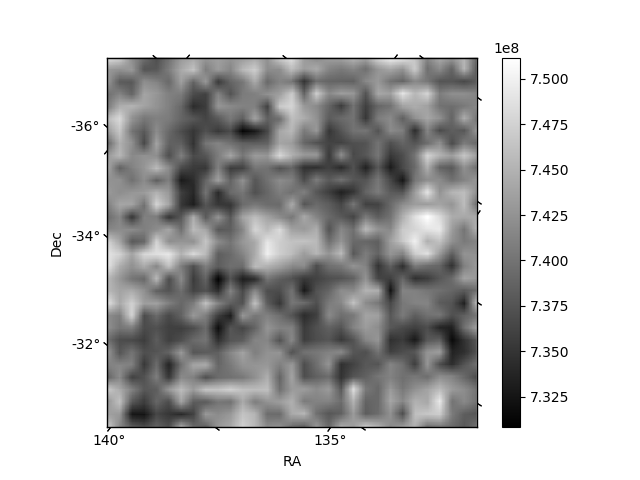
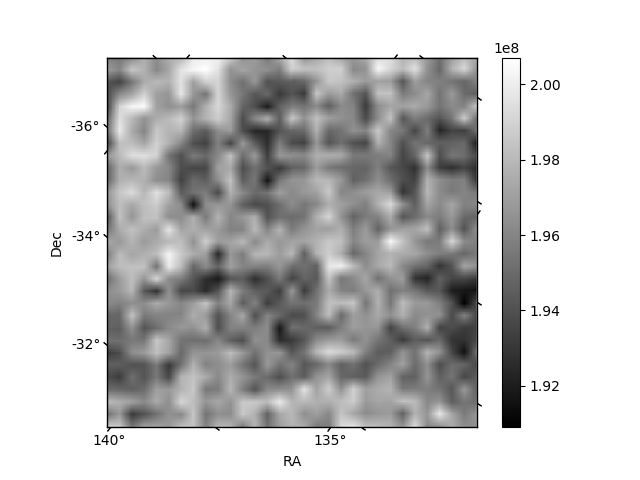
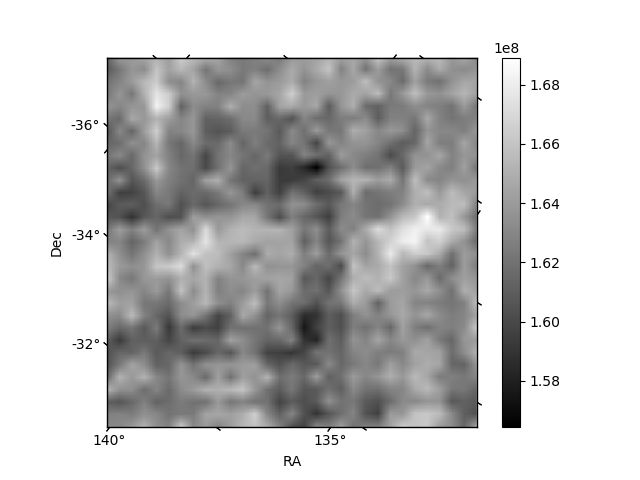
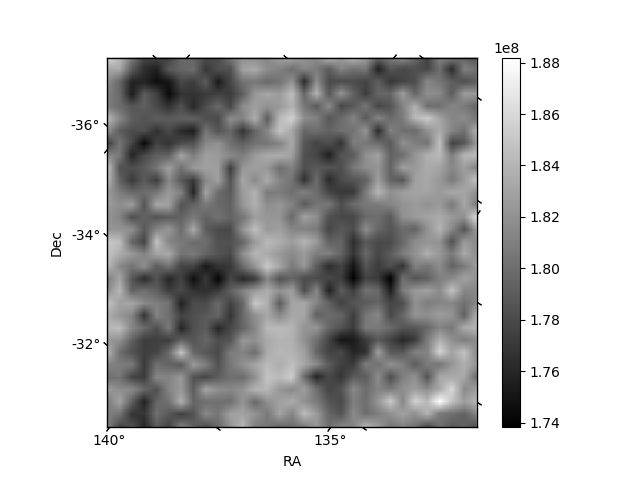
Histogram calculated using DETX and DETY for each event in the final _common_clean file
| Quadrant A | 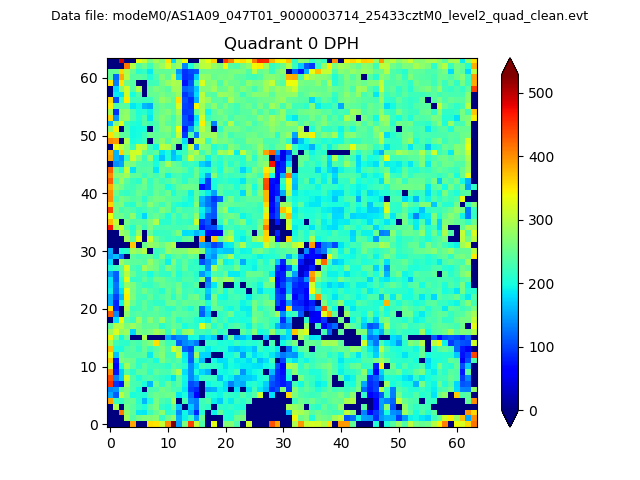 |
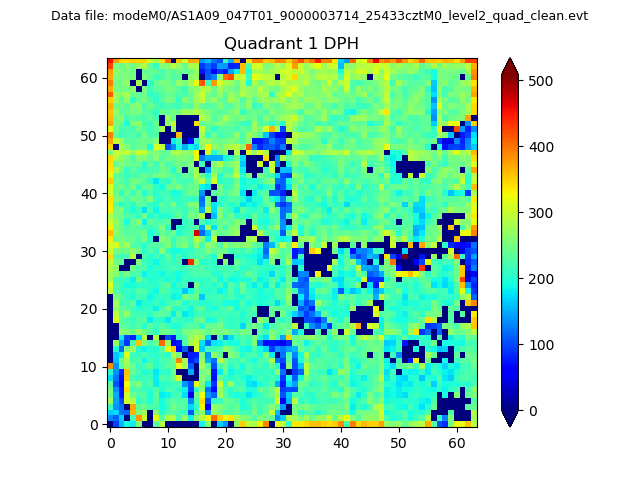 |
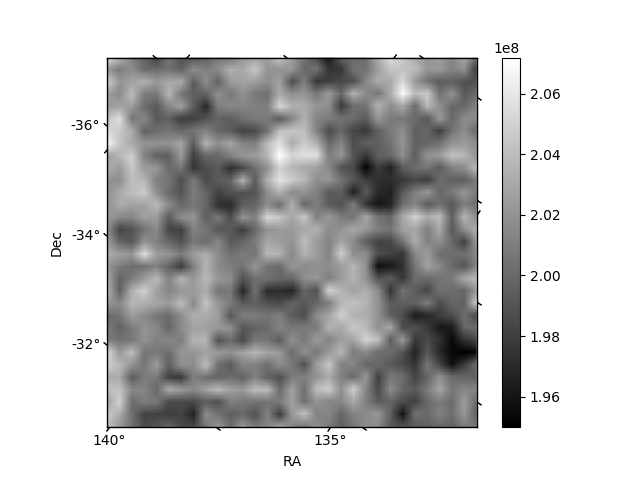
Quadrant B |
|---|---|---|---|
| Quadrant D | 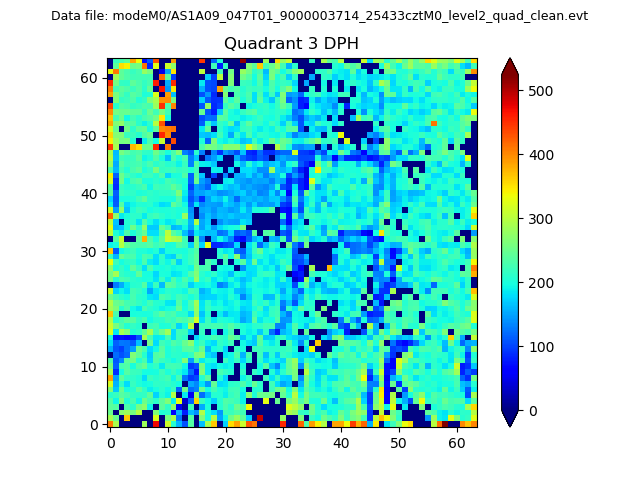 |
 |
Quadrant C |
| Plot type | Count rate plots | Images |
|---|---|---|
| Comparison with Poisson distribution Blue bars denote a histogram of data divided into 1 sec bins. Red curve is a Poisson curve with rate = median count rate of data. |
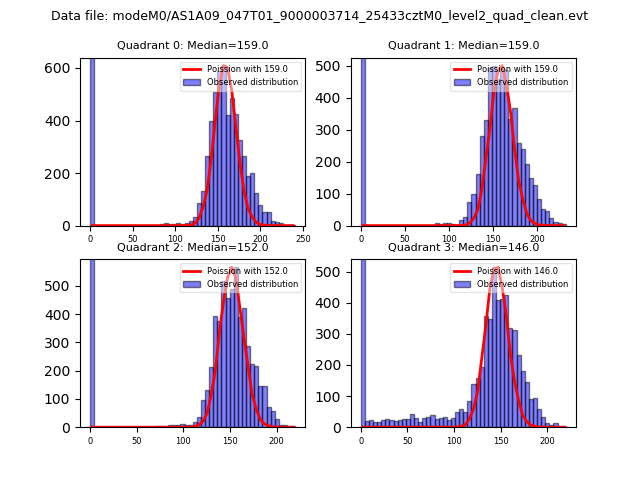 |
 |
| Quadrant-wise count rates Data is divided into 100 sec bins |
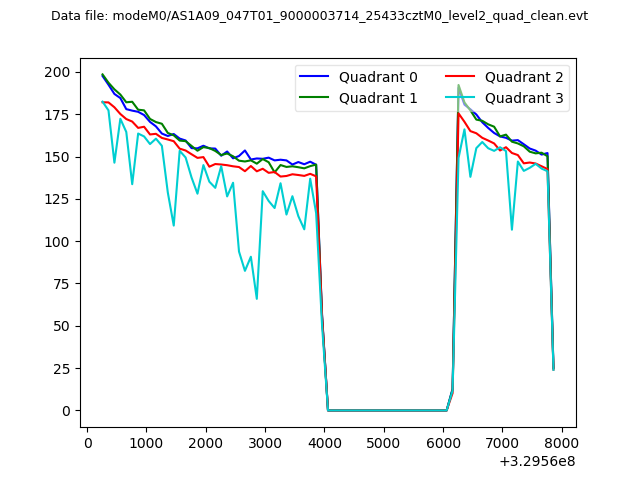 |
|
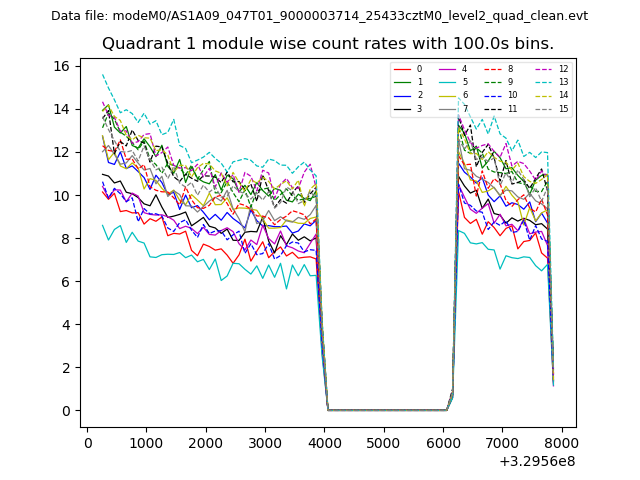
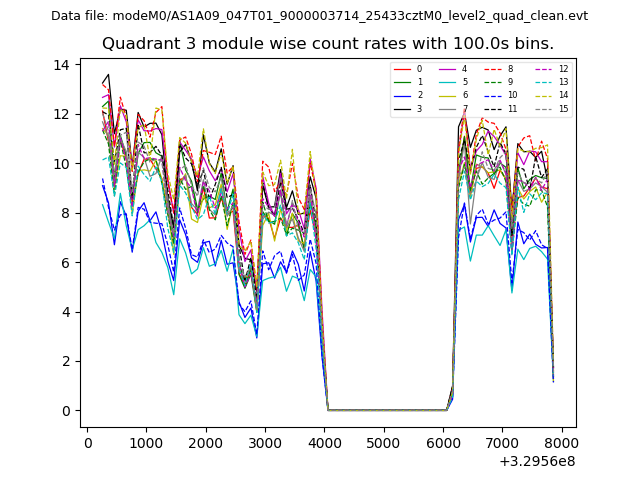
| Module-wise count rates for Quadrant A Data is divided into 100 sec bins |
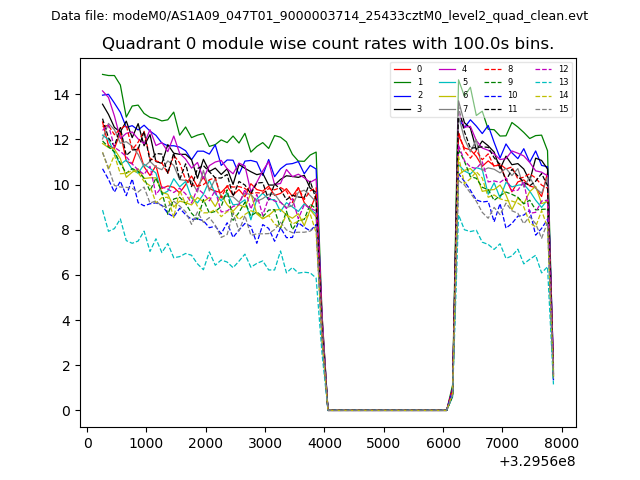 |
 |
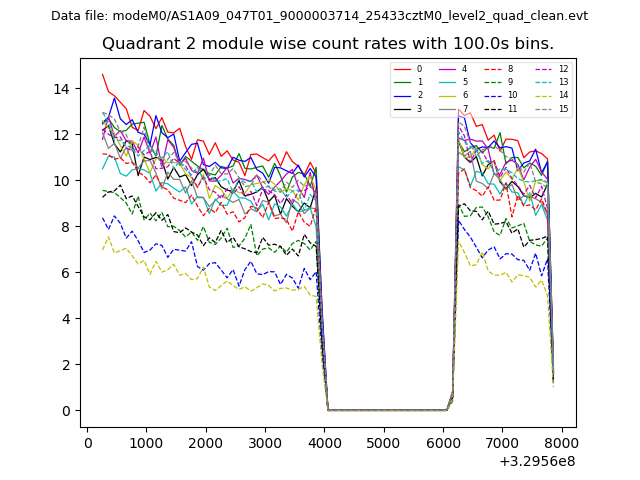
| Module-wise count rates for Quadrant B Data is divided into 100 sec bins |
 |
 |
| Module-wise count rates for Quadrant C Data is divided into 100 sec bins |
 |
 |
| Module-wise count rates for Quadrant D Data is divided into 100 sec bins |
 |
 |
| Parameter | Plot |
|---|---|
| CZT HV Monitor | 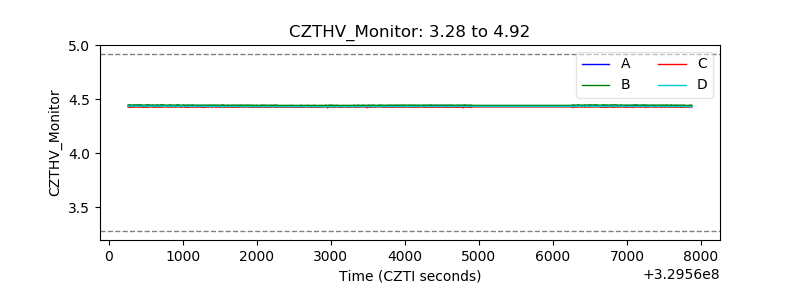 |
| D_VDD | 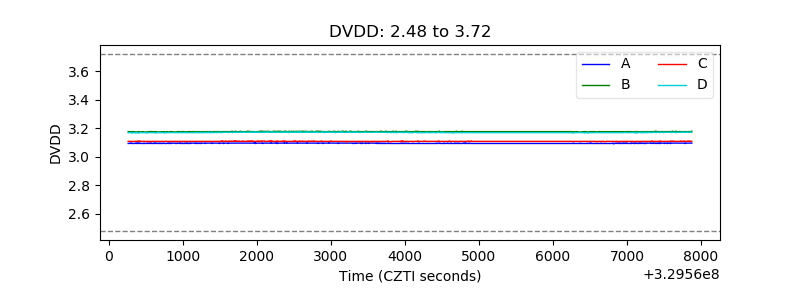 |
| Temperature 1 | 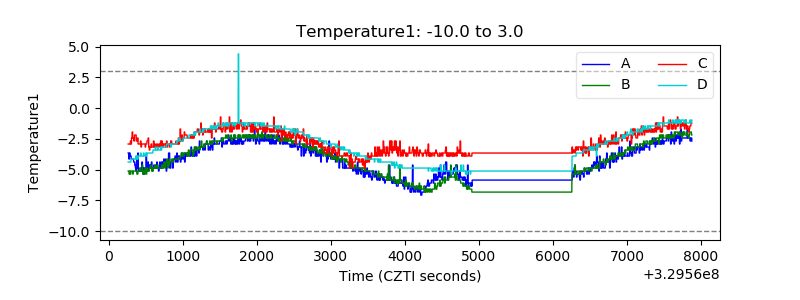 |
| Veto HV Monitor | 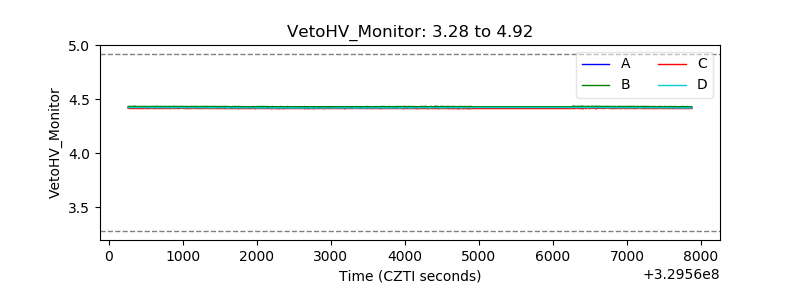 |
| Veto LLD |  |
| Alpha Counter | 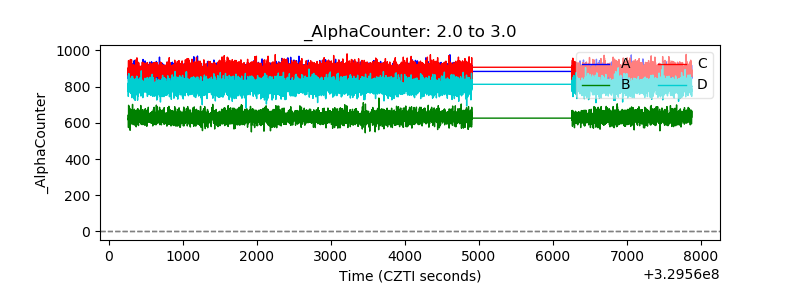 |
| _CPM_Rate | 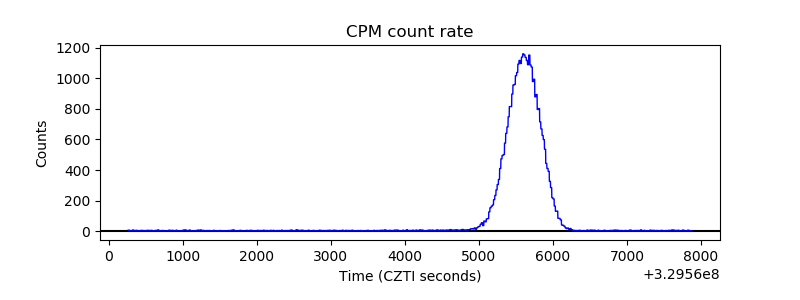 |
| CZT Counter | 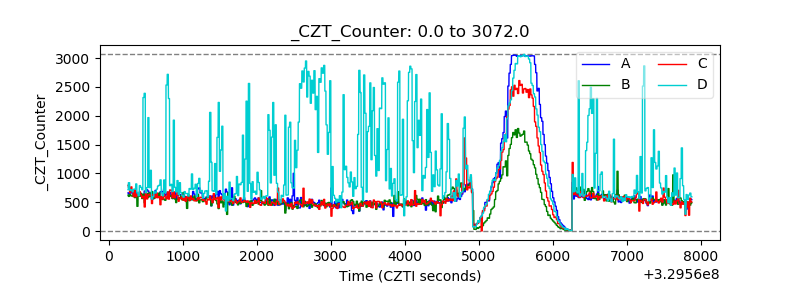 |
| +2.5 Volts monitor |  |
| +5 Volts monitor |  |
| _ROLL_ROT | 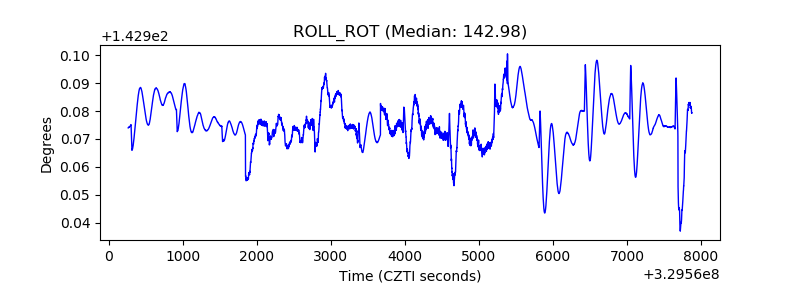 |
| _Roll_DEC | 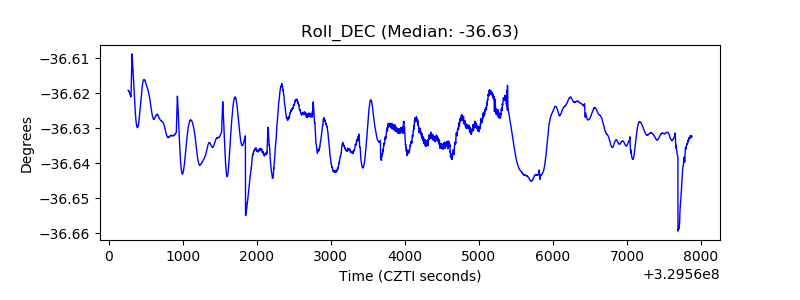 |
| _Roll_RA |  |
| Veto Counter | 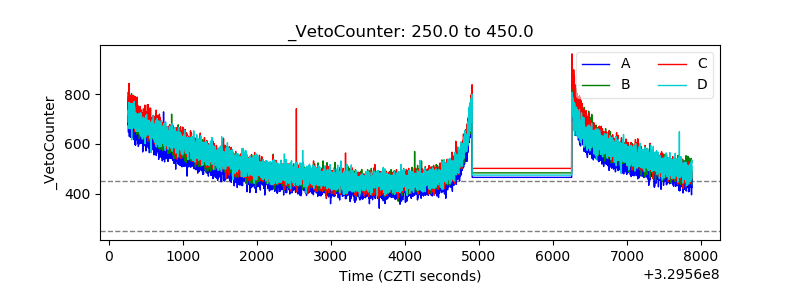 |