| Param | Original file | Final file |
|---|---|---|
| Filename | modeM0/AS1A09_047T01_9000003714_25434cztM0_level2.evt | modeM0/AS1A09_047T01_9000003714_25434cztM0_level2_quad_clean.evt |
| Size (bytes) | 497,672,640 | 98,611,200 |
| Size | 474.6 MB | 94.0 MB |
| Events in quadrant A | 3,073,300 | 674,045 |
| Events in quadrant B | 3,091,290 | 668,346 |
| Events in quadrant C | 3,061,339 | 638,529 |
| Events in quadrant D | 5,436,349 | 583,436 |
| Mode M9 | |||
|---|---|---|---|
| Quadrant | BADHDUFLAG | Total packets | Discarded packets |
| A | 0 | 11 | 0 |
| B | 0 | 11 | 0 |
| C | 0 | 11 | 0 |
| D | 0 | 11 | 0 |
| Mode M0 | |||
|---|---|---|---|
| Quadrant | BADHDUFLAG | Total packets | Discarded packets |
| A | 0 | 12696 | 0 |
| B | 0 | 12900 | 0 |
| C | 0 | 12790 | 0 |
| D | 0 | 20183 | 0 |
| Quadrant | Total seconds | Saturated seconds | Saturation percentage |
|---|---|---|---|
| A | 6036 | 55 | 0.911199% |
| B | 6036 | 54 | 0.894632% |
| C | 6037 | 115 | 1.904920% |
| D | 6036 | 625 | 10.354539% |
Noise dominated data is calculated using 1-second bins in cleaned event files. If a bin has >2000 counts, and if more than 50% of those come from <1% of pixels, then it is considered to be noise-dominated and hence unusable.
| Quadrant | # 1 sec bins | Bins with >0 counts | Bins with >2000 counts | High rate bins dominated by noise | Noise dominated (total time) | Noise dominated (detector-on time) | Marked lightcurve |
|---|---|---|---|---|---|---|---|
| A | 7186 | 6036 | 0 | 0 | 0.00% | 0.00% | 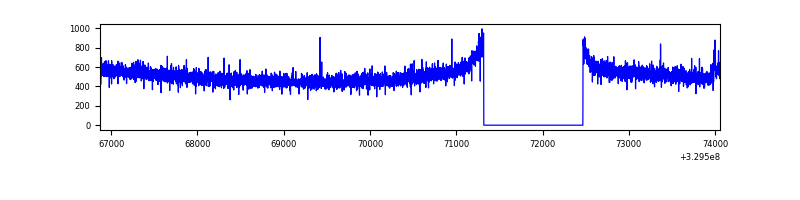 |
| B | 7186 | 6036 | 2 | 2 | 0.03% | 0.03% | 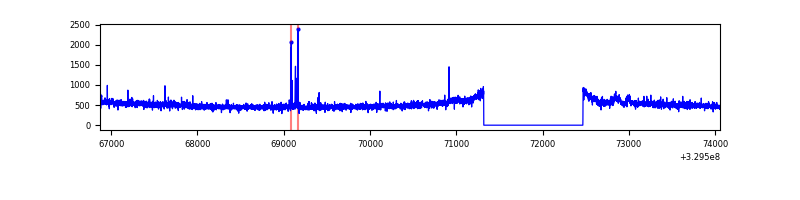 |
| C | 7187 | 6037 | 0 | 0 | 0.00% | 0.00% | 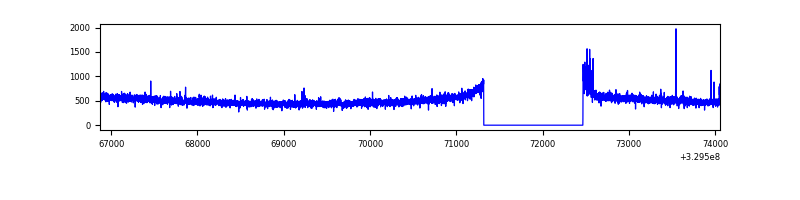 |
| D | 7185 | 6035 | 561 | 561 | 7.81% | 9.30% | 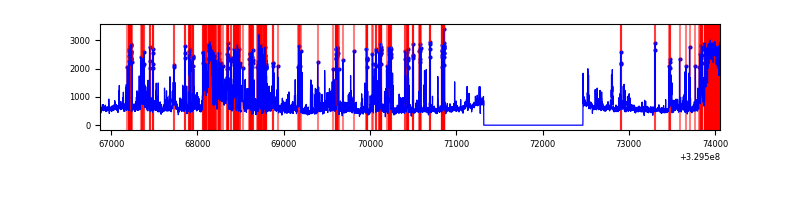 |
Top three noisy pixels from each quadrant. If the there are fewer than three noisy pixels in the level2.evt file, extra rows are filled as -1
| Pixel properties | Quadrant properties | ||||||
|---|---|---|---|---|---|---|---|
| Quadrant | DetID | PixID | Counts | Sigma | Mean | Median | Sigma |
| A | 6 | 16 | 22754 | 139.85 | 790 | 776 | 157.1 |
| A | 13 | 254 | 9520 | 55.64 | 790 | 776 | 157.1 |
| A | 3 | 137 | 6955 | 39.32 | 790 | 776 | 157.1 |
| B | 0 | 230 | 39332 | 265.35 | 769 | 753 | 145.4 |
| B | 0 | 245 | 26162 | 174.76 | 769 | 753 | 145.4 |
| B | 12 | 111 | 17286 | 113.71 | 769 | 753 | 145.4 |
| C | 14 | 238 | 120940 | 699.97 | 741 | 747 | 171.7 |
| C | 5 | 112 | 27242 | 154.3 | 741 | 747 | 171.7 |
| C | 7 | 247 | 13576 | 74.71 | 741 | 747 | 171.7 |
| D | 1 | 52 | 1886340 | 10859.25 | 721 | 702 | 173.6 |
| D | 12 | 233 | 583227 | 3354.72 | 721 | 702 | 173.6 |
| D | 8 | 195 | 107223 | 613.45 | 721 | 702 | 173.6 |
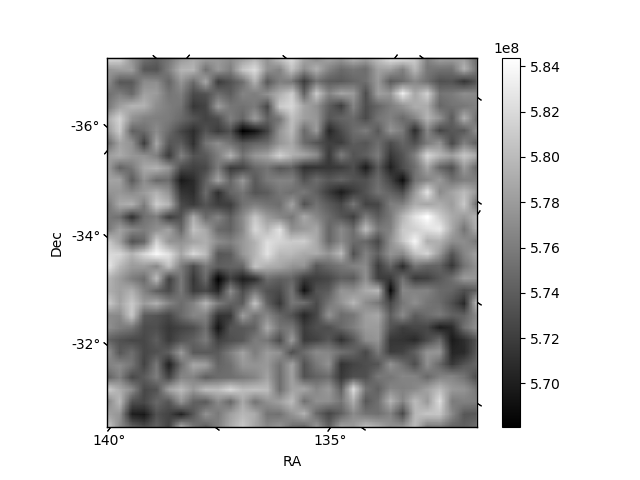
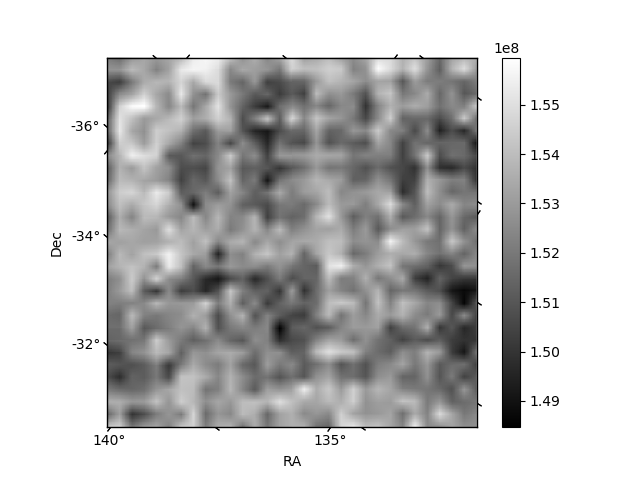
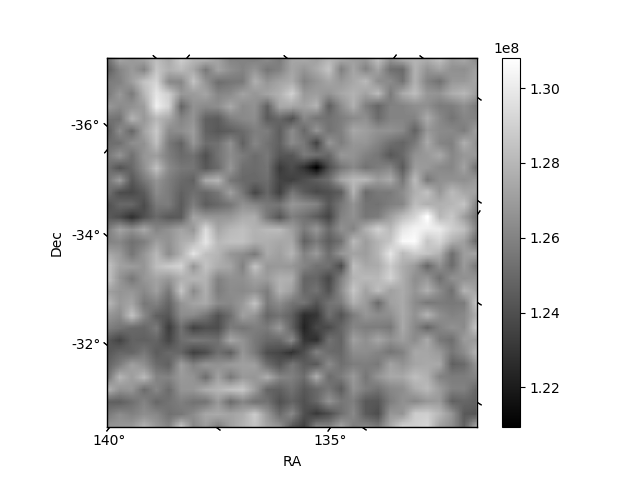
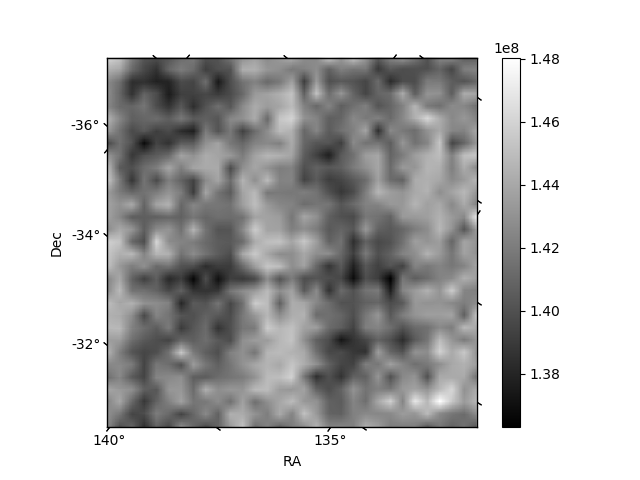
Histogram calculated using DETX and DETY for each event in the final _common_clean file
| Quadrant A | 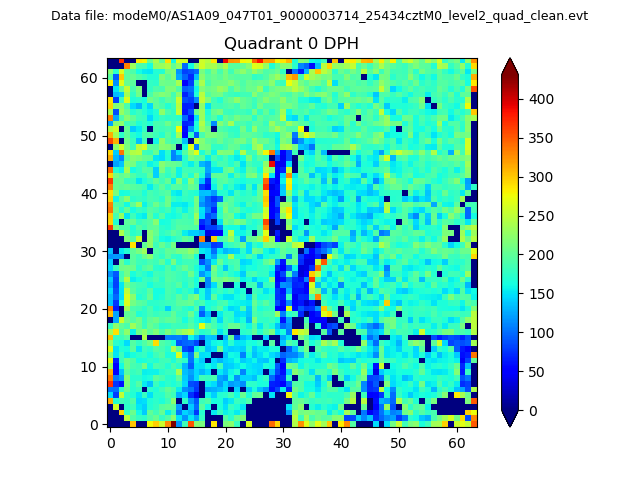 |
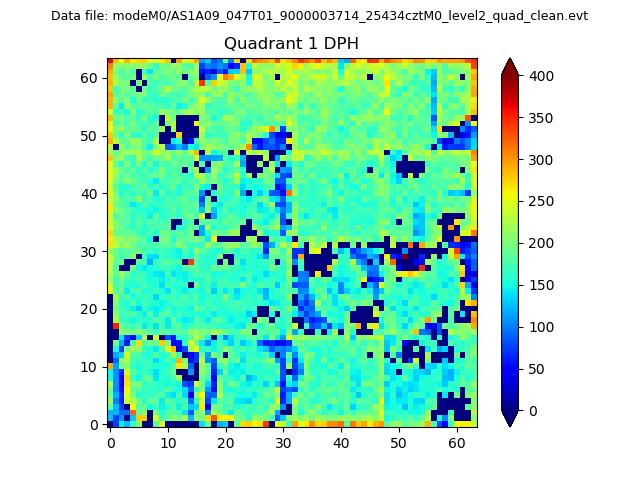 |
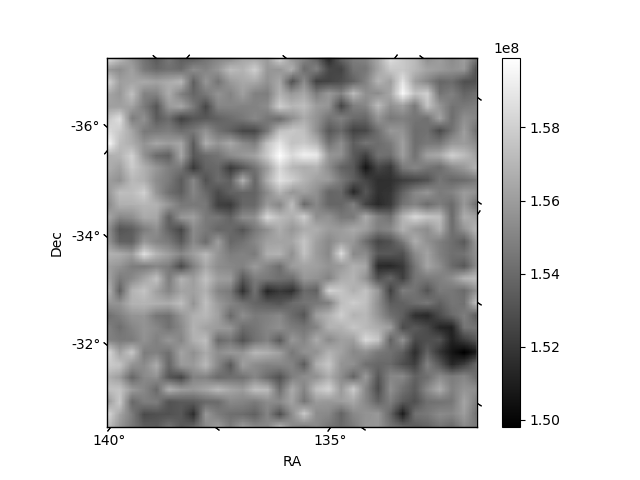
Quadrant B |
|---|---|---|---|
| Quadrant D | 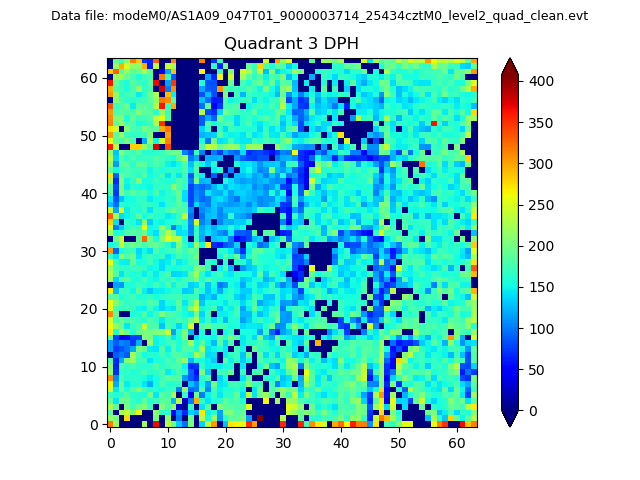 |
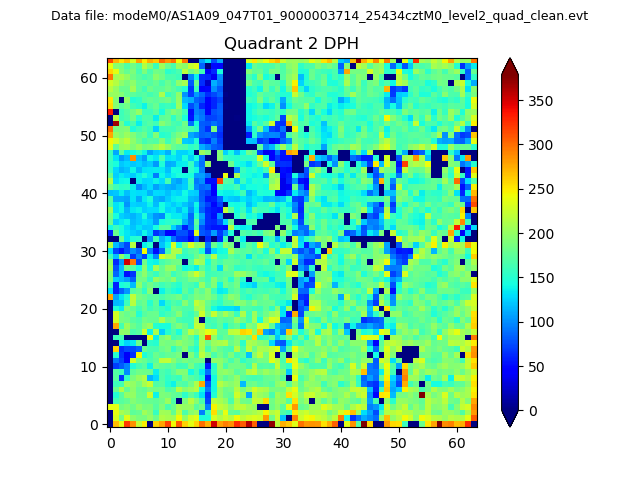 |
Quadrant C |
| Plot type | Count rate plots | Images |
|---|---|---|
| Comparison with Poisson distribution Blue bars denote a histogram of data divided into 1 sec bins. Red curve is a Poisson curve with rate = median count rate of data. |
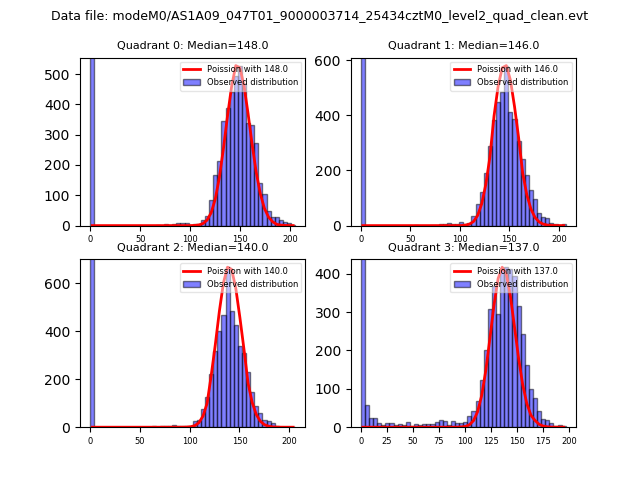 |
 |
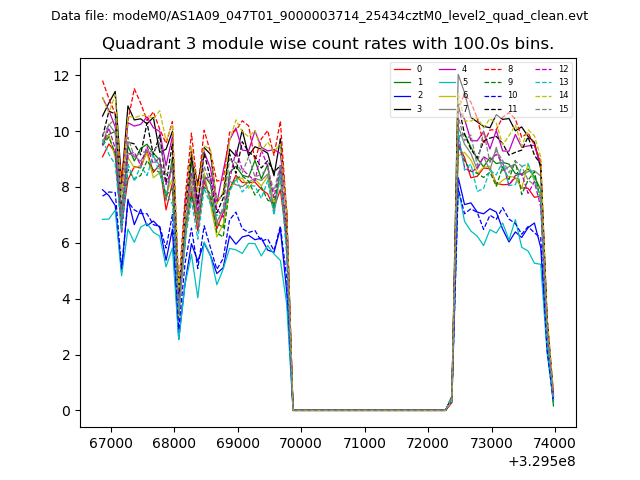
| Quadrant-wise count rates Data is divided into 100 sec bins |
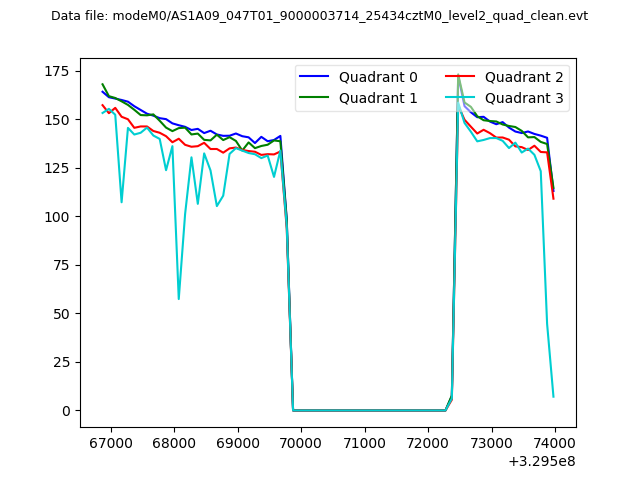 |
|
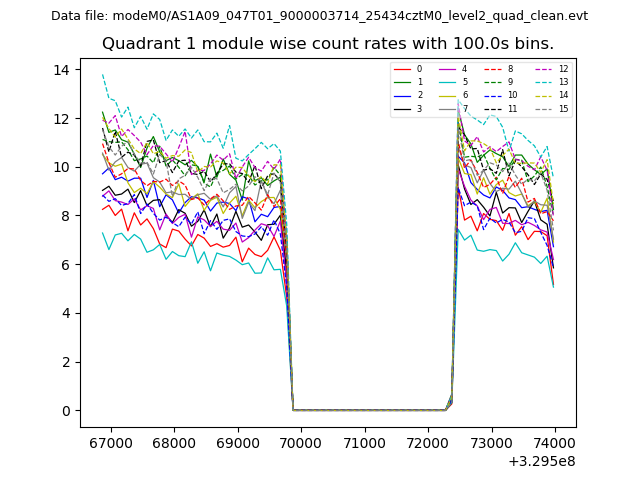
| Module-wise count rates for Quadrant A Data is divided into 100 sec bins |
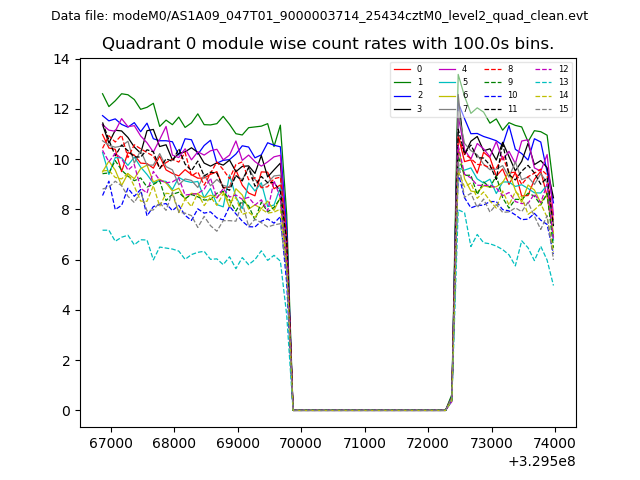 |
 |
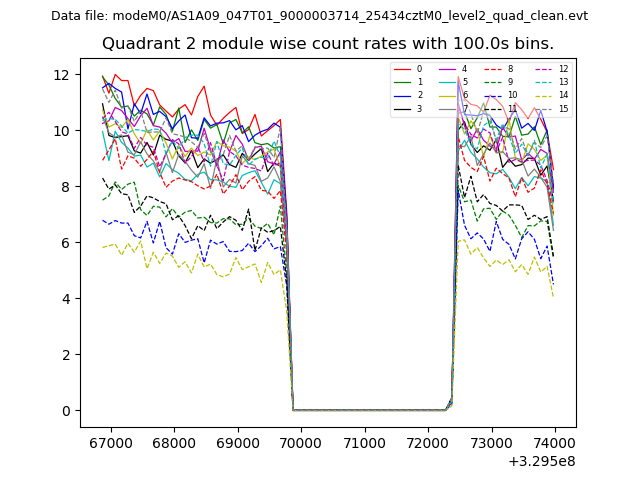
| Module-wise count rates for Quadrant B Data is divided into 100 sec bins |
 |
 |
| Module-wise count rates for Quadrant C Data is divided into 100 sec bins |
 |
 |
| Module-wise count rates for Quadrant D Data is divided into 100 sec bins |
 |
 |
| Parameter | Plot |
|---|---|
| CZT HV Monitor | 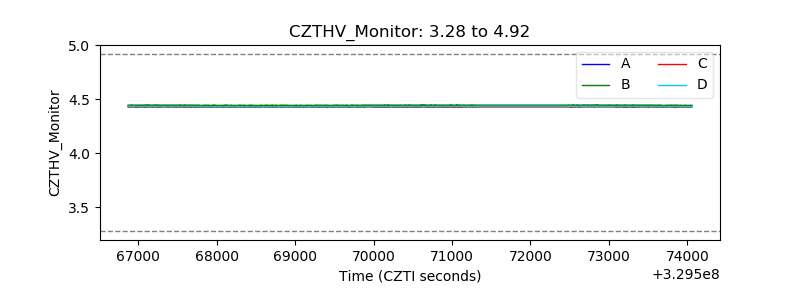 |
| D_VDD | 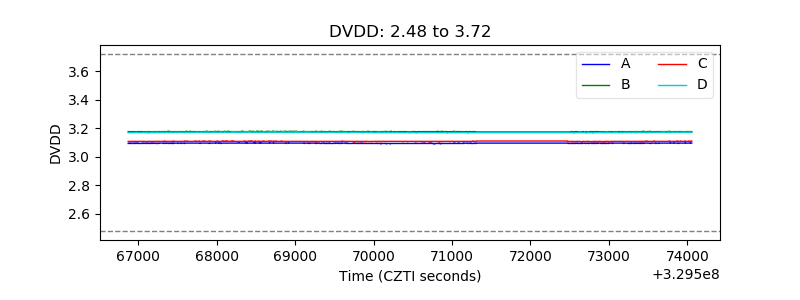 |
| Temperature 1 | 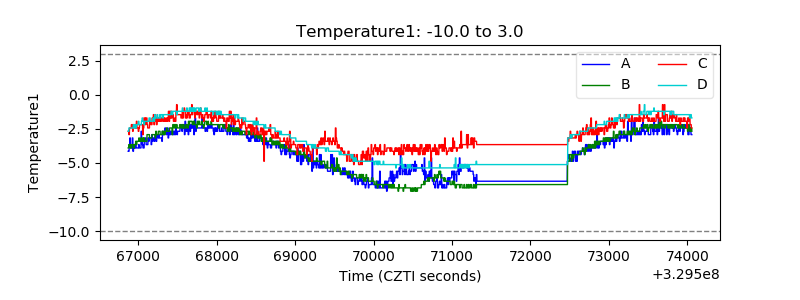 |
| Veto HV Monitor |  |
| Veto LLD | 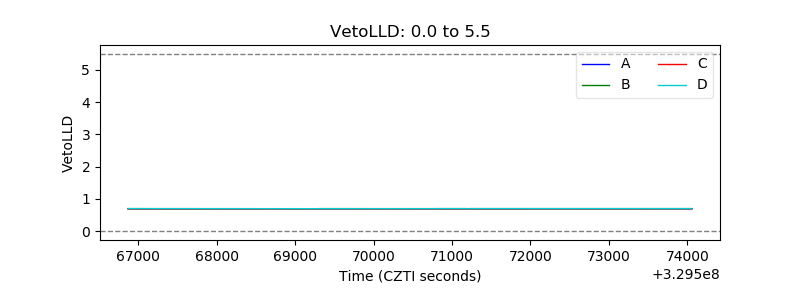 |
| Alpha Counter | 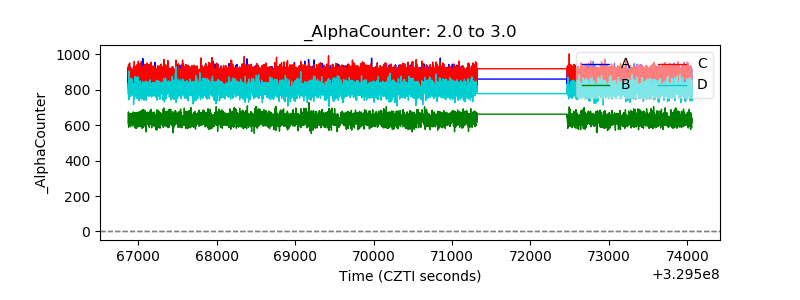 |
| _CPM_Rate | 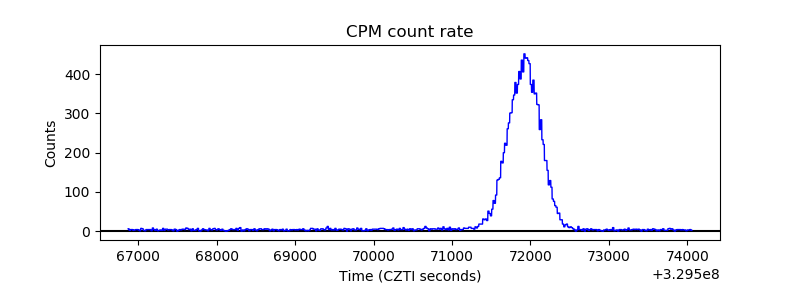 |
| CZT Counter |  |
| +2.5 Volts monitor |  |
| +5 Volts monitor |  |
| _ROLL_ROT | 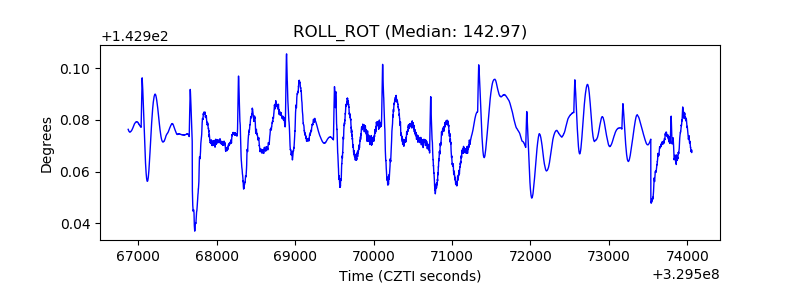 |
| _Roll_DEC | 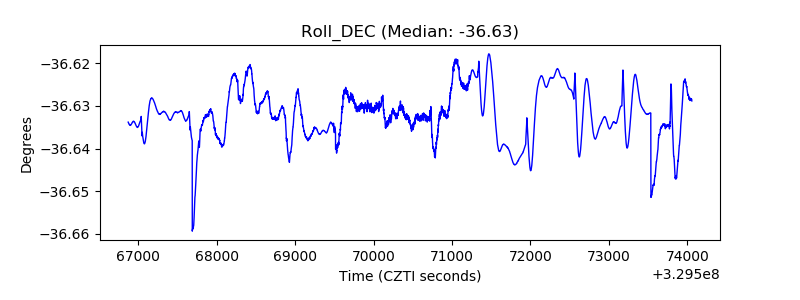 |
| _Roll_RA | 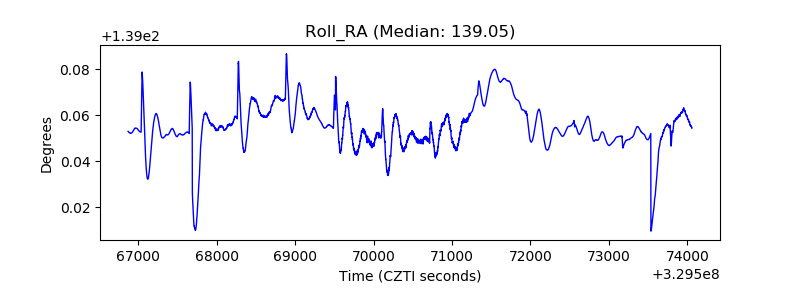 |
| Veto Counter | 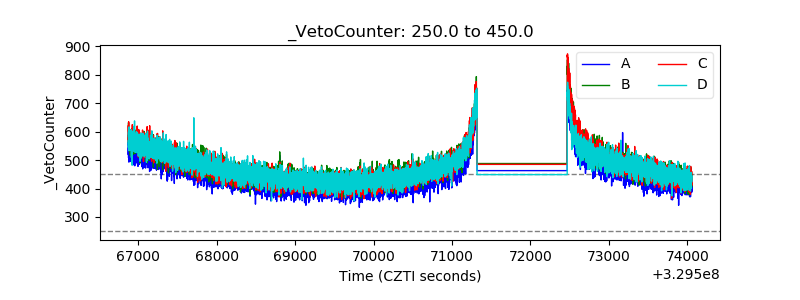 |