| Param | Original file | Final file |
|---|---|---|
| Filename | modeM0/AS1A09_047T01_9000003714_25435cztM0_level2.evt | modeM0/AS1A09_047T01_9000003714_25435cztM0_level2_quad_clean.evt |
| Size (bytes) | 627,966,720 | 91,224,000 |
| Size | 598.9 MB | 87.0 MB |
| Events in quadrant A | 3,372,964 | 641,330 |
| Events in quadrant B | 3,293,076 | 637,368 |
| Events in quadrant C | 3,298,465 | 610,892 |
| Events in quadrant D | 8,600,910 | 407,128 |
| Mode M9 | |||
|---|---|---|---|
| Quadrant | BADHDUFLAG | Total packets | Discarded packets |
| A | 0 | 8 | 0 |
| B | 0 | 8 | 0 |
| C | 0 | 8 | 0 |
| D | 0 | 8 | 0 |
| Mode M0 | |||
|---|---|---|---|
| Quadrant | BADHDUFLAG | Total packets | Discarded packets |
| A | 0 | 13945 | 0 |
| B | 0 | 13929 | 0 |
| C | 0 | 13974 | 0 |
| D | 0 | 29994 | 0 |
| Quadrant | Total seconds | Saturated seconds | Saturation percentage |
|---|---|---|---|
| A | 6666 | 84 | 1.260126% |
| B | 6667 | 85 | 1.274936% |
| C | 6667 | 121 | 1.814909% |
| D | 6667 | 2600 | 38.998050% |
Noise dominated data is calculated using 1-second bins in cleaned event files. If a bin has >2000 counts, and if more than 50% of those come from <1% of pixels, then it is considered to be noise-dominated and hence unusable.
| Quadrant | # 1 sec bins | Bins with >0 counts | Bins with >2000 counts | High rate bins dominated by noise | Noise dominated (total time) | Noise dominated (detector-on time) | Marked lightcurve |
|---|---|---|---|---|---|---|---|
| A | 7441 | 6666 | 0 | 0 | 0.00% | 0.00% | 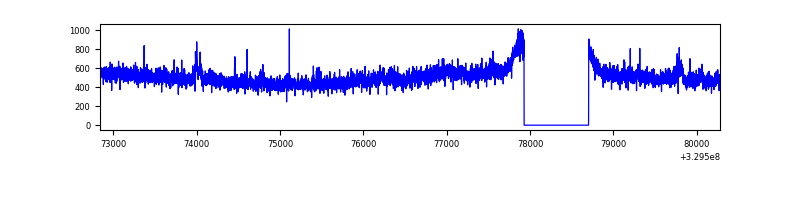 |
| B | 7442 | 6667 | 1 | 1 | 0.01% | 0.01% | 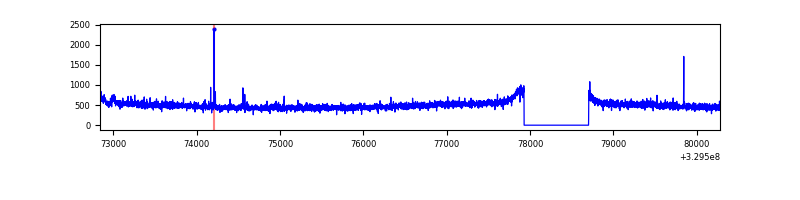 |
| C | 7442 | 6667 | 0 | 0 | 0.00% | 0.00% | 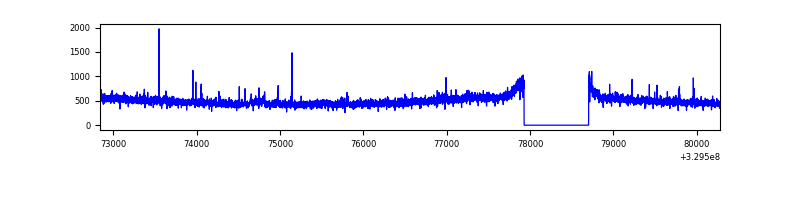 |
| D | 7441 | 6666 | 1978 | 1978 | 26.58% | 29.67% | 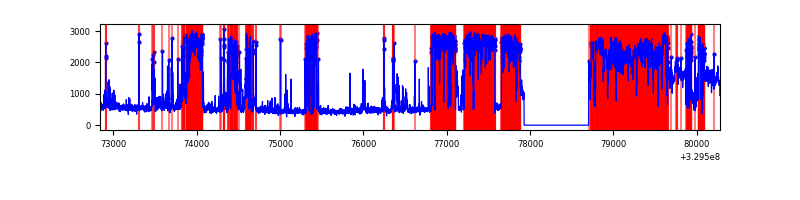 |
Top three noisy pixels from each quadrant. If the there are fewer than three noisy pixels in the level2.evt file, extra rows are filled as -1
| Pixel properties | Quadrant properties | ||||||
|---|---|---|---|---|---|---|---|
| Quadrant | DetID | PixID | Counts | Sigma | Mean | Median | Sigma |
| A | 6 | 16 | 77555 | 449.7 | 846 | 829 | 170.6 |
| A | 4 | 2 | 33382 | 190.8 | 846 | 829 | 170.6 |
| A | 13 | 254 | 10939 | 59.26 | 846 | 829 | 170.6 |
| B | 0 | 245 | 22074 | 133.84 | 826 | 806 | 158.9 |
| B | 12 | 111 | 19229 | 115.94 | 826 | 806 | 158.9 |
| B | 11 | 111 | 17383 | 104.32 | 826 | 806 | 158.9 |
| C | 14 | 238 | 129693 | 693.58 | 794 | 796 | 185.8 |
| C | 7 | 247 | 27731 | 144.93 | 794 | 796 | 185.8 |
| C | 3 | 233 | 23790 | 123.73 | 794 | 796 | 185.8 |
| D | 1 | 52 | 5491903 | 39255.06 | 575 | 558 | 139.9 |
| D | 7 | 238 | 504956 | 3605.71 | 575 | 558 | 139.9 |
| D | 12 | 233 | 177110 | 1262.09 | 575 | 558 | 139.9 |
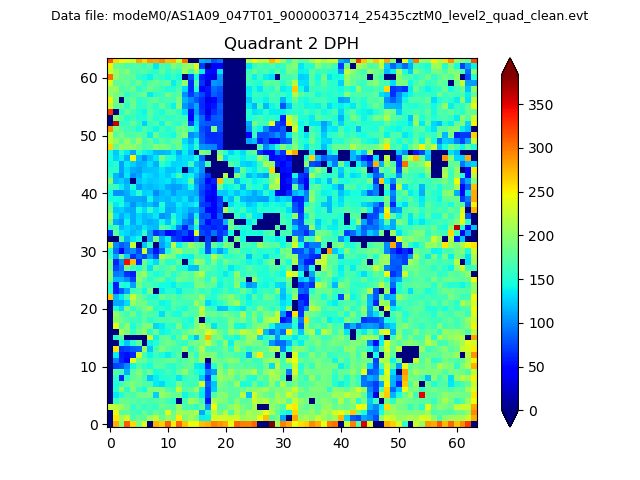
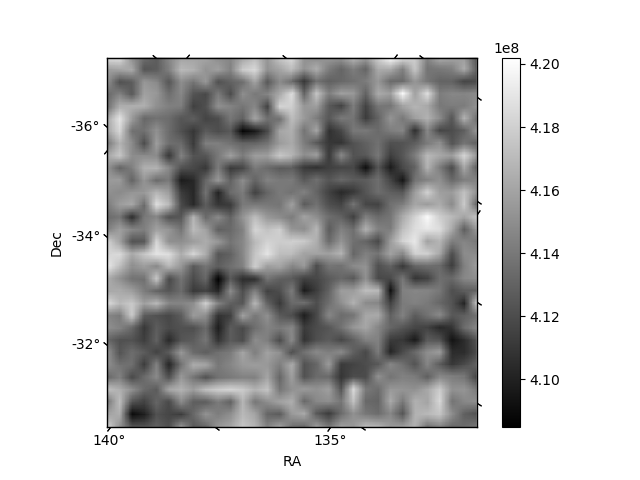
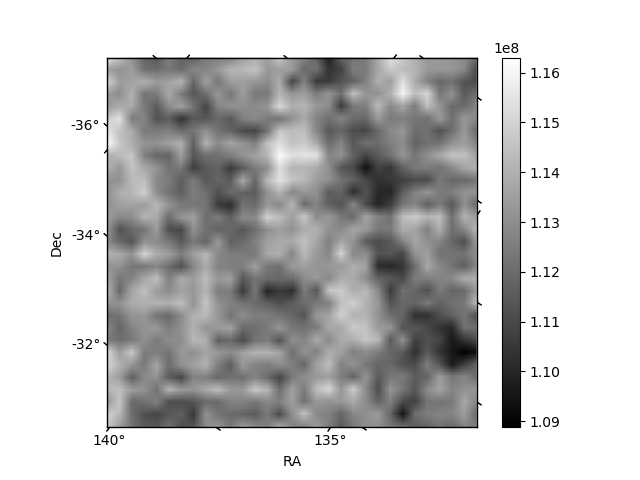
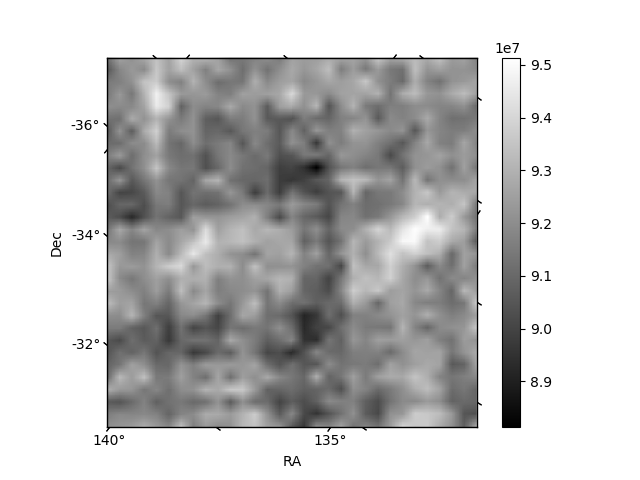
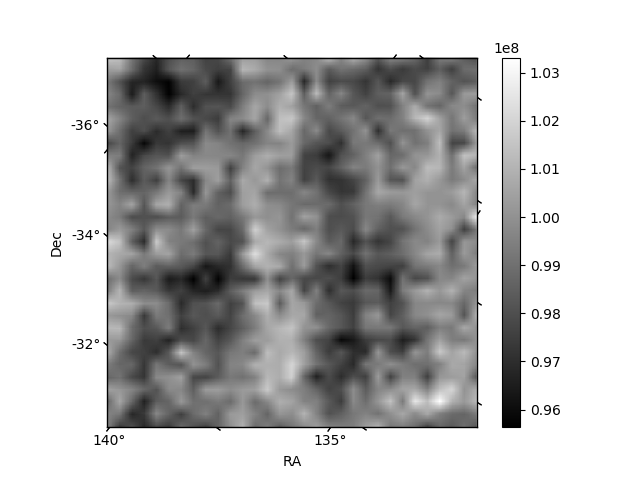
Histogram calculated using DETX and DETY for each event in the final _common_clean file
| Quadrant A | 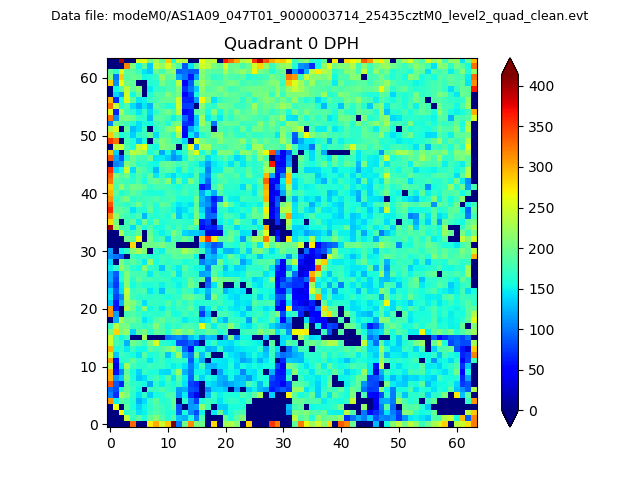 |
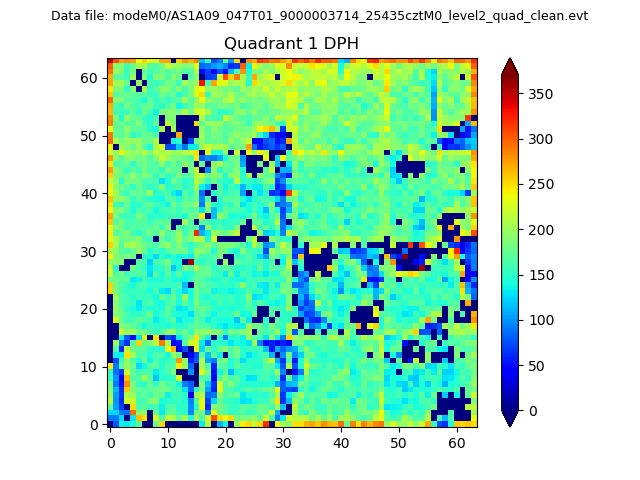 |
Quadrant B |
|---|---|---|---|
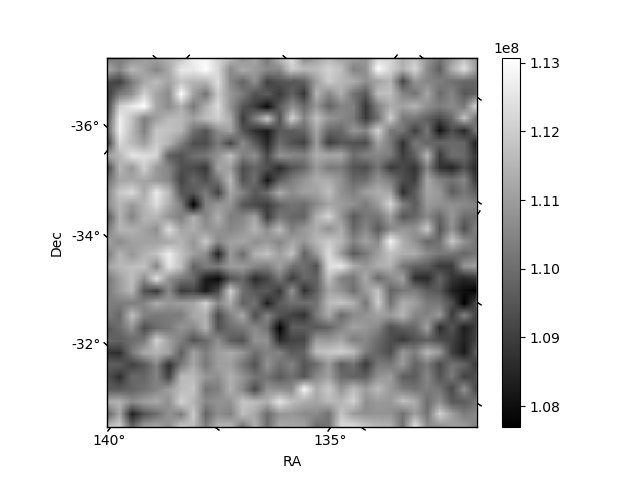
| Quadrant D | 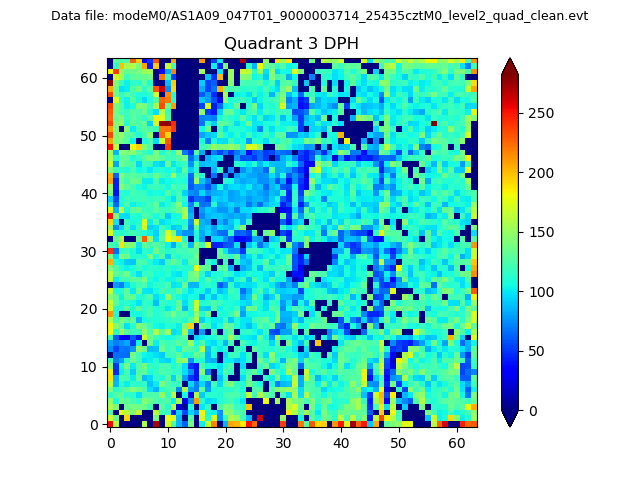 |
 |
Quadrant C |
| Plot type | Count rate plots | Images |
|---|---|---|
| Comparison with Poisson distribution Blue bars denote a histogram of data divided into 1 sec bins. Red curve is a Poisson curve with rate = median count rate of data. |
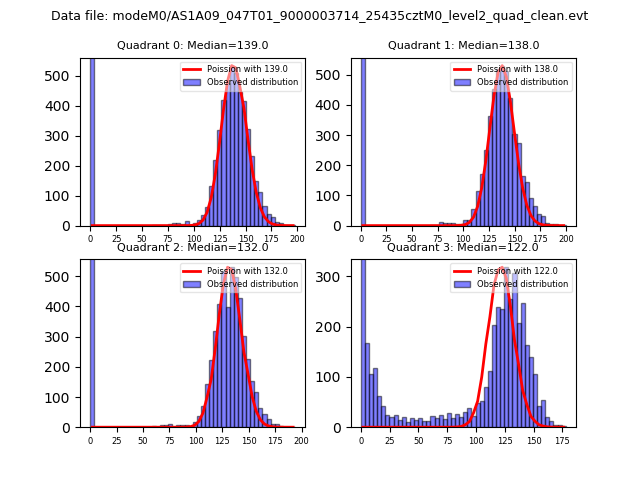 |
 |
| Quadrant-wise count rates Data is divided into 100 sec bins |
 |
|
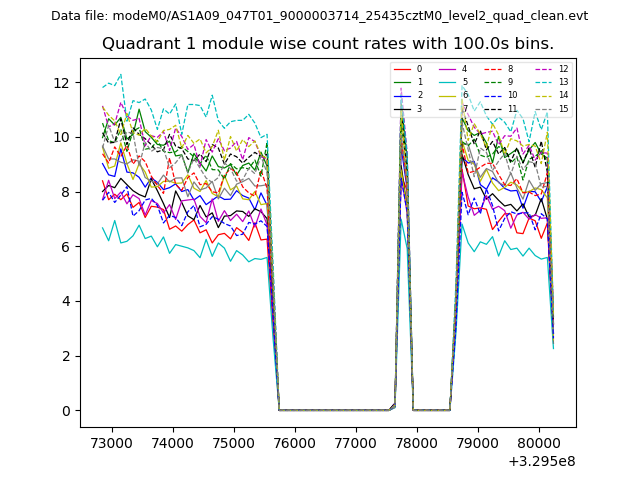
| Module-wise count rates for Quadrant A Data is divided into 100 sec bins |
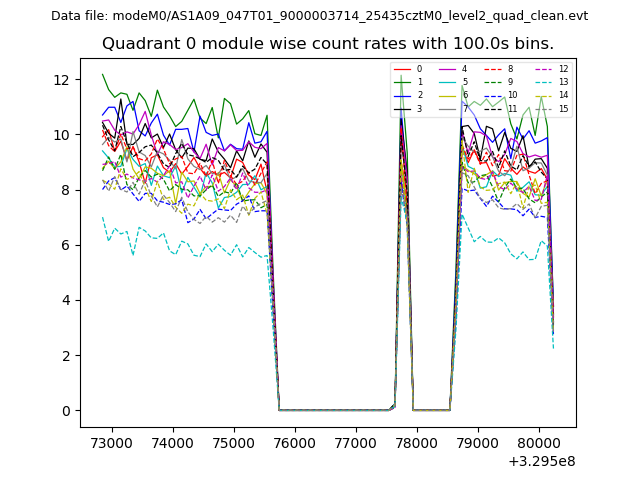 |
 |
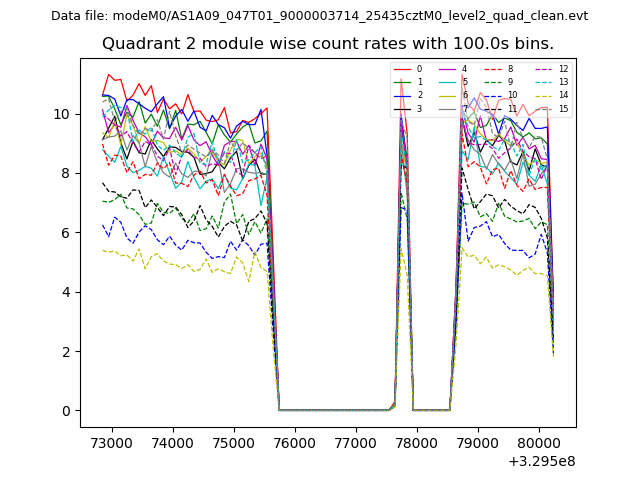
| Module-wise count rates for Quadrant B Data is divided into 100 sec bins |
 |
 |
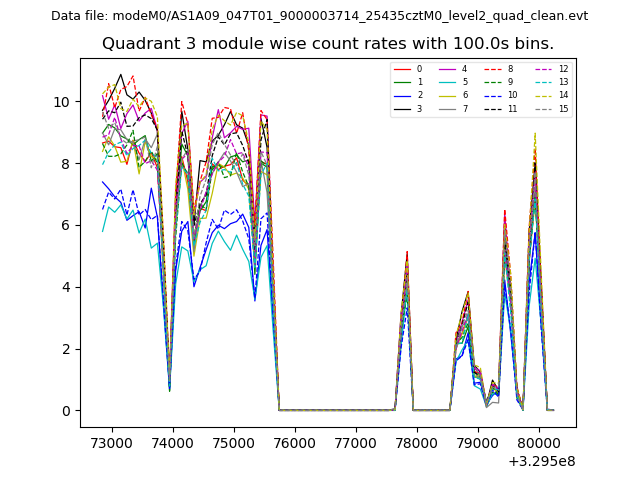
| Module-wise count rates for Quadrant C Data is divided into 100 sec bins |
 |
 |
| Module-wise count rates for Quadrant D Data is divided into 100 sec bins |
 |
 |
| Parameter | Plot |
|---|---|
| CZT HV Monitor | 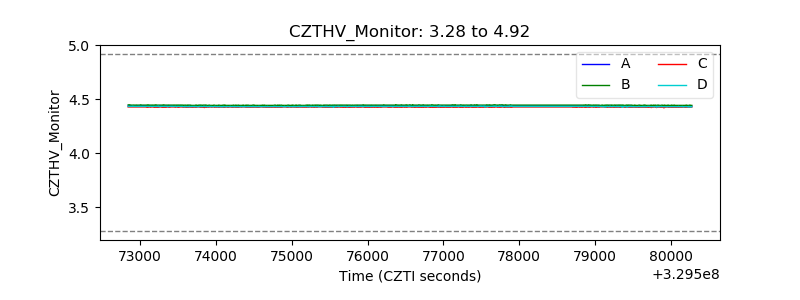 |
| D_VDD | 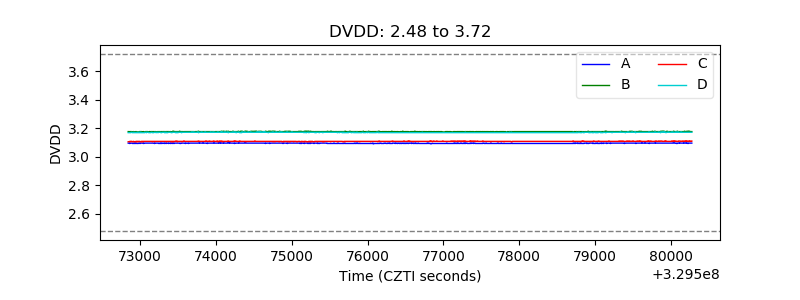 |
| Temperature 1 | 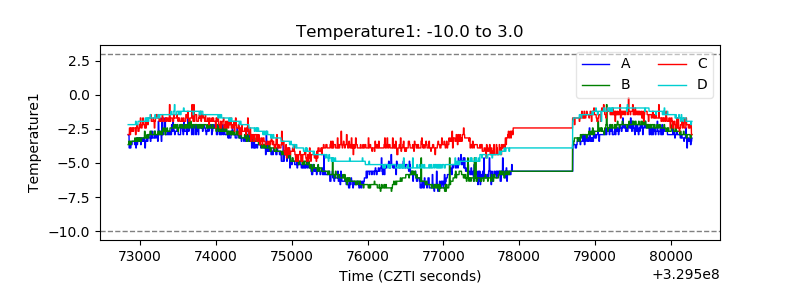 |
| Veto HV Monitor | 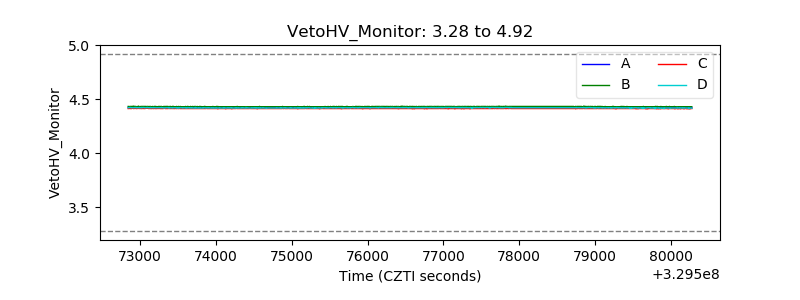 |
| Veto LLD | 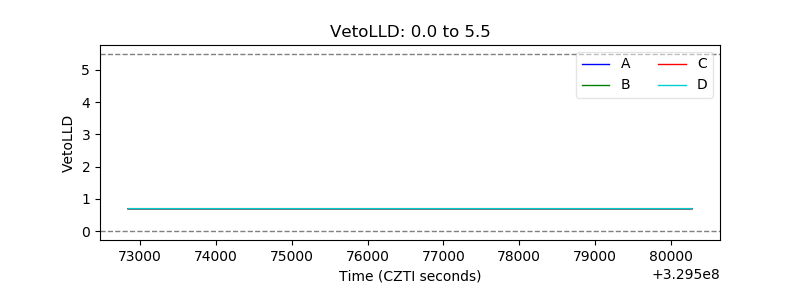 |
| Alpha Counter |  |
| _CPM_Rate |  |
| CZT Counter | 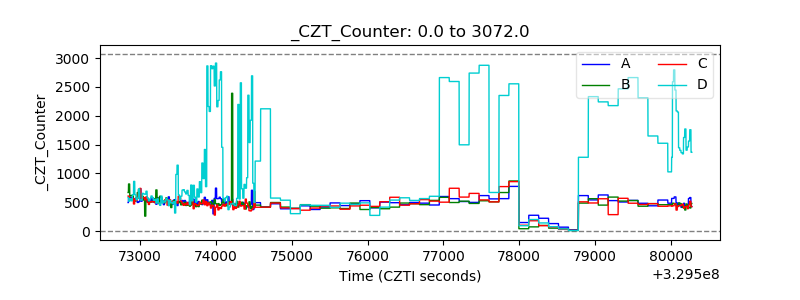 |
| +2.5 Volts monitor |  |
| +5 Volts monitor |  |
| _ROLL_ROT | 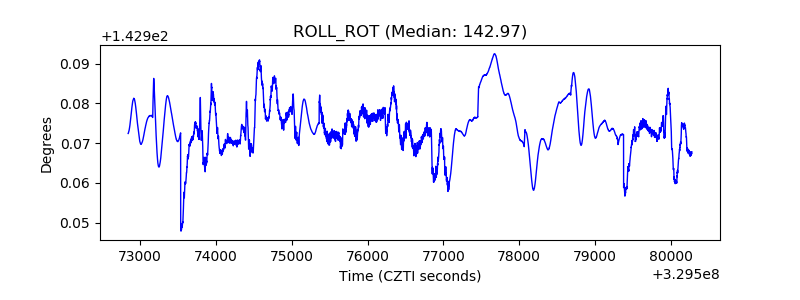 |
| _Roll_DEC | 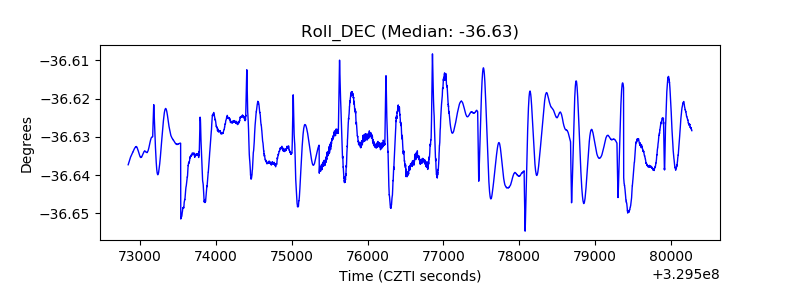 |
| _Roll_RA | 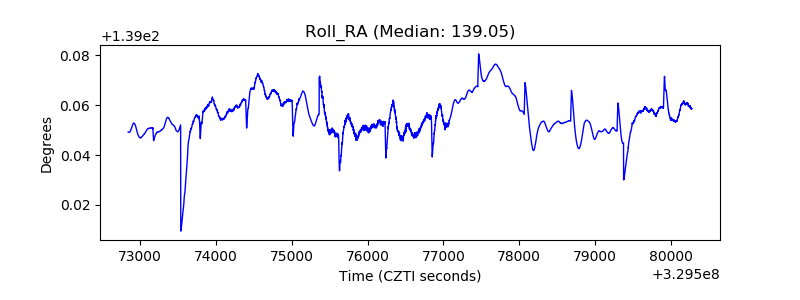 |
| Veto Counter | 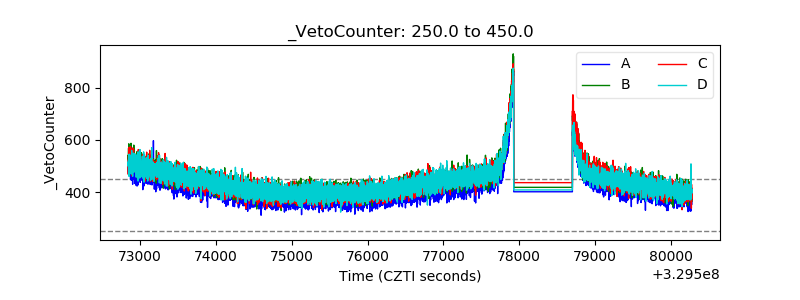 |