| Param | Original file | Final file |
|---|---|---|
| Filename | modeM0/AS1A09_047T01_9000003714_25437cztM0_level2.evt | modeM0/AS1A09_047T01_9000003714_25437cztM0_level2_quad_clean.evt |
| Size (bytes) | 145,915,200 | 23,788,800 |
| Size | 139.2 MB | 22.7 MB |
| Events in quadrant A | 607,885 | 173,741 |
| Events in quadrant B | 609,965 | 172,334 |
| Events in quadrant C | 589,696 | 164,934 |
| Events in quadrant D | 2,516,849 | 107,462 |
| Mode M0 | |||
|---|---|---|---|
| Quadrant | BADHDUFLAG | Total packets | Discarded packets |
| A | 0 | 2708 | 0 |
| B | 0 | 2724 | 0 |
| C | 0 | 2708 | 0 |
| D | 0 | 8419 | 0 |
| Quadrant | Total seconds | Saturated seconds | Saturation percentage |
|---|---|---|---|
| A | 1350 | 0 | 0.000000% |
| B | 1351 | 0 | 0.000000% |
| C | 1351 | 1 | 0.074019% |
| D | 1351 | 652 | 48.260548% |
Noise dominated data is calculated using 1-second bins in cleaned event files. If a bin has >2000 counts, and if more than 50% of those come from <1% of pixels, then it is considered to be noise-dominated and hence unusable.
| Quadrant | # 1 sec bins | Bins with >0 counts | Bins with >2000 counts | High rate bins dominated by noise | Noise dominated (total time) | Noise dominated (detector-on time) | Marked lightcurve |
|---|---|---|---|---|---|---|---|
| A | 1350 | 1350 | 0 | 0 | 0.00% | 0.00% | 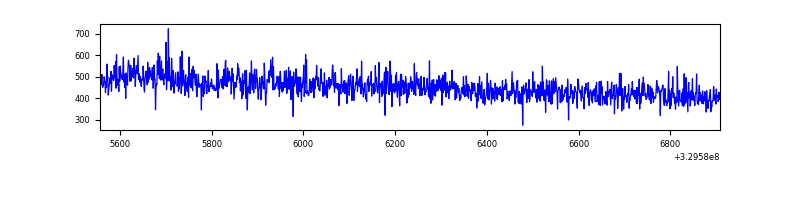 |
| B | 1351 | 1351 | 0 | 0 | 0.00% | 0.00% | 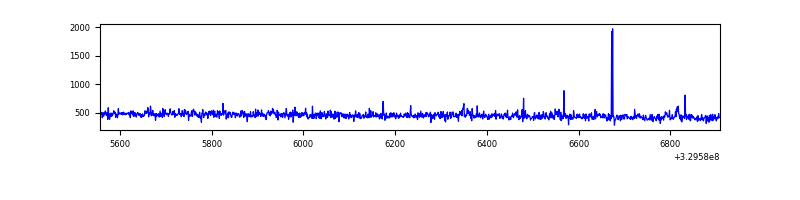 |
| C | 1351 | 1351 | 0 | 0 | 0.00% | 0.00% | 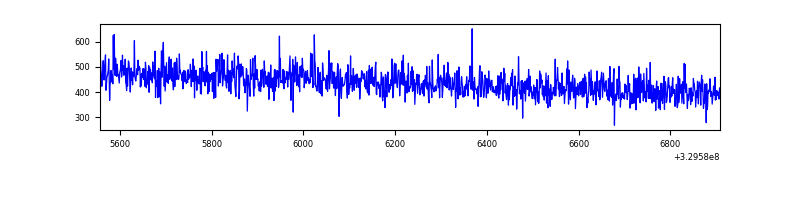 |
| D | 1351 | 1351 | 711 | 711 | 52.63% | 52.63% | 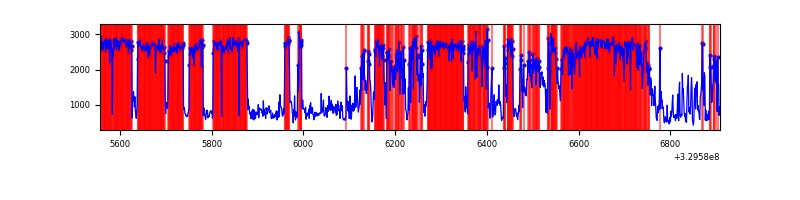 |
Top three noisy pixels from each quadrant. If the there are fewer than three noisy pixels in the level2.evt file, extra rows are filled as -1
| Pixel properties | Quadrant properties | ||||||
|---|---|---|---|---|---|---|---|
| Quadrant | DetID | PixID | Counts | Sigma | Mean | Median | Sigma |
| A | 6 | 16 | 6480 | 188.39 | 155 | 151 | 33.6 |
| A | 13 | 254 | 2256 | 62.66 | 155 | 151 | 33.6 |
| A | 3 | 137 | 1392 | 36.94 | 155 | 151 | 33.6 |
| B | 0 | 229 | 6554 | 205.84 | 152 | 148 | 31.1 |
| B | 0 | 190 | 3605 | 111.08 | 152 | 148 | 31.1 |
| B | 12 | 111 | 3398 | 104.43 | 152 | 148 | 31.1 |
| C | 14 | 238 | 23205 | 647.81 | 144 | 144 | 35.6 |
| C | 8 | 128 | 2236 | 58.77 | 144 | 144 | 35.6 |
| C | 8 | 112 | 1422 | 35.9 | 144 | 144 | 35.6 |
| D | 1 | 52 | 859079 | 32168.66 | 102 | 99 | 26.7 |
| D | 7 | 238 | 735043 | 27523.53 | 102 | 99 | 26.7 |
| D | 12 | 233 | 361739 | 13543.36 | 102 | 99 | 26.7 |
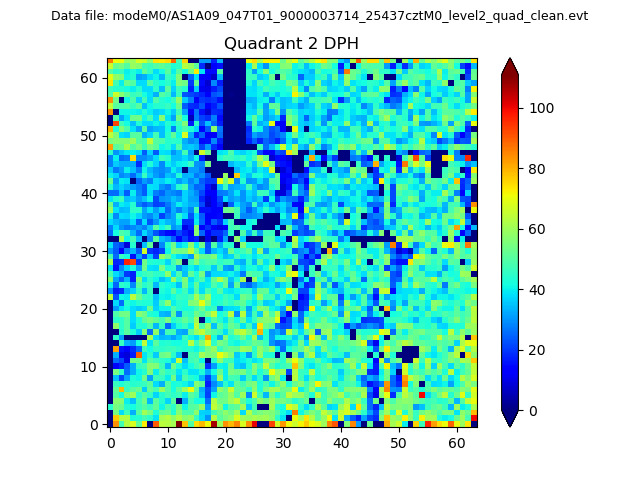
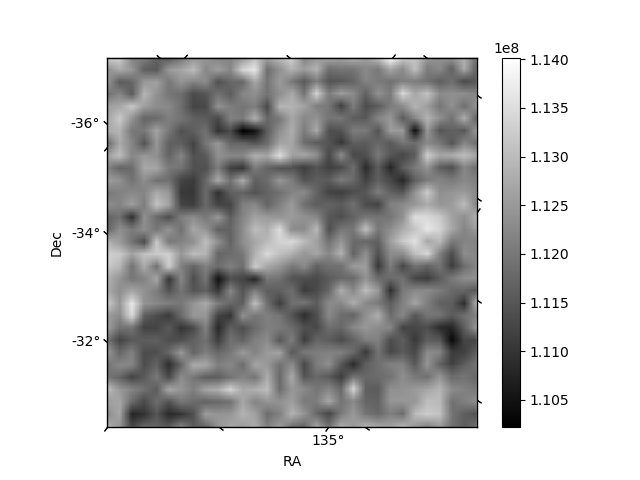
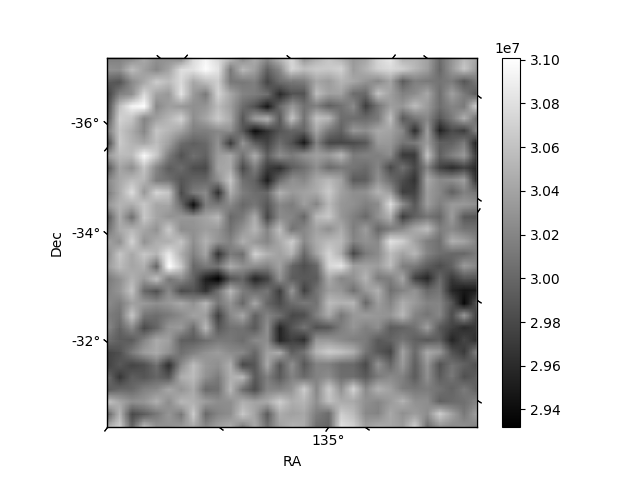
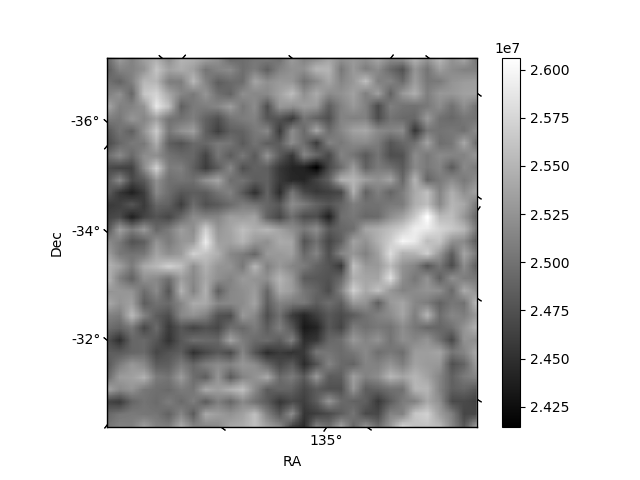
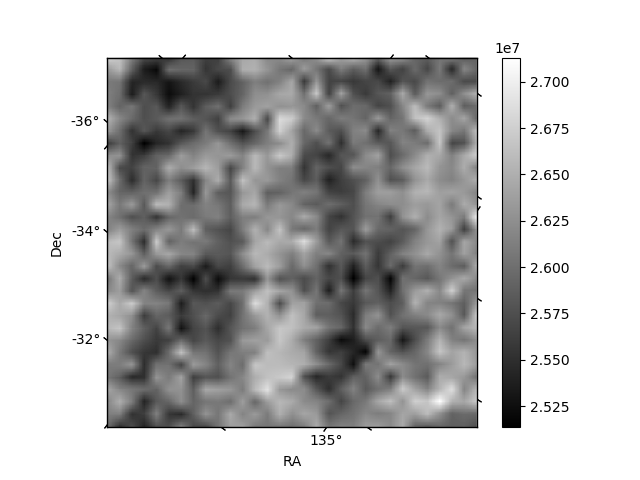
Histogram calculated using DETX and DETY for each event in the final _common_clean file
| Quadrant A | 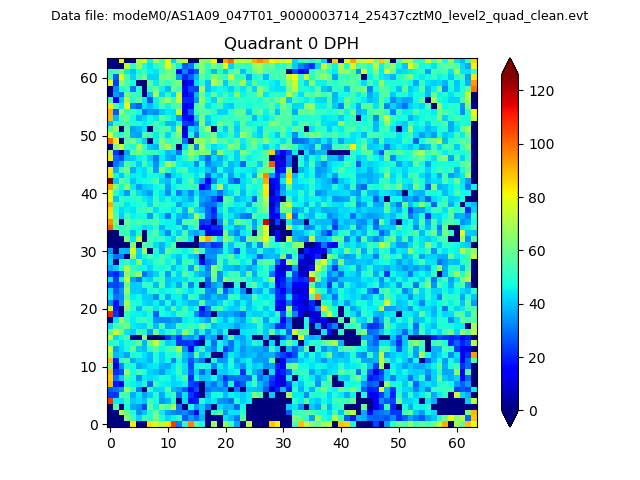 |
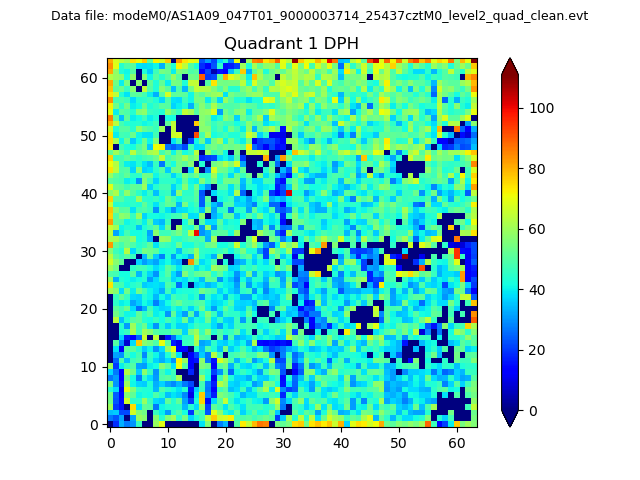 |
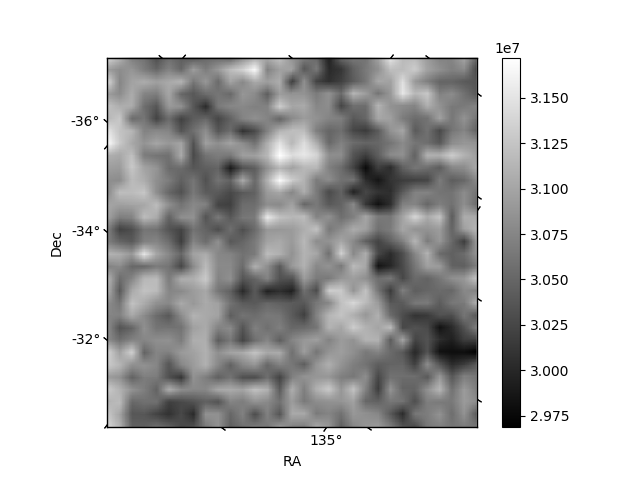
Quadrant B |
|---|---|---|---|
| Quadrant D | 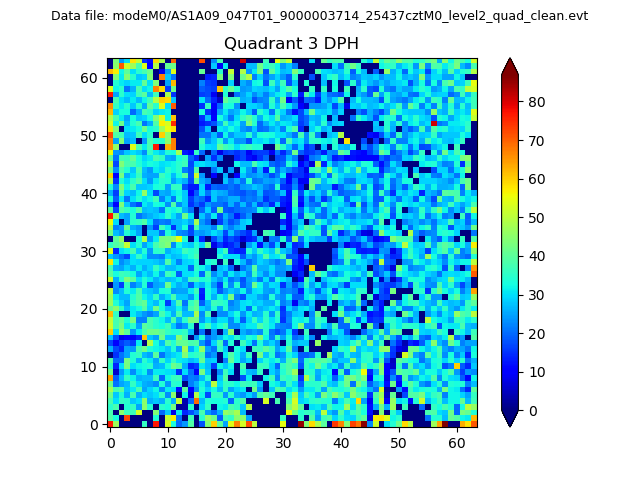 |
 |
Quadrant C |
| Plot type | Count rate plots | Images |
|---|---|---|
| Comparison with Poisson distribution Blue bars denote a histogram of data divided into 1 sec bins. Red curve is a Poisson curve with rate = median count rate of data. |
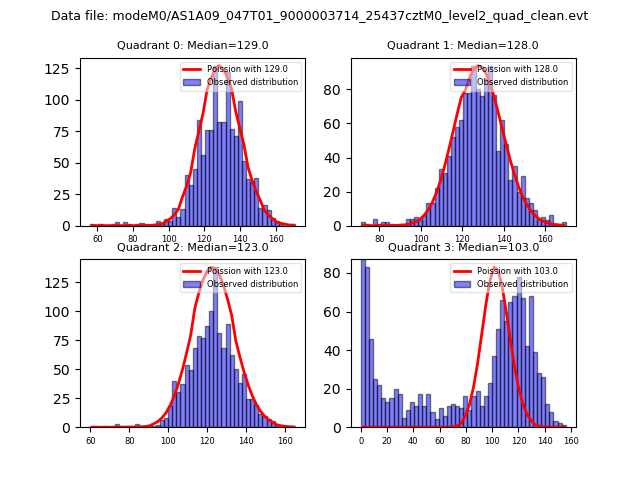 |
 |
| Quadrant-wise count rates Data is divided into 100 sec bins |
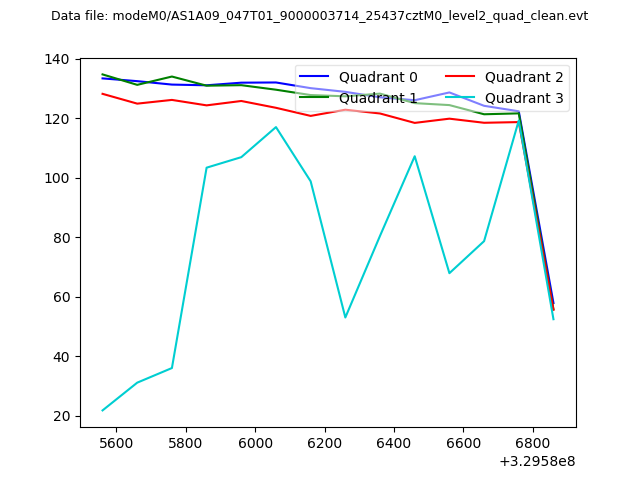 |
|
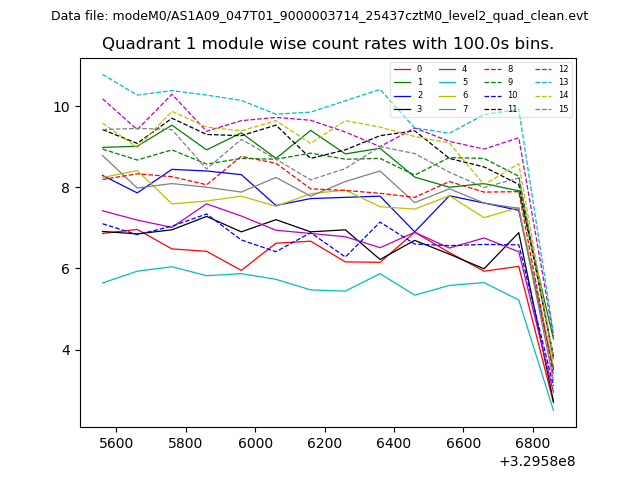
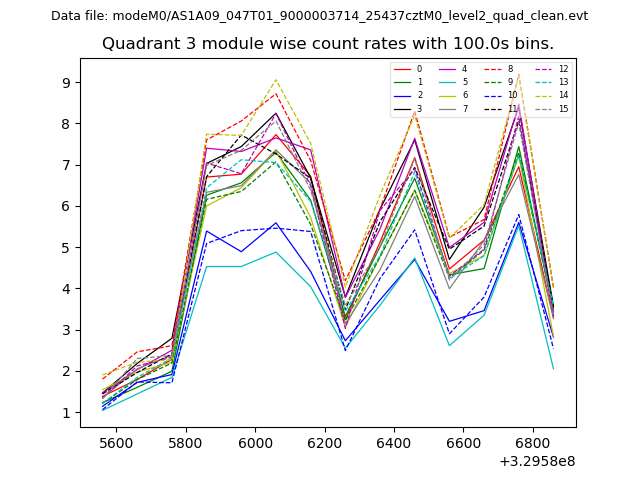
| Module-wise count rates for Quadrant A Data is divided into 100 sec bins |
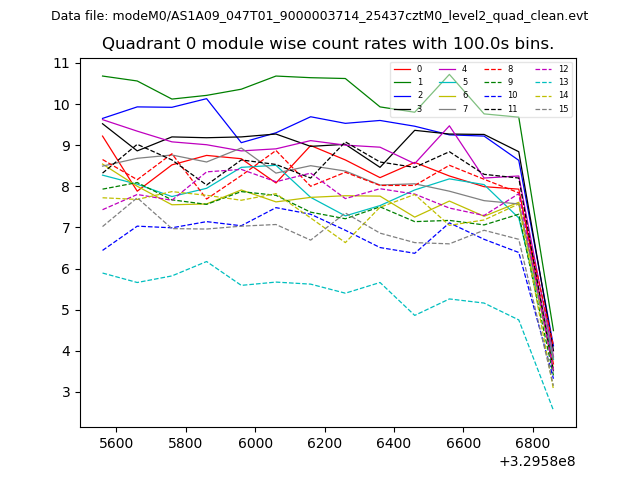 |
 |
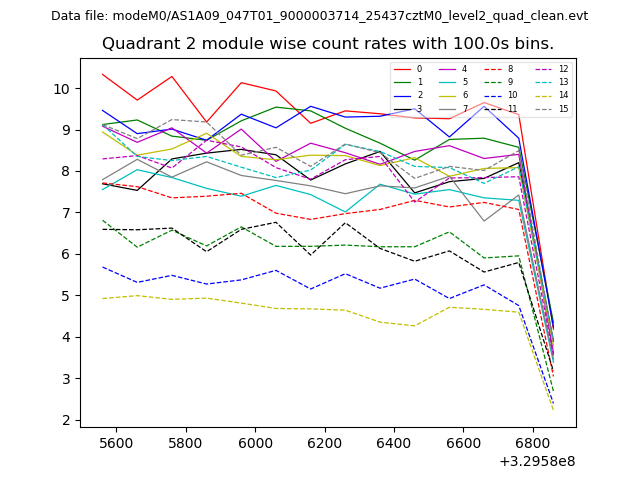
| Module-wise count rates for Quadrant B Data is divided into 100 sec bins |
 |
 |
| Module-wise count rates for Quadrant C Data is divided into 100 sec bins |
 |
 |
| Module-wise count rates for Quadrant D Data is divided into 100 sec bins |
 |
 |
| Parameter | Plot |
|---|---|
| CZT HV Monitor | 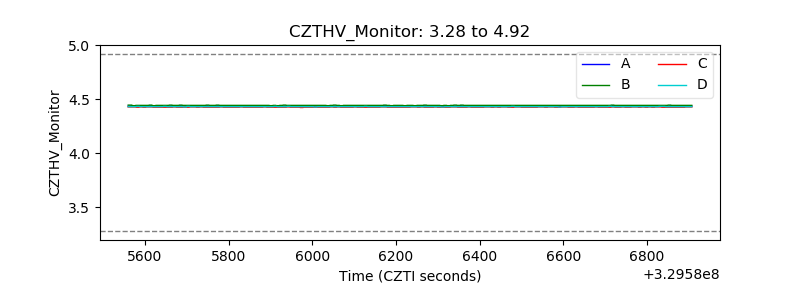 |
| D_VDD | 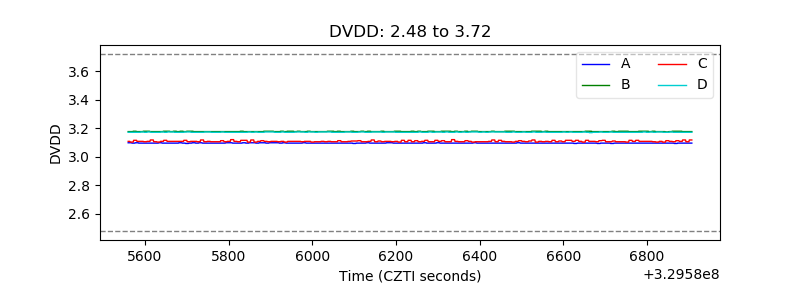 |
| Temperature 1 | 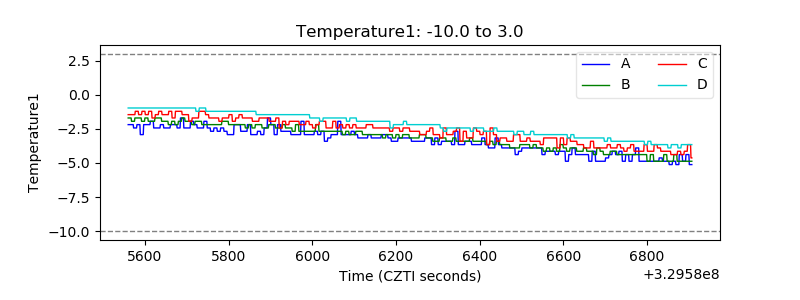 |
| Veto HV Monitor | 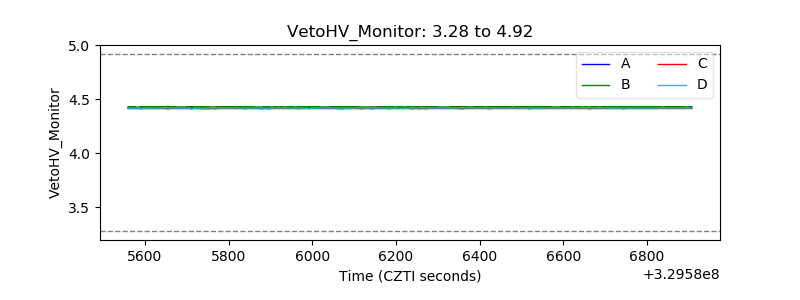 |
| Veto LLD | 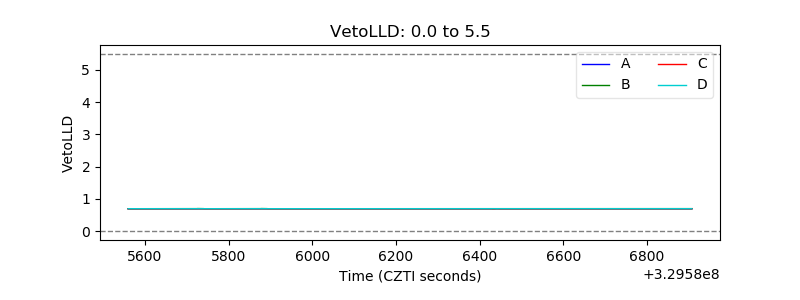 |
| Alpha Counter | 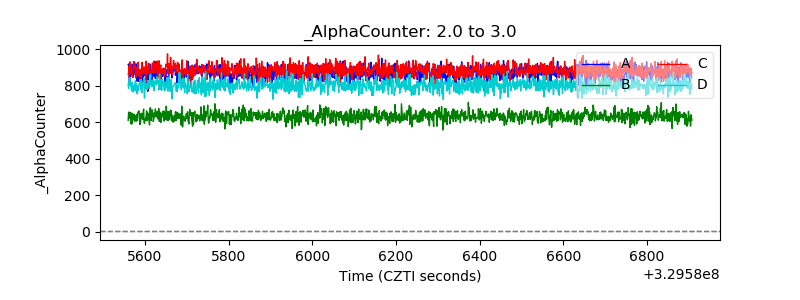 |
| _CPM_Rate | 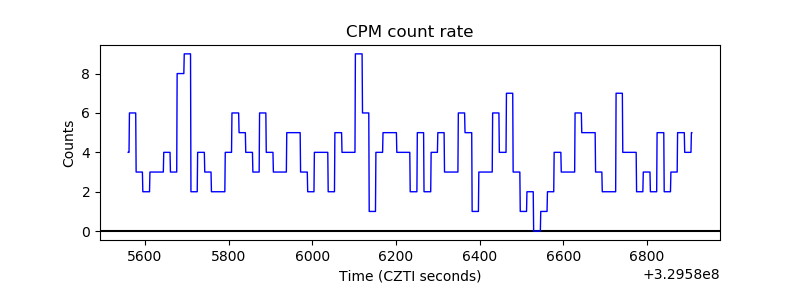 |
| CZT Counter | 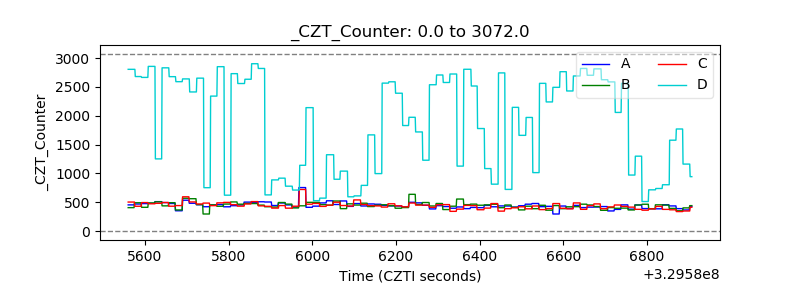 |
| +2.5 Volts monitor | 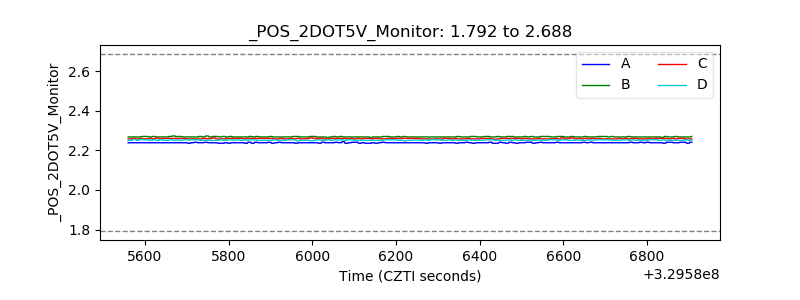 |
| +5 Volts monitor | 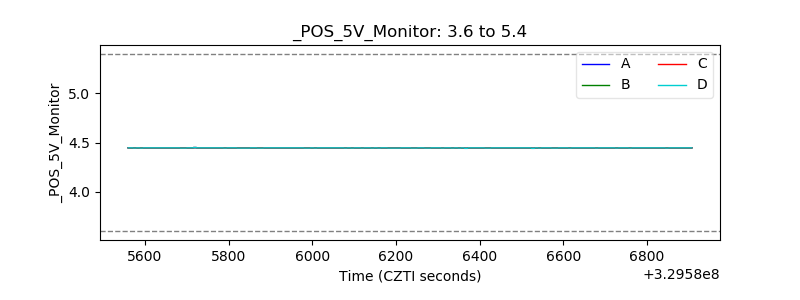 |
| _ROLL_ROT | 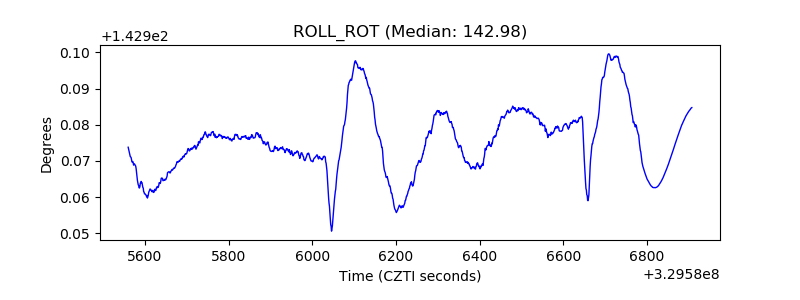 |
| _Roll_DEC | 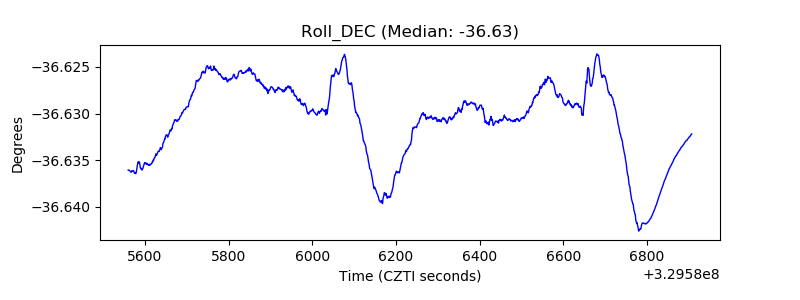 |
| _Roll_RA | 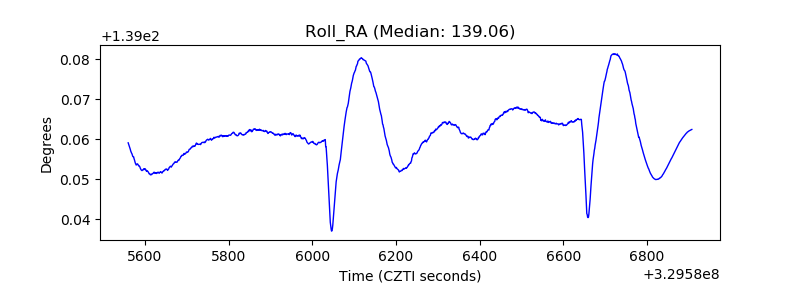 |
| Veto Counter | 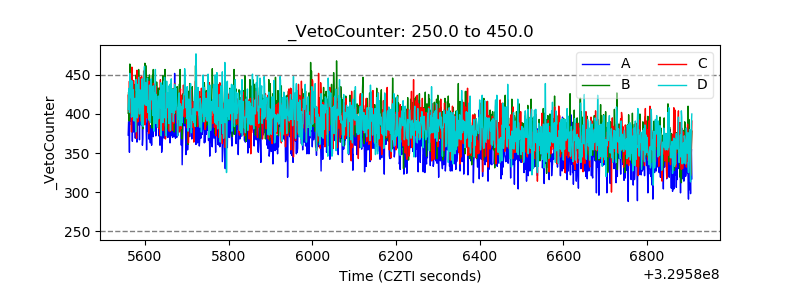 |