| Param | Original file | Final file |
|---|---|---|
| Filename | modeM0/AS1A09_085T02_9000003716cztM0_level2.fits | modeM0/AS1A09_085T02_9000003716cztM0_level2_quad_clean.evt |
| Size (bytes) | 2,047,593,600 | 1,620,146,880 |
| Size | 1.9 GB | 1.5 GB |
| Events in quadrant A | 12,900,864 | 9,375,660 |
| Events in quadrant B | 12,258,550 | 9,308,949 |
| Events in quadrant C | 12,429,304 | 8,827,240 |
| Events in quadrant D | 10,676,528 | 7,806,700 |
| Mode M9 | |||
|---|---|---|---|
| Quadrant | BADHDUFLAG | Total packets | Discarded packets |
| A | 0 | 328 | 0 |
| B | 0 | 328 | 0 |
| C | 0 | 328 | 0 |
| D | 0 | 328 | 0 |
| Mode M0 | |||
|---|---|---|---|
| Quadrant | BADHDUFLAG | Total packets | Discarded packets |
| A | 0 | 437276 | 0 |
| B | 0 | 423439 | 0 |
| C | 0 | 442905 | 0 |
| D | 0 | 576838 | 0 |
| Mode SS | |||
|---|---|---|---|
| Quadrant | BADHDUFLAG | Total packets | Discarded packets |
| A | 0 | 4088 | 0 |
| B | 0 | 4088 | 0 |
| C | 0 | 4088 | 0 |
| D | 0 | 4088 | 0 |
| Quadrant | Total seconds | Saturated seconds | Saturation percentage |
|---|---|---|---|
| A | 200633 | 2026 | 1.009804% |
| B | 200633 | 2424 | 1.208176% |
| C | 200633 | 4588 | 2.286762% |
| D | 200633 | 13571 | 6.764092% |
Noise dominated data is calculated using 1-second bins in cleaned event files. If a bin has >2000 counts, and if more than 50% of those come from <1% of pixels, then it is considered to be noise-dominated and hence unusable.
| Quadrant | # 1 sec bins | Bins with >0 counts | Bins with >2000 counts | High rate bins dominated by noise | Noise dominated (total time) | Noise dominated (detector-on time) | Marked lightcurve |
|---|---|---|---|---|---|---|---|
| A | 233418 | 200625 | 0 | 0 | 0.00% | 0.00% |  |
| B | 233418 | 200624 | 0 | 0 | 0.00% | 0.00% |  |
| C | 233418 | 200605 | 0 | 0 | 0.00% | 0.00% |  |
| D | 233418 | 199401 | 0 | 0 | 0.00% | 0.00% |  |
Top three noisy pixels from each quadrant. If the there are fewer than three noisy pixels in the level2.evt file, extra rows are filled as -1
| Pixel properties | Quadrant properties | ||||||
|---|---|---|---|---|---|---|---|
| Quadrant | DetID | PixID | Counts | Sigma | Mean | Median | Sigma |
| A | 0 | 29 | 12380 | 11.32 | 3363 | 3162 | 814.3 |
| A | 7 | 110 | 10238 | 8.69 | 3363 | 3162 | 814.3 |
| A | 0 | 30 | 9636 | 7.95 | 3363 | 3162 | 814.3 |
| B | 2 | 9 | 9762 | 10.8 | 3231 | 3091 | 617.5 |
| B | 2 | 8 | 8084 | 8.09 | 3231 | 3091 | 617.5 |
| B | 5 | 128 | 7973 | 7.91 | 3231 | 3091 | 617.5 |
| C | 1 | 81 | 9542 | 7.89 | 3282 | 3083 | 818.8 |
| C | 1 | 80 | 9512 | 7.85 | 3282 | 3083 | 818.8 |
| C | 9 | 209 | 8325 | 6.4 | 3282 | 3083 | 818.8 |
| D | 10 | 189 | 7532 | 5.9 | 3049 | 2785 | 804.2 |
| D | 6 | 231 | 7495 | 5.86 | 3049 | 2785 | 804.2 |
| D | 3 | 14 | 7331 | 5.65 | 3049 | 2785 | 804.2 |
Histogram calculated using DETX and DETY for each event in the final _common_clean file
| Quadrant A |  |
 |
Quadrant B |
|---|---|---|---|
| Quadrant D | 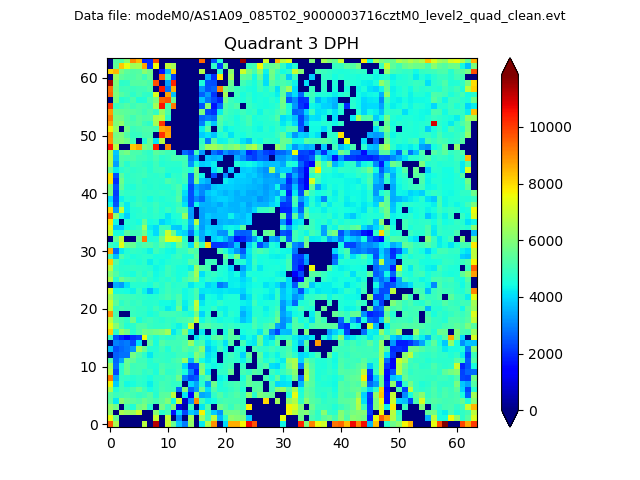 |
 |
Quadrant C |
| Plot type | Count rate plots | Images |
|---|---|---|
| Comparison with Poisson distribution Blue bars denote a histogram of data divided into 1 sec bins. Red curve is a Poisson curve with rate = median count rate of data. |
 |
 |
| Quadrant-wise count rates Data is divided into 100 sec bins |
 |
|
| Module-wise count rates for Quadrant A Data is divided into 100 sec bins |
 |
 |
| Module-wise count rates for Quadrant B Data is divided into 100 sec bins |
 |
 |
| Module-wise count rates for Quadrant C Data is divided into 100 sec bins |
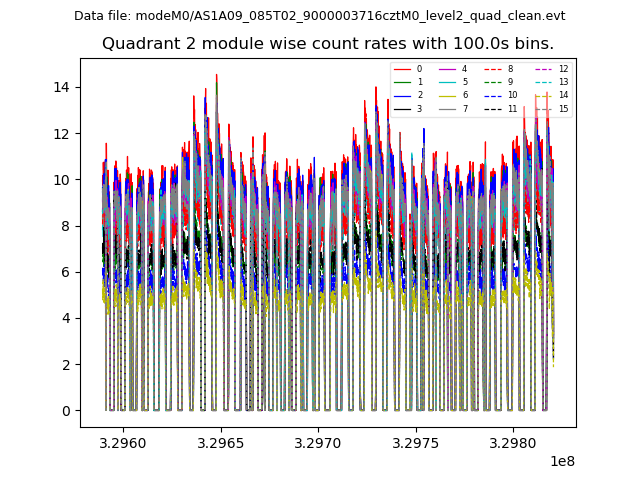 |
 |
| Module-wise count rates for Quadrant D Data is divided into 100 sec bins |
 |
 |
| Parameter | Plot |
|---|---|
| CZT HV Monitor |  |
| D_VDD |  |
| Temperature 1 |  |
| Veto HV Monitor |  |
| Veto LLD |  |
| Alpha Counter |  |
| _CPM_Rate |  |
| CZT Counter |  |
| +2.5 Volts monitor |  |
| +5 Volts monitor |  |
| _ROLL_ROT |  |
| _Roll_DEC | 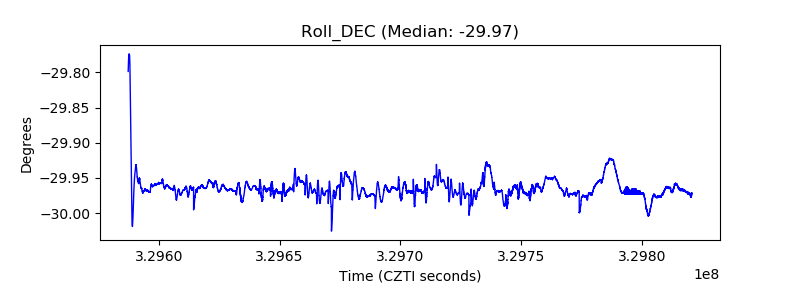 |
| _Roll_RA | 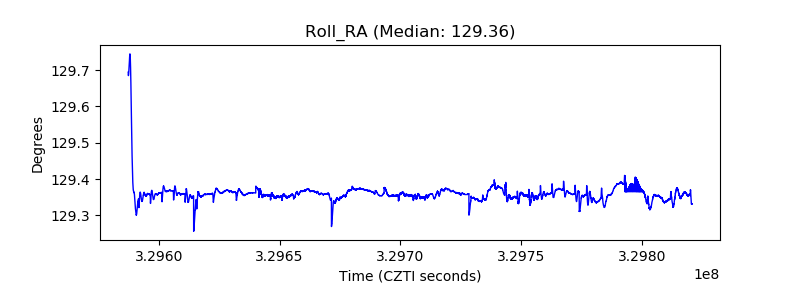 |
| Veto Counter |  |