| Param | Original file | Final file |
|---|---|---|
| Filename | modeM0/AS1A09_085T02_9000003716_25437cztM0_level2.evt | modeM0/AS1A09_085T02_9000003716_25437cztM0_level2_quad_clean.evt |
| Size (bytes) | 409,743,360 | 67,970,880 |
| Size | 390.8 MB | 64.8 MB |
| Events in quadrant A | 2,571,459 | 436,638 |
| Events in quadrant B | 2,570,124 | 437,916 |
| Events in quadrant C | 2,589,617 | 417,672 |
| Events in quadrant D | 4,324,177 | 401,151 |
| Mode M9 | |||
|---|---|---|---|
| Quadrant | BADHDUFLAG | Total packets | Discarded packets |
| A | 0 | 3 | 0 |
| B | 0 | 3 | 0 |
| C | 0 | 3 | 0 |
| D | 0 | 3 | 0 |
| Mode M0 | |||
|---|---|---|---|
| Quadrant | BADHDUFLAG | Total packets | Discarded packets |
| A | 0 | 10783 | 0 |
| B | 0 | 10859 | 0 |
| C | 0 | 11022 | 0 |
| D | 0 | 16444 | 0 |
| Quadrant | Total seconds | Saturated seconds | Saturation percentage |
|---|---|---|---|
| A | 5212 | 58 | 1.112817% |
| B | 5212 | 88 | 1.688411% |
| C | 5212 | 89 | 1.707598% |
| D | 5212 | 308 | 5.909440% |
Noise dominated data is calculated using 1-second bins in cleaned event files. If a bin has >2000 counts, and if more than 50% of those come from <1% of pixels, then it is considered to be noise-dominated and hence unusable.
| Quadrant | # 1 sec bins | Bins with >0 counts | Bins with >2000 counts | High rate bins dominated by noise | Noise dominated (total time) | Noise dominated (detector-on time) | Marked lightcurve |
|---|---|---|---|---|---|---|---|
| A | 5442 | 5214 | 0 | 0 | 0.00% | 0.00% | 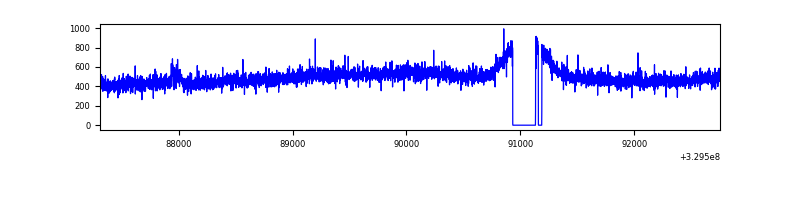 |
| B | 5442 | 5212 | 0 | 0 | 0.00% | 0.00% | 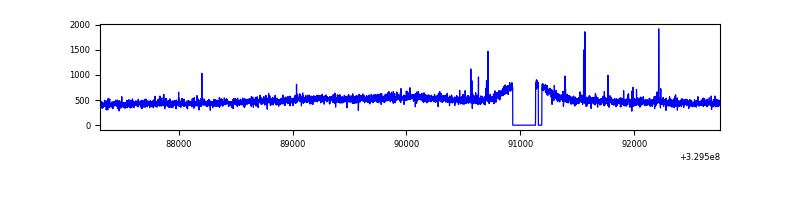 |
| C | 5442 | 5213 | 3 | 3 | 0.06% | 0.06% | 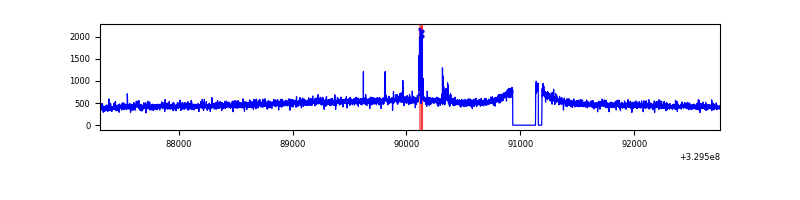 |
| D | 5442 | 5213 | 252 | 252 | 4.63% | 4.83% | 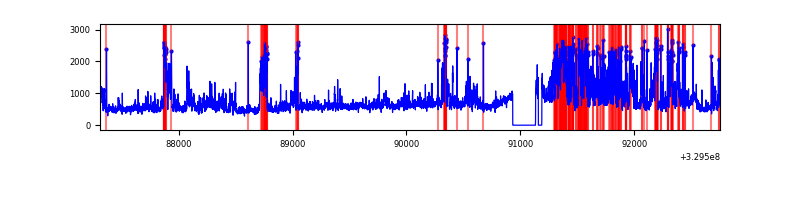 |
Top three noisy pixels from each quadrant. If the there are fewer than three noisy pixels in the level2.evt file, extra rows are filled as -1
| Pixel properties | Quadrant properties | ||||||
|---|---|---|---|---|---|---|---|
| Quadrant | DetID | PixID | Counts | Sigma | Mean | Median | Sigma |
| A | 6 | 16 | 37093 | 274.11 | 657 | 643 | 133.0 |
| A | 13 | 254 | 8197 | 56.81 | 657 | 643 | 133.0 |
| A | 3 | 137 | 6099 | 41.03 | 657 | 643 | 133.0 |
| B | 12 | 111 | 15611 | 120.22 | 647 | 630 | 124.6 |
| B | 11 | 111 | 14135 | 108.37 | 647 | 630 | 124.6 |
| B | 14 | 111 | 12528 | 95.48 | 647 | 630 | 124.6 |
| C | 14 | 238 | 100717 | 679.02 | 622 | 624 | 147.4 |
| C | 5 | 112 | 45176 | 302.24 | 622 | 624 | 147.4 |
| C | 8 | 128 | 7222 | 44.76 | 622 | 624 | 147.4 |
| D | 7 | 238 | 895756 | 5821.63 | 626 | 608 | 153.8 |
| D | 8 | 195 | 466188 | 3027.92 | 626 | 608 | 153.8 |
| D | 1 | 52 | 401573 | 2607.69 | 626 | 608 | 153.8 |
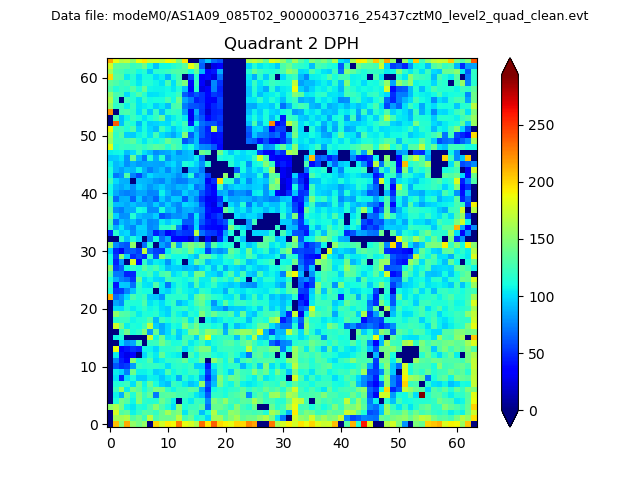
Histogram calculated using DETX and DETY for each event in the final _common_clean file
| Quadrant A | 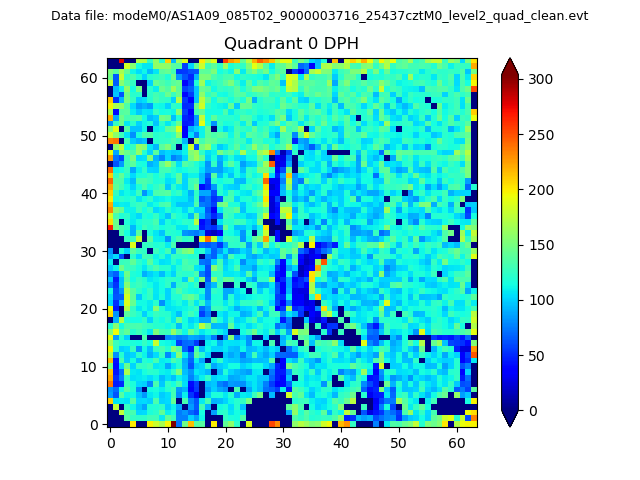 |
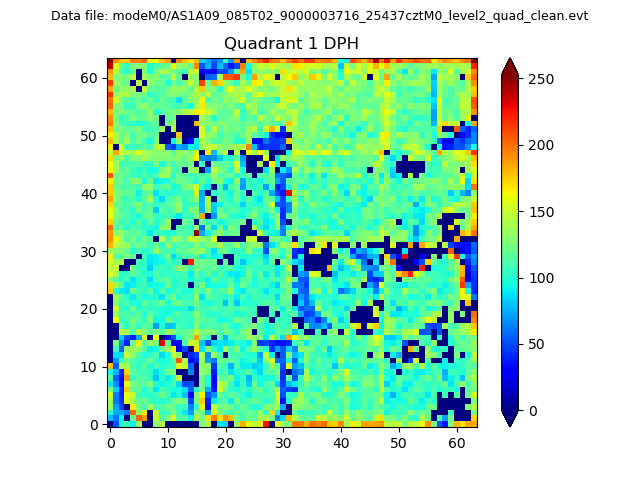 |
Quadrant B |
|---|---|---|---|
| Quadrant D | 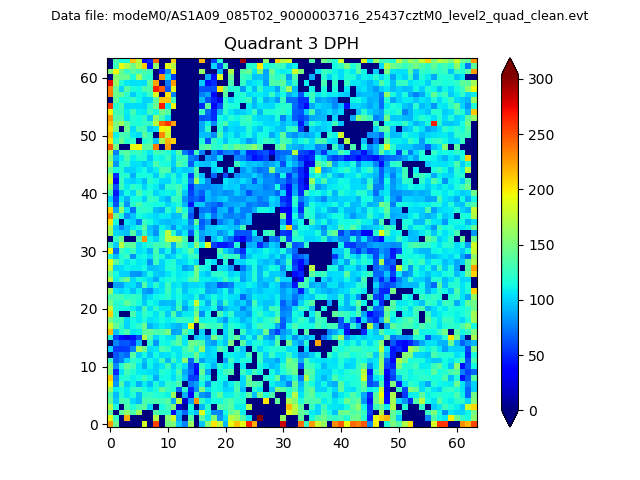 |
 |
Quadrant C |
| Plot type | Count rate plots | Images |
|---|---|---|
| Comparison with Poisson distribution Blue bars denote a histogram of data divided into 1 sec bins. Red curve is a Poisson curve with rate = median count rate of data. |
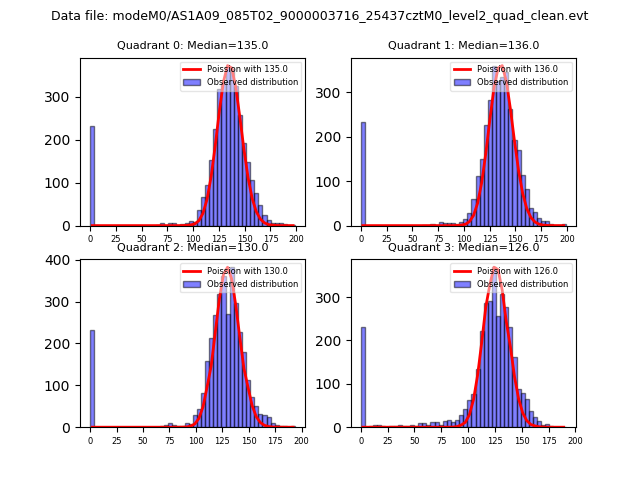 |
 |
| Quadrant-wise count rates Data is divided into 100 sec bins |
 |
|
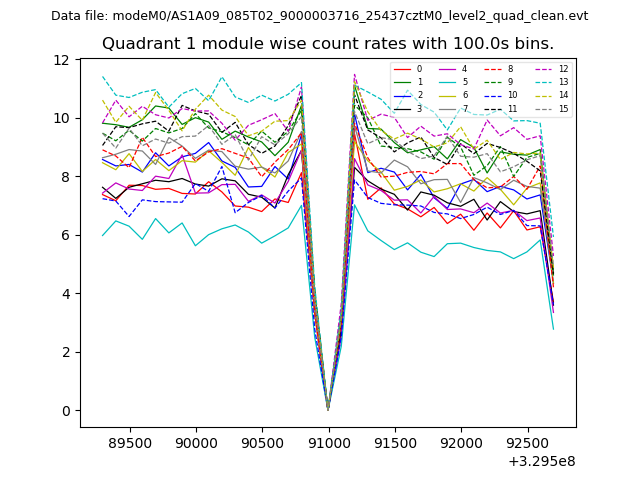
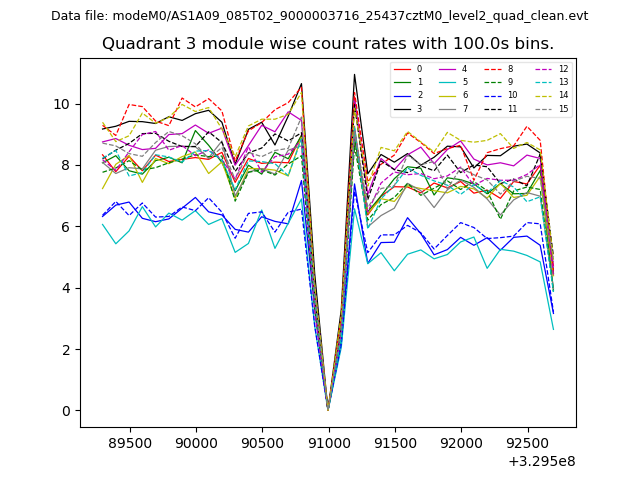
| Module-wise count rates for Quadrant A Data is divided into 100 sec bins |
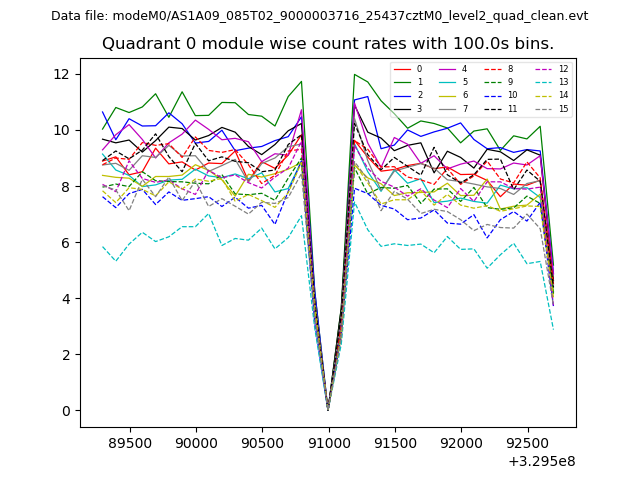 |
 |
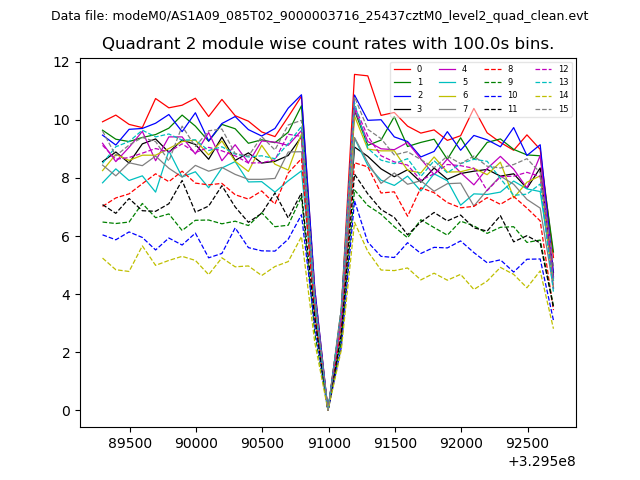
| Module-wise count rates for Quadrant B Data is divided into 100 sec bins |
 |
 |
| Module-wise count rates for Quadrant C Data is divided into 100 sec bins |
 |
 |
| Module-wise count rates for Quadrant D Data is divided into 100 sec bins |
 |
 |
| Parameter | Plot |
|---|---|
| CZT HV Monitor | 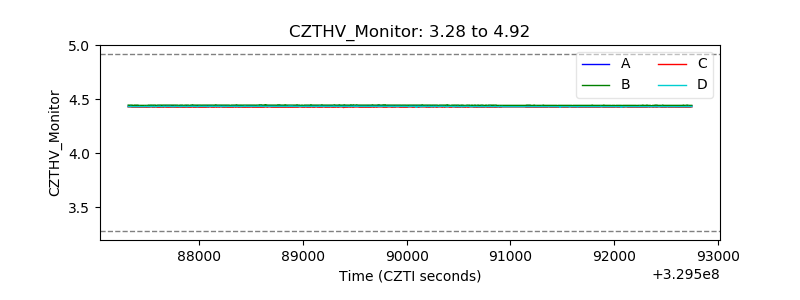 |
| D_VDD | 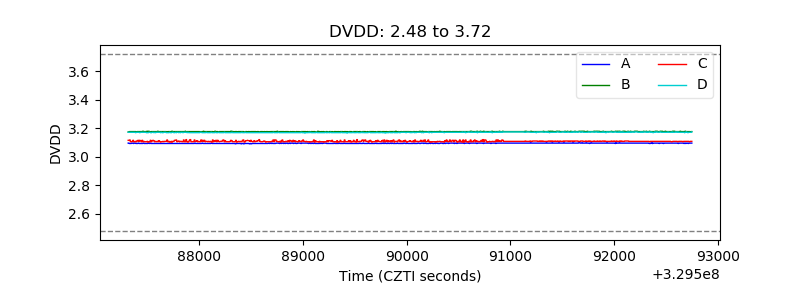 |
| Temperature 1 | 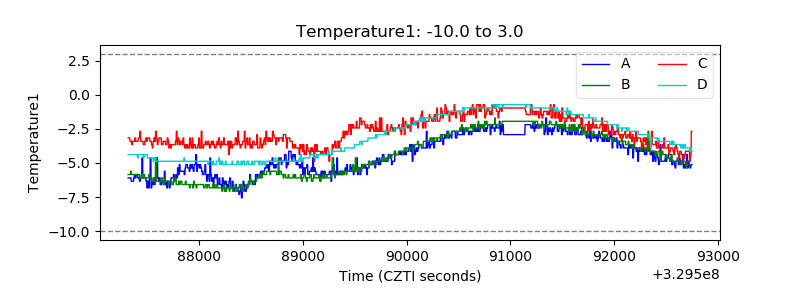 |
| Veto HV Monitor | 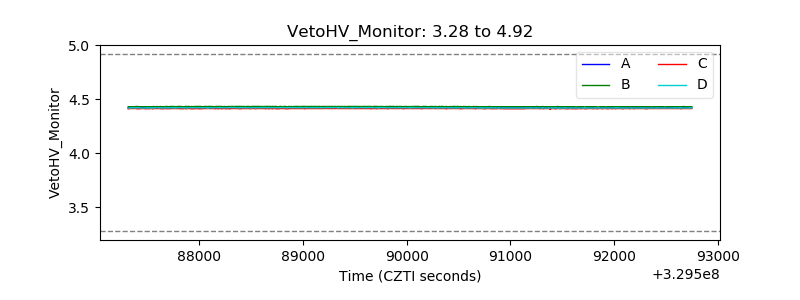 |
| Veto LLD | 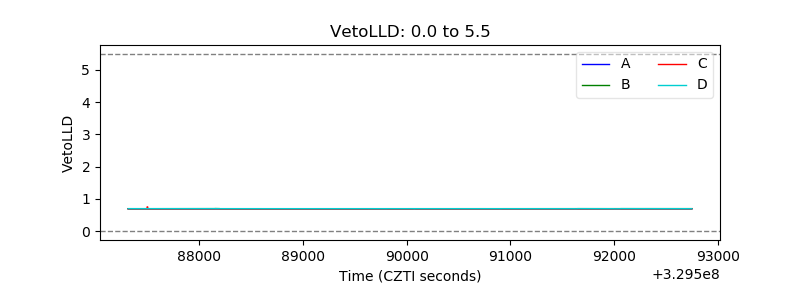 |
| Alpha Counter | 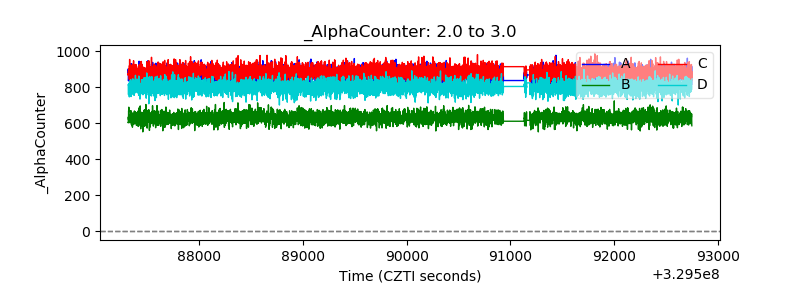 |
| _CPM_Rate | 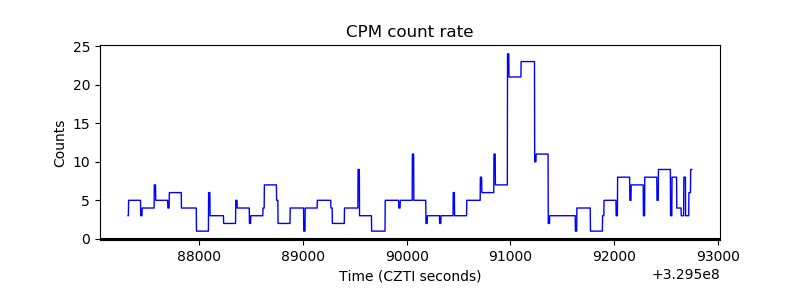 |
| CZT Counter | 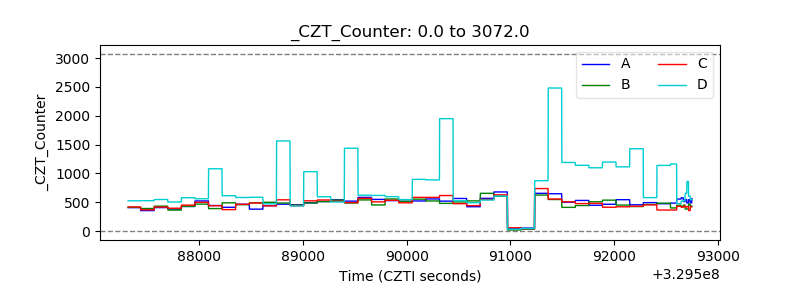 |
| +2.5 Volts monitor |  |
| +5 Volts monitor |  |
| _ROLL_ROT | 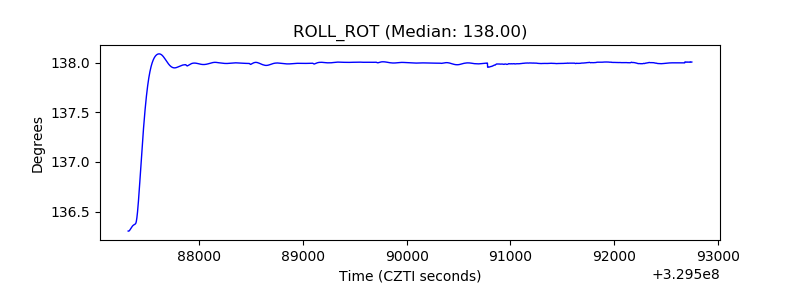 |
| _Roll_DEC | 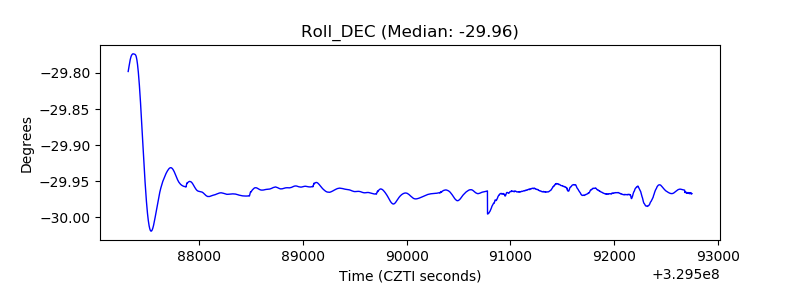 |
| _Roll_RA | 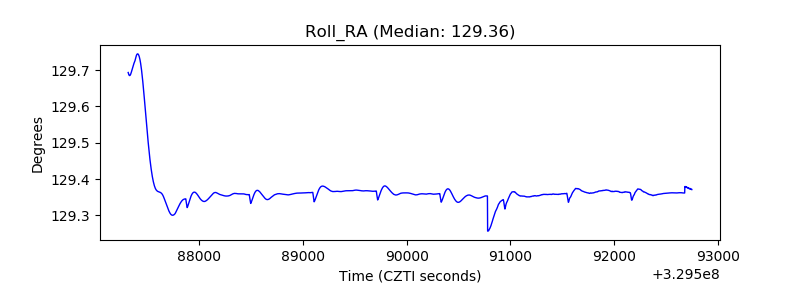 |
| Veto Counter | 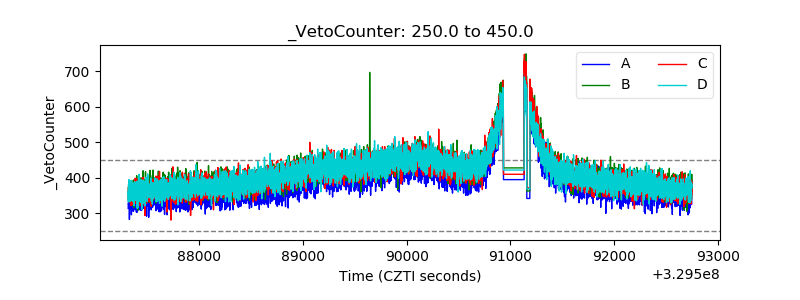 |