| Param | Original file | Final file |
|---|---|---|
| Filename | modeM0/AS1A09_085T02_9000003716_25438cztM0_level2.evt | modeM0/AS1A09_085T02_9000003716_25438cztM0_level2_quad_clean.evt |
| Size (bytes) | 637,488,000 | 101,494,080 |
| Size | 608.0 MB | 96.8 MB |
| Events in quadrant A | 3,514,871 | 661,535 |
| Events in quadrant B | 3,524,337 | 661,910 |
| Events in quadrant C | 3,462,773 | 636,458 |
| Events in quadrant D | 8,303,557 | 599,450 |
| Mode M9 | |||
|---|---|---|---|
| Quadrant | BADHDUFLAG | Total packets | Discarded packets |
| A | 0 | 4 | 0 |
| B | 0 | 4 | 0 |
| C | 0 | 4 | 0 |
| D | 0 | 4 | 0 |
| Mode M0 | |||
|---|---|---|---|
| Quadrant | BADHDUFLAG | Total packets | Discarded packets |
| A | 0 | 15041 | 0 |
| B | 0 | 15147 | 0 |
| C | 0 | 15084 | 0 |
| D | 0 | 29537 | 0 |
| Quadrant | Total seconds | Saturated seconds | Saturation percentage |
|---|---|---|---|
| A | 7386 | 20 | 0.270783% |
| B | 7387 | 44 | 0.595641% |
| C | 7387 | 70 | 0.947611% |
| D | 7387 | 1715 | 23.216461% |
Noise dominated data is calculated using 1-second bins in cleaned event files. If a bin has >2000 counts, and if more than 50% of those come from <1% of pixels, then it is considered to be noise-dominated and hence unusable.
| Quadrant | # 1 sec bins | Bins with >0 counts | Bins with >2000 counts | High rate bins dominated by noise | Noise dominated (total time) | Noise dominated (detector-on time) | Marked lightcurve |
|---|---|---|---|---|---|---|---|
| A | 7791 | 7387 | 0 | 0 | 0.00% | 0.00% | 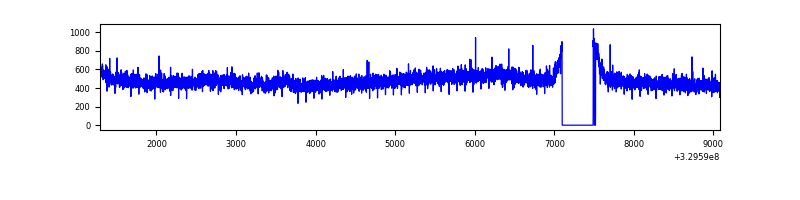 |
| B | 7792 | 7387 | 0 | 0 | 0.00% | 0.00% | 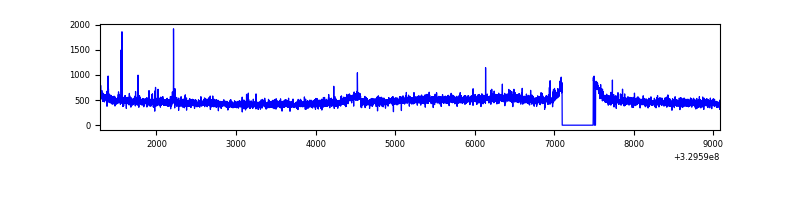 |
| C | 7792 | 7388 | 0 | 0 | 0.00% | 0.00% | 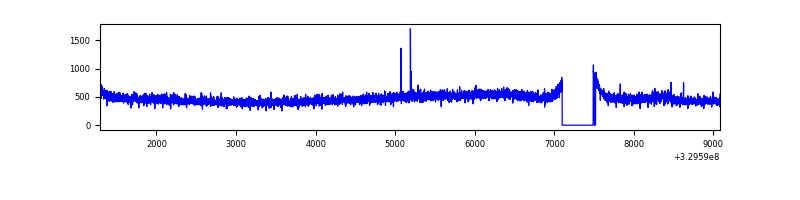 |
| D | 7791 | 7387 | 1634 | 1634 | 20.97% | 22.12% | 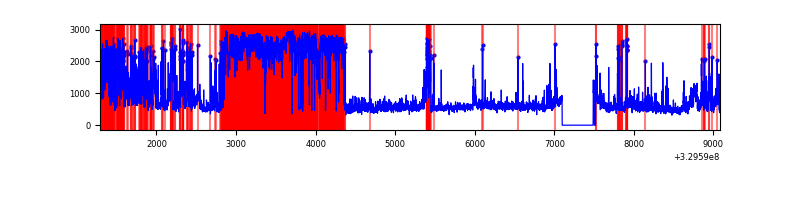 |
Top three noisy pixels from each quadrant. If the there are fewer than three noisy pixels in the level2.evt file, extra rows are filled as -1
| Pixel properties | Quadrant properties | ||||||
|---|---|---|---|---|---|---|---|
| Quadrant | DetID | PixID | Counts | Sigma | Mean | Median | Sigma |
| A | 6 | 16 | 66506 | 362.72 | 894 | 876 | 180.9 |
| A | 13 | 254 | 11601 | 59.27 | 894 | 876 | 180.9 |
| A | 3 | 137 | 8436 | 41.78 | 894 | 876 | 180.9 |
| B | 0 | 230 | 22552 | 128.42 | 882 | 861 | 168.9 |
| B | 12 | 111 | 20977 | 119.1 | 882 | 861 | 168.9 |
| B | 11 | 111 | 18665 | 105.41 | 882 | 861 | 168.9 |
| C | 14 | 238 | 135990 | 681.01 | 846 | 850 | 198.4 |
| C | 9 | 54 | 25217 | 122.79 | 846 | 850 | 198.4 |
| C | 13 | 61 | 5968 | 25.79 | 846 | 850 | 198.4 |
| D | 7 | 238 | 4544873 | 25404.01 | 740 | 718 | 178.9 |
| D | 8 | 195 | 465745 | 2599.72 | 740 | 718 | 178.9 |
| D | 2 | 82 | 189756 | 1056.81 | 740 | 718 | 178.9 |
Histogram calculated using DETX and DETY for each event in the final _common_clean file
| Quadrant A | 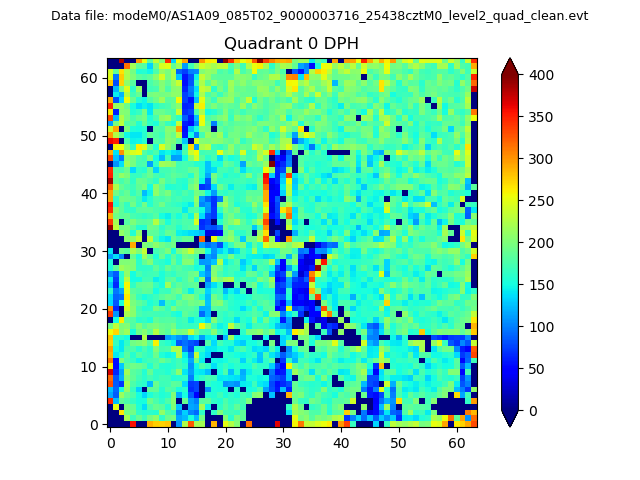 |
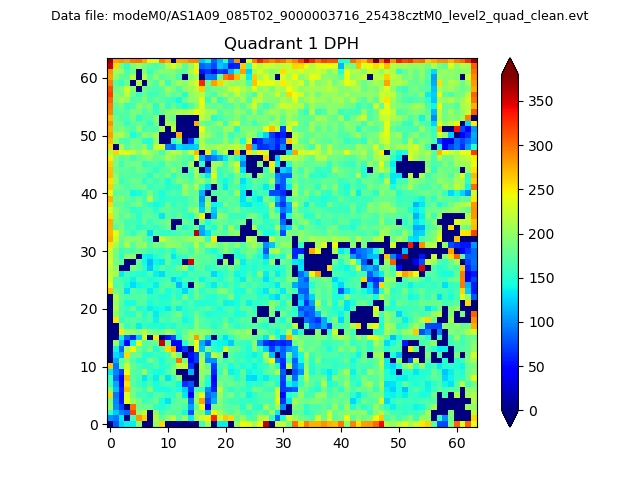 |
Quadrant B |
|---|---|---|---|
| Quadrant D | 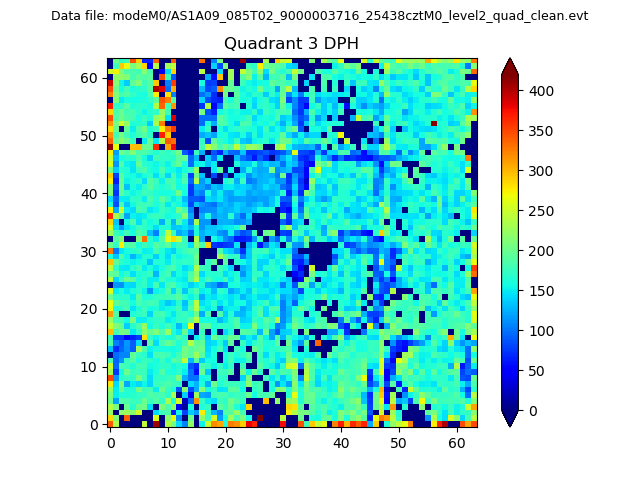 |
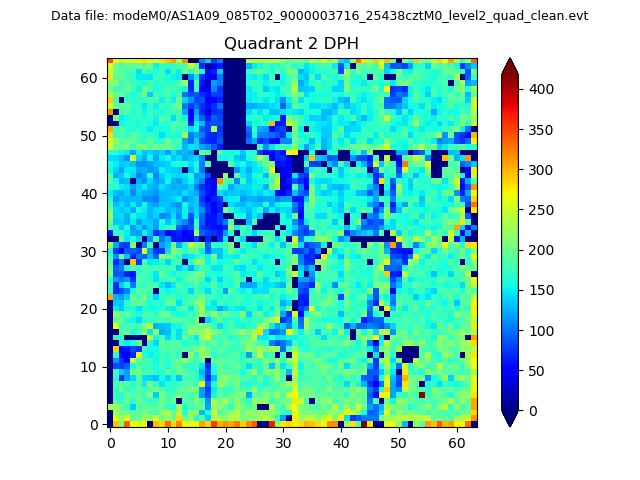 |
Quadrant C |
| Plot type | Count rate plots | Images |
|---|---|---|
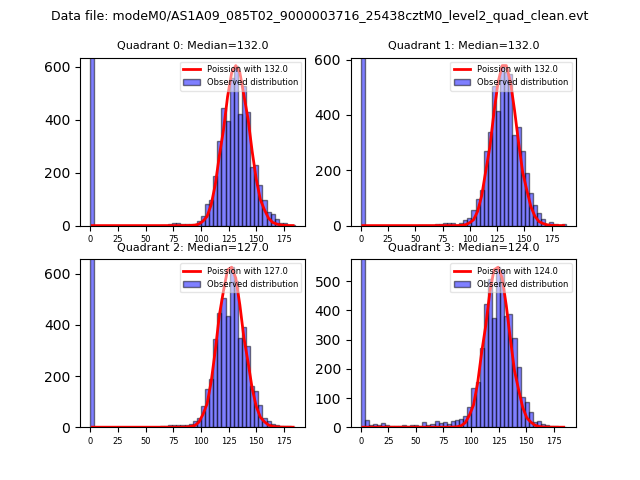
| Comparison with Poisson distribution Blue bars denote a histogram of data divided into 1 sec bins. Red curve is a Poisson curve with rate = median count rate of data. |
 |
 |
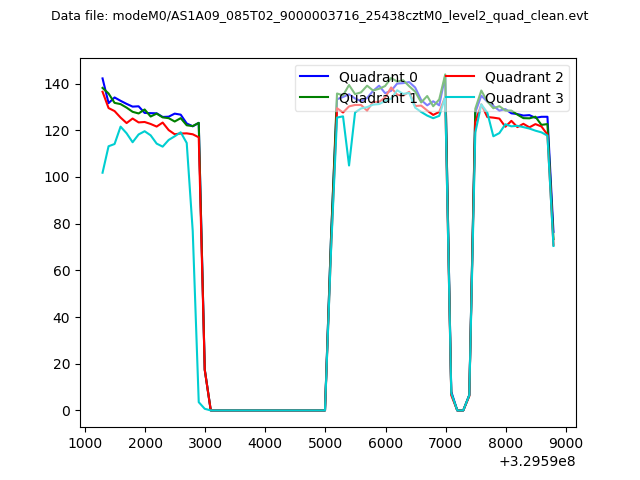
| Quadrant-wise count rates Data is divided into 100 sec bins |
 |
|
| Module-wise count rates for Quadrant A Data is divided into 100 sec bins |
 |
 |
| Module-wise count rates for Quadrant B Data is divided into 100 sec bins |
 |
 |
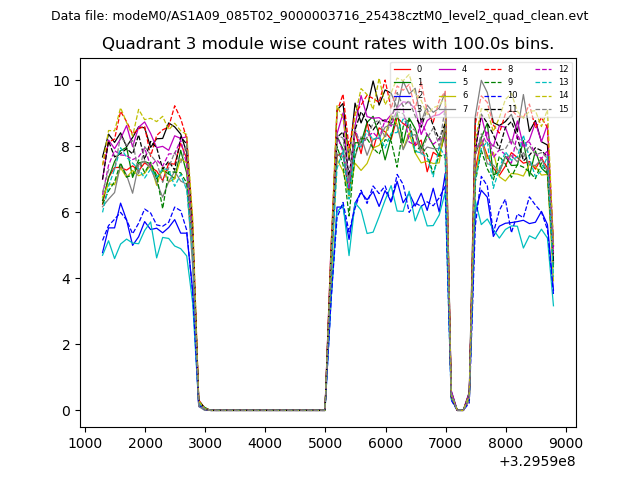
| Module-wise count rates for Quadrant C Data is divided into 100 sec bins |
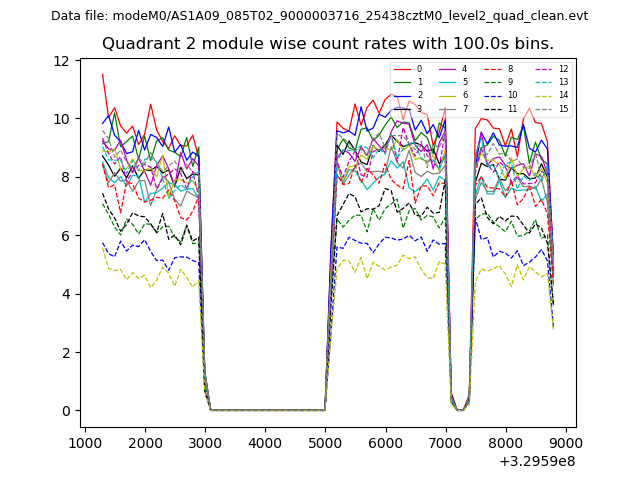 |
 |
| Module-wise count rates for Quadrant D Data is divided into 100 sec bins |
 |
 |
| Parameter | Plot |
|---|---|
| CZT HV Monitor | 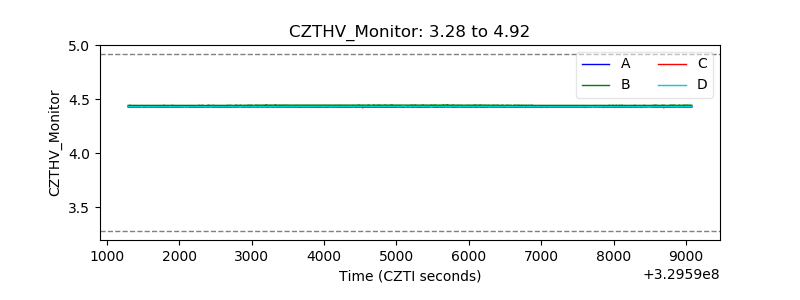 |
| D_VDD | 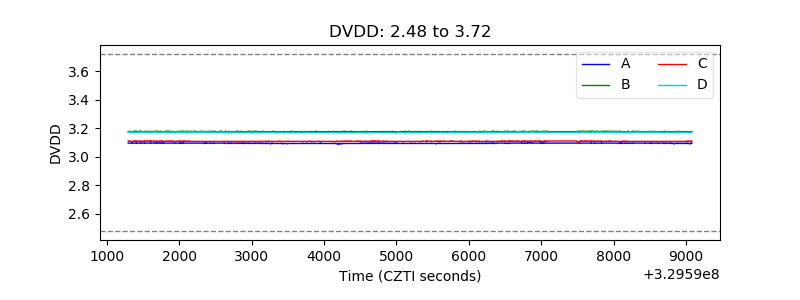 |
| Temperature 1 | 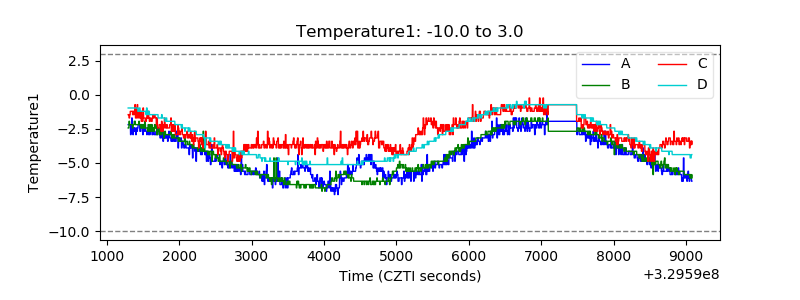 |
| Veto HV Monitor | 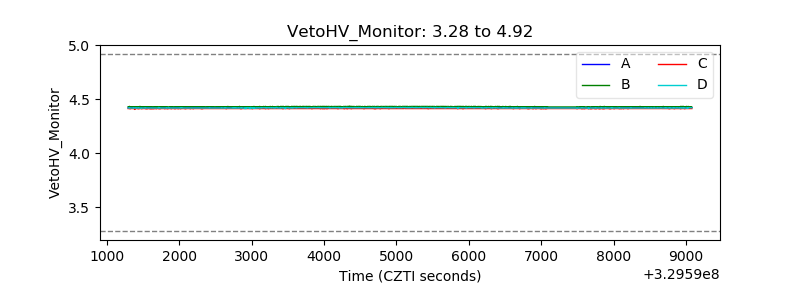 |
| Veto LLD | 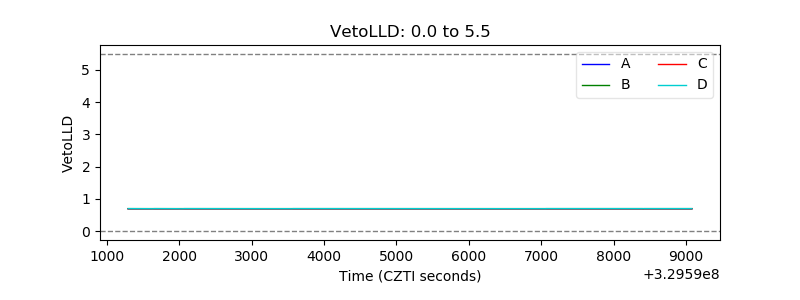 |
| Alpha Counter | 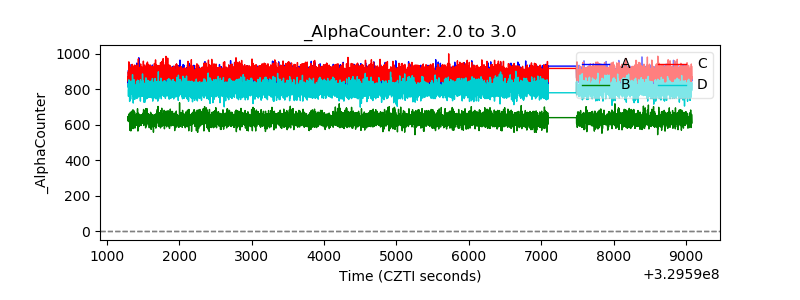 |
| _CPM_Rate | 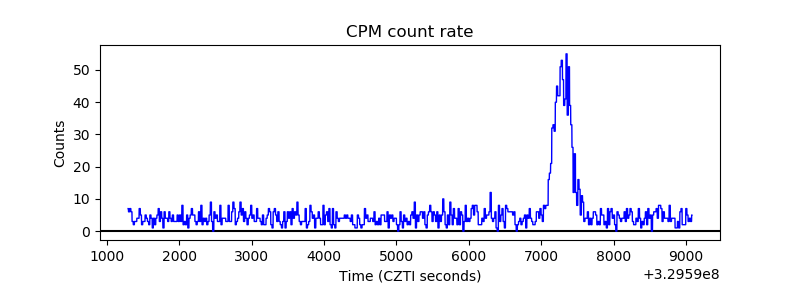 |
| CZT Counter | 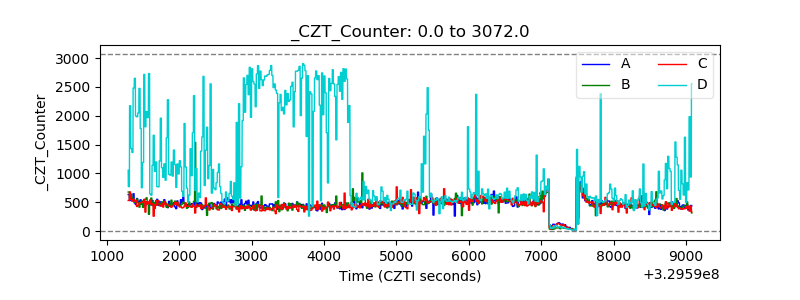 |
| +2.5 Volts monitor | 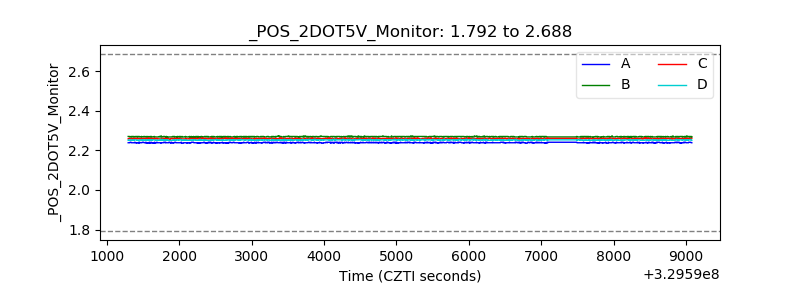 |
| +5 Volts monitor | 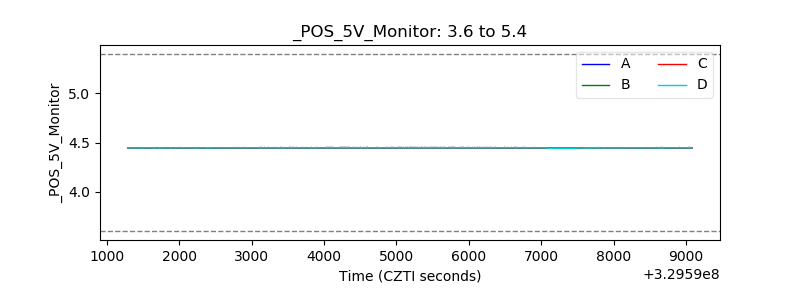 |
| _ROLL_ROT | 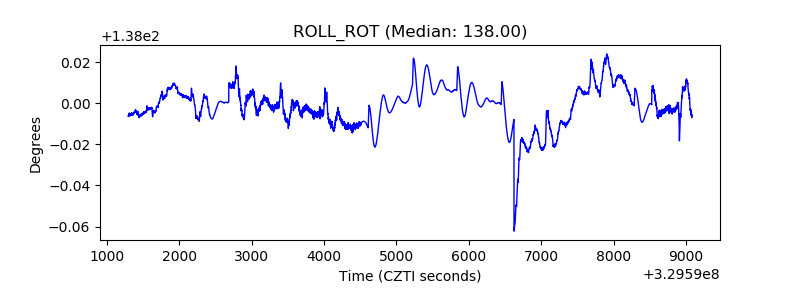 |
| _Roll_DEC | 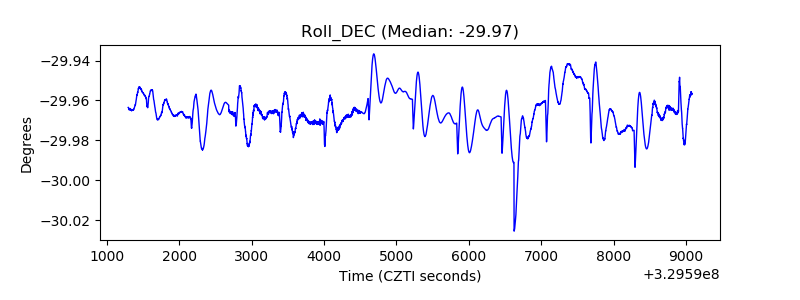 |
| _Roll_RA | 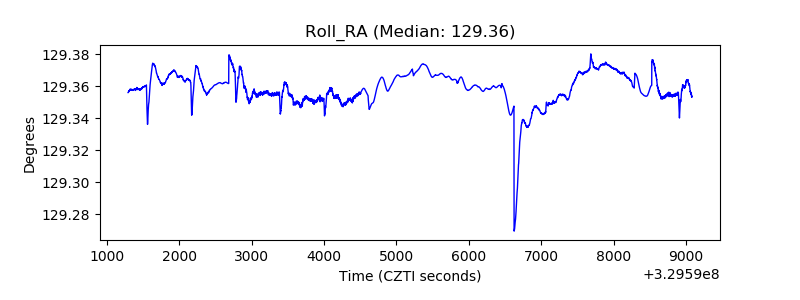 |
| Veto Counter |  |