| Param | Original file | Final file |
|---|---|---|
| Filename | modeM0/AS1A09_085T02_9000003716_25440cztM0_level2.evt | modeM0/AS1A09_085T02_9000003716_25440cztM0_level2_quad_clean.evt |
| Size (bytes) | 932,901,120 | 153,146,880 |
| Size | 889.7 MB | 146.1 MB |
| Events in quadrant A | 5,921,118 | 969,118 |
| Events in quadrant B | 6,015,418 | 973,863 |
| Events in quadrant C | 6,662,688 | 932,584 |
| Events in quadrant D | 8,796,718 | 886,870 |
| Mode M9 | |||
|---|---|---|---|
| Quadrant | BADHDUFLAG | Total packets | Discarded packets |
| A | 0 | 13 | 0 |
| B | 0 | 13 | 0 |
| C | 0 | 13 | 0 |
| D | 0 | 13 | 0 |
| Mode M0 | |||
|---|---|---|---|
| Quadrant | BADHDUFLAG | Total packets | Discarded packets |
| A | 0 | 25721 | 0 |
| B | 0 | 25888 | 0 |
| C | 0 | 27819 | 0 |
| D | 0 | 34440 | 0 |
| Quadrant | Total seconds | Saturated seconds | Saturation percentage |
|---|---|---|---|
| A | 12665 | 62 | 0.489538% |
| B | 12666 | 84 | 0.663193% |
| C | 12666 | 298 | 2.352755% |
| D | 12665 | 548 | 4.326885% |
Noise dominated data is calculated using 1-second bins in cleaned event files. If a bin has >2000 counts, and if more than 50% of those come from <1% of pixels, then it is considered to be noise-dominated and hence unusable.
| Quadrant | # 1 sec bins | Bins with >0 counts | Bins with >2000 counts | High rate bins dominated by noise | Noise dominated (total time) | Noise dominated (detector-on time) | Marked lightcurve |
|---|---|---|---|---|---|---|---|
| A | 13949 | 12665 | 0 | 0 | 0.00% | 0.00% | 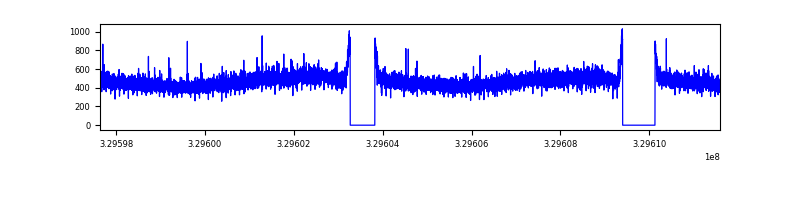 |
| B | 13950 | 12666 | 1 | 1 | 0.01% | 0.01% | 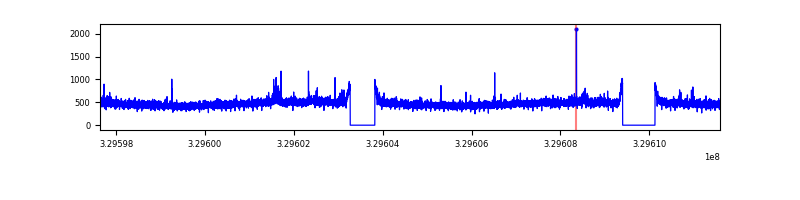 |
| C | 13950 | 12666 | 149 | 149 | 1.07% | 1.18% | 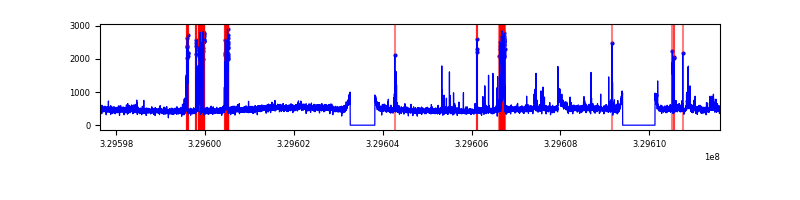 |
| D | 13950 | 12666 | 494 | 494 | 3.54% | 3.90% | 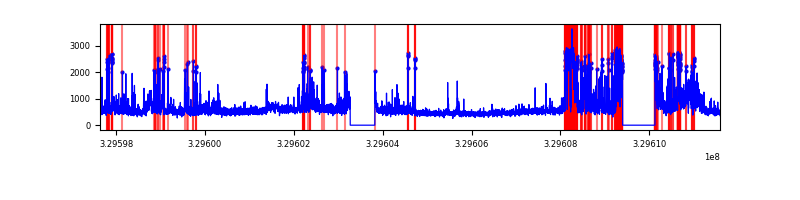 |
Top three noisy pixels from each quadrant. If the there are fewer than three noisy pixels in the level2.evt file, extra rows are filled as -1
| Pixel properties | Quadrant properties | ||||||
|---|---|---|---|---|---|---|---|
| Quadrant | DetID | PixID | Counts | Sigma | Mean | Median | Sigma |
| A | 13 | 254 | 18642 | 55.53 | 1534 | 1499 | 308.7 |
| A | 3 | 137 | 14633 | 42.55 | 1534 | 1499 | 308.7 |
| A | 0 | 226 | 13055 | 37.44 | 1534 | 1499 | 308.7 |
| B | 12 | 111 | 36322 | 120.46 | 1512 | 1471 | 289.3 |
| B | 0 | 229 | 35926 | 119.1 | 1512 | 1471 | 289.3 |
| B | 11 | 111 | 32457 | 107.1 | 1512 | 1471 | 289.3 |
| C | 9 | 54 | 759261 | 2244.22 | 1443 | 1449 | 337.7 |
| C | 14 | 238 | 231660 | 681.76 | 1443 | 1449 | 337.7 |
| C | 2 | 16 | 40483 | 115.6 | 1443 | 1449 | 337.7 |
| D | 7 | 238 | 1463968 | 4148.88 | 1447 | 1404 | 352.5 |
| D | 9 | 35 | 648834 | 1836.57 | 1447 | 1404 | 352.5 |
| D | 8 | 195 | 395217 | 1117.13 | 1447 | 1404 | 352.5 |
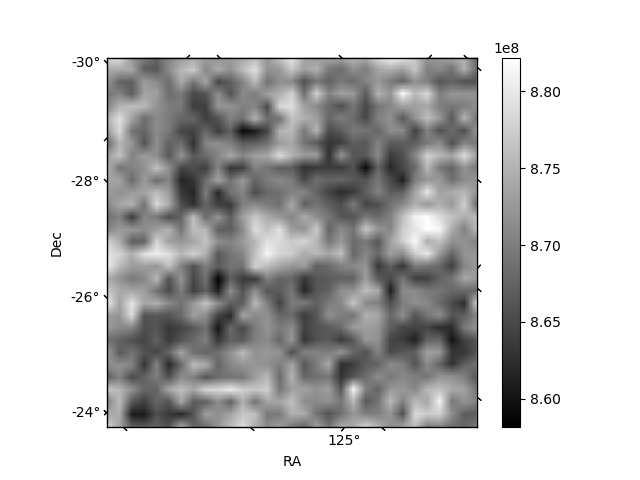
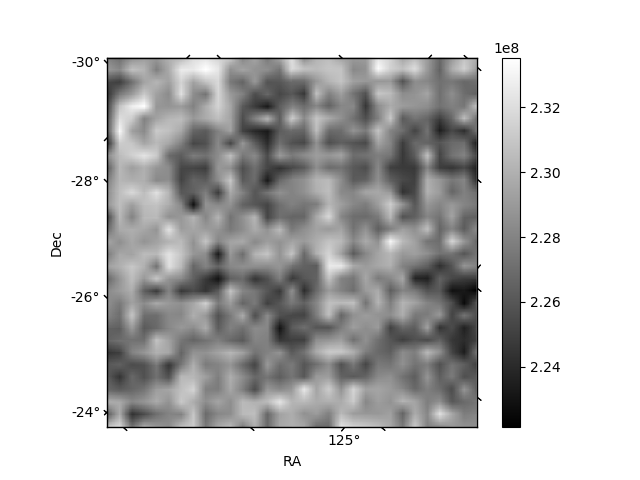
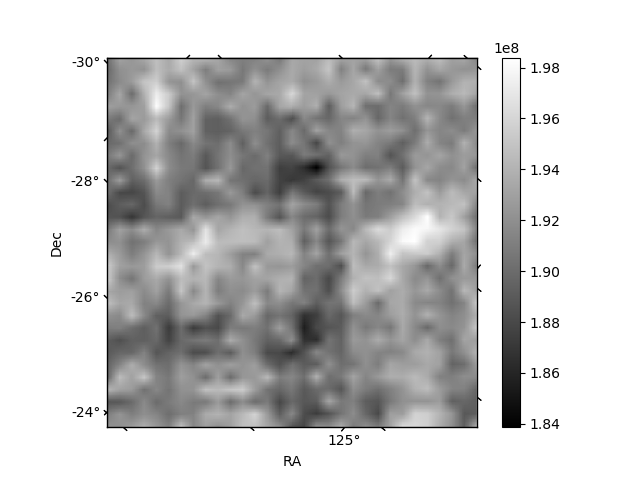
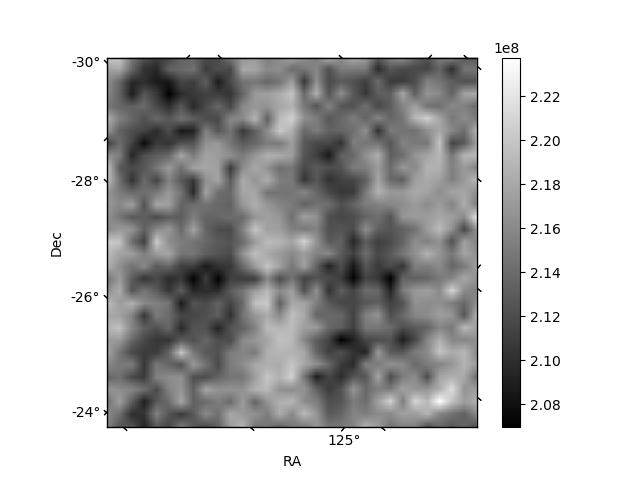
Histogram calculated using DETX and DETY for each event in the final _common_clean file
| Quadrant A | 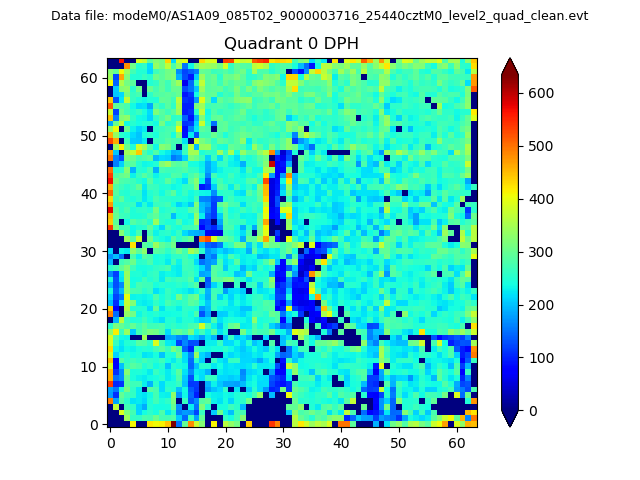 |
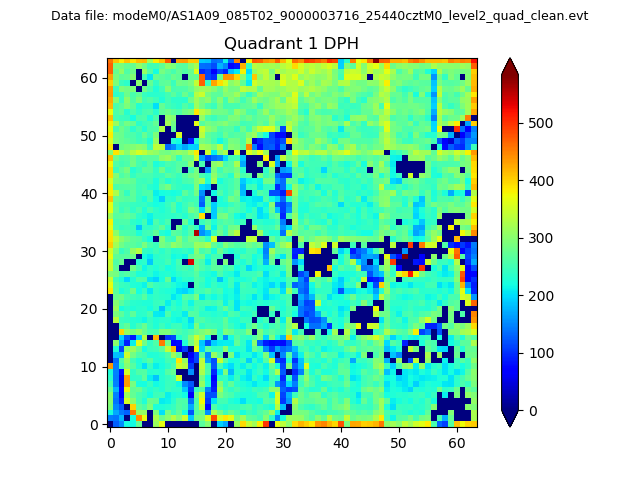 |
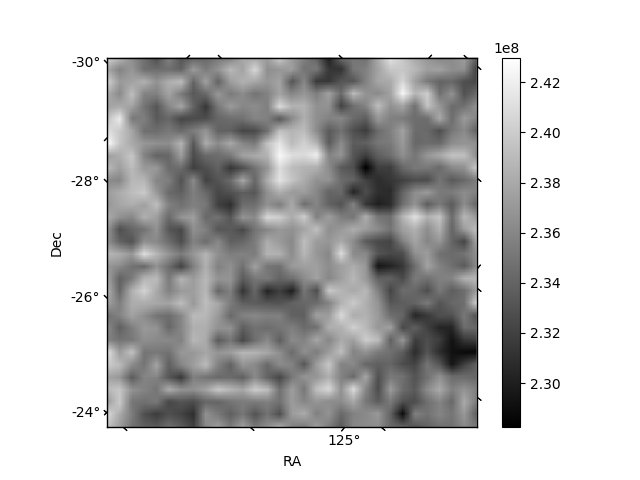
Quadrant B |
|---|---|---|---|
| Quadrant D | 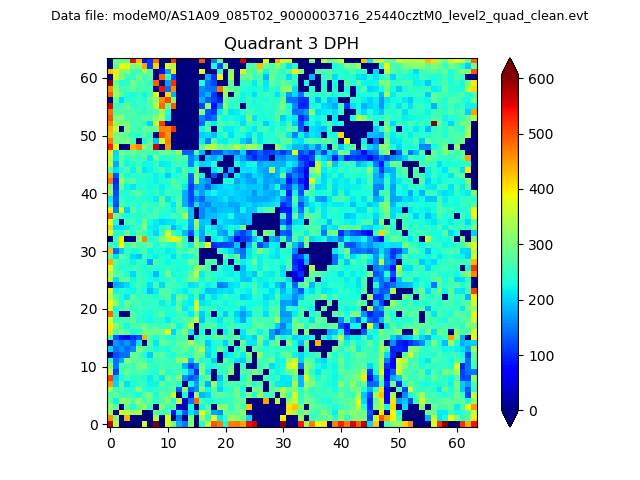 |
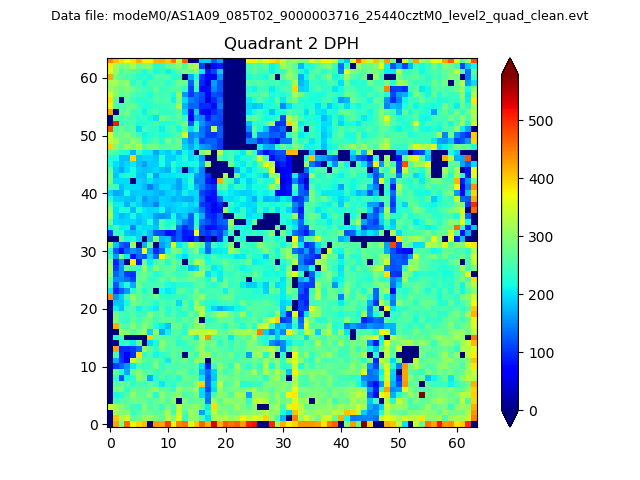 |
Quadrant C |
| Plot type | Count rate plots | Images |
|---|---|---|
| Comparison with Poisson distribution Blue bars denote a histogram of data divided into 1 sec bins. Red curve is a Poisson curve with rate = median count rate of data. |
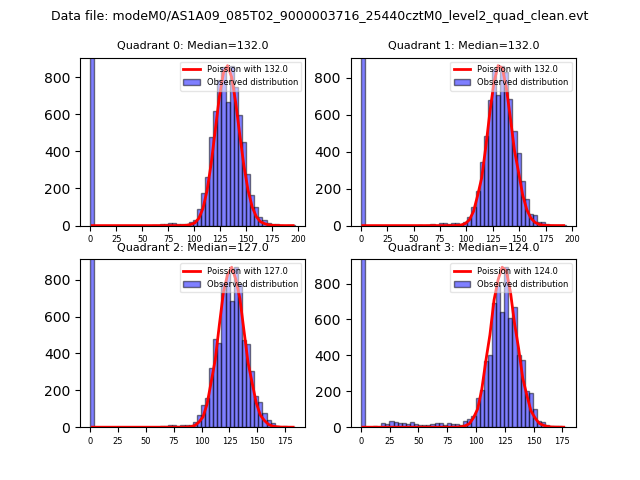 |
 |
| Quadrant-wise count rates Data is divided into 100 sec bins |
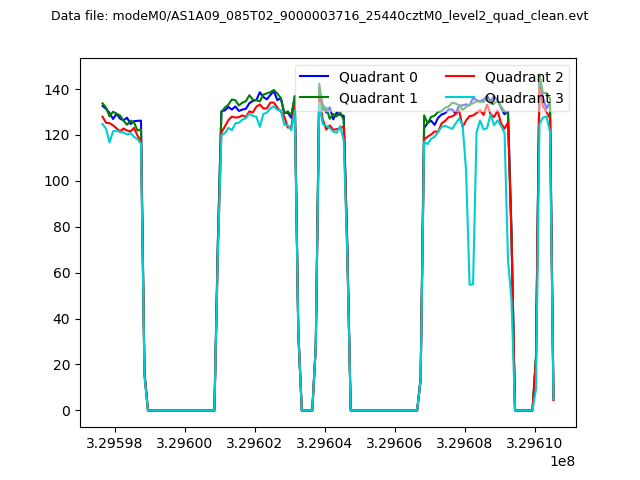 |
|
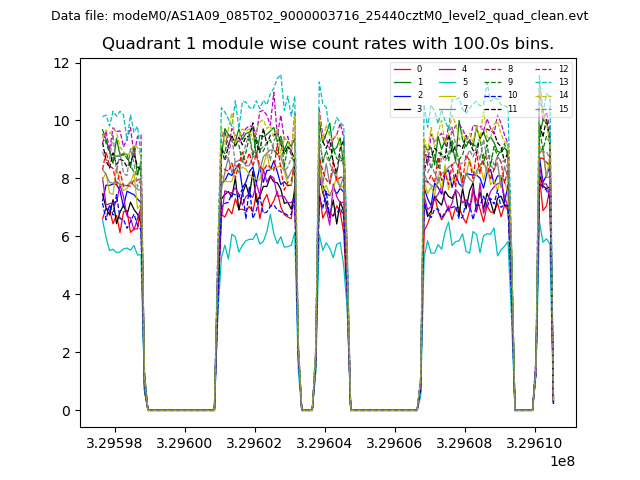
| Module-wise count rates for Quadrant A Data is divided into 100 sec bins |
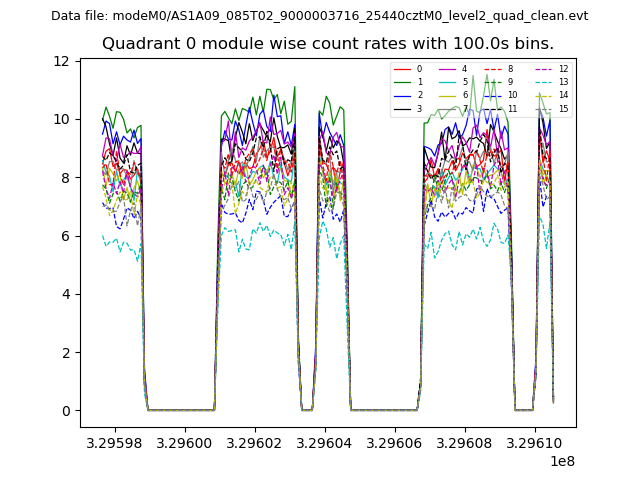 |
 |
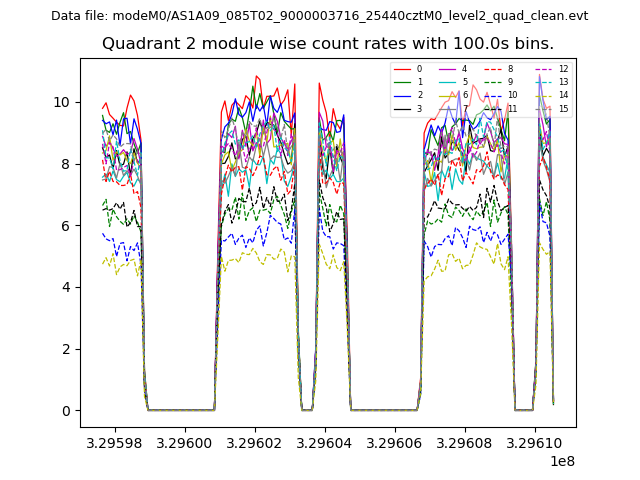
| Module-wise count rates for Quadrant B Data is divided into 100 sec bins |
 |
 |
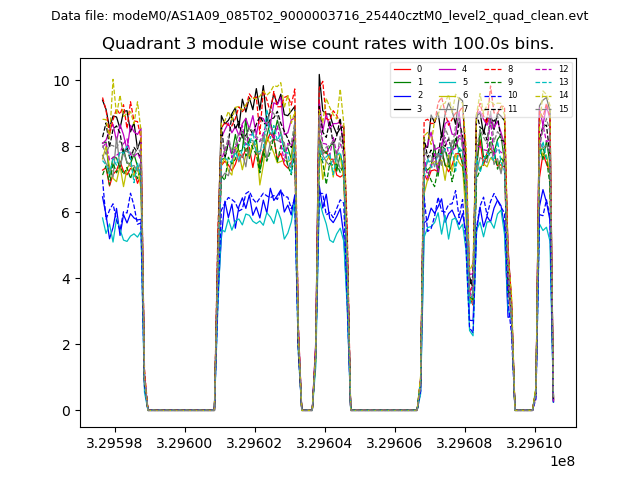
| Module-wise count rates for Quadrant C Data is divided into 100 sec bins |
 |
 |
| Module-wise count rates for Quadrant D Data is divided into 100 sec bins |
 |
 |
| Parameter | Plot |
|---|---|
| CZT HV Monitor | 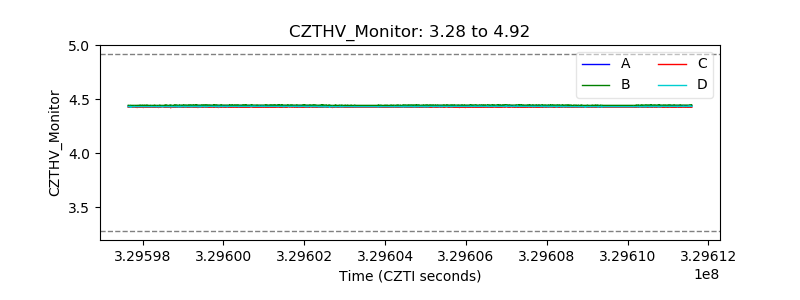 |
| D_VDD | 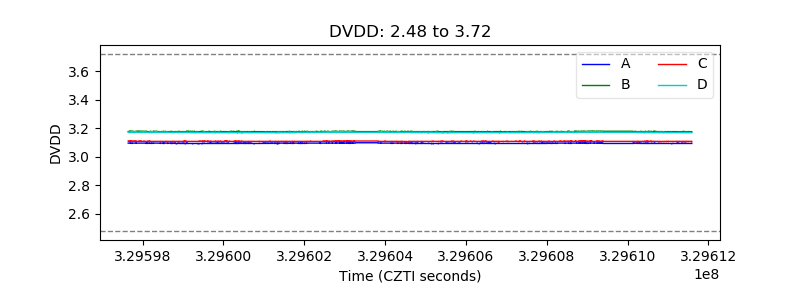 |
| Temperature 1 | 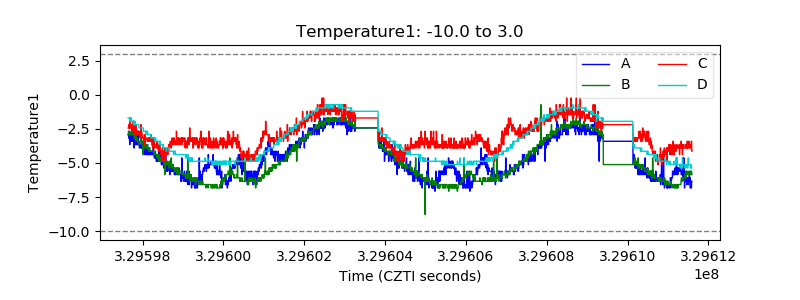 |
| Veto HV Monitor | 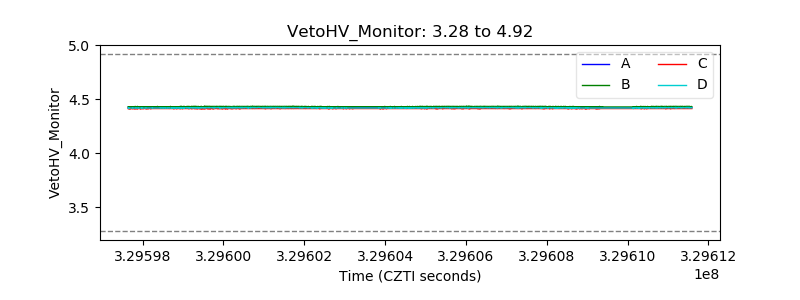 |
| Veto LLD | 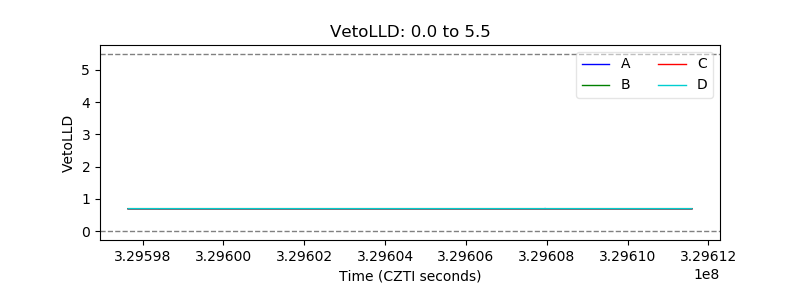 |
| Alpha Counter | 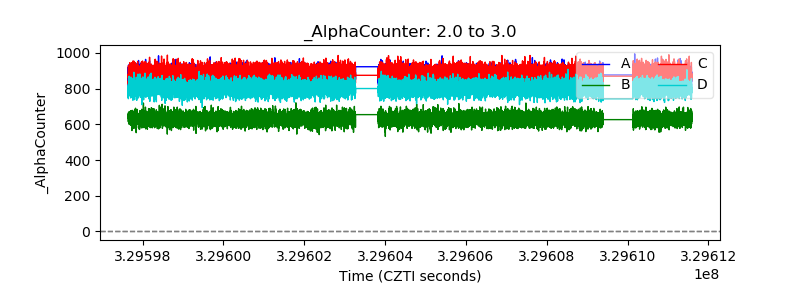 |
| _CPM_Rate | 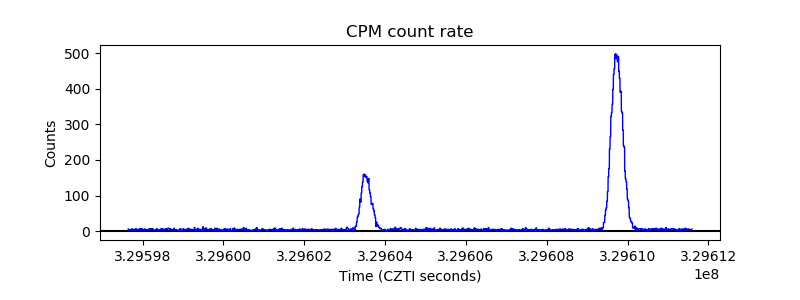 |
| CZT Counter | 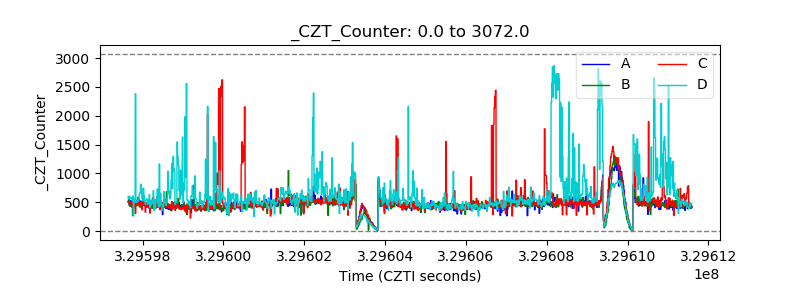 |
| +2.5 Volts monitor | 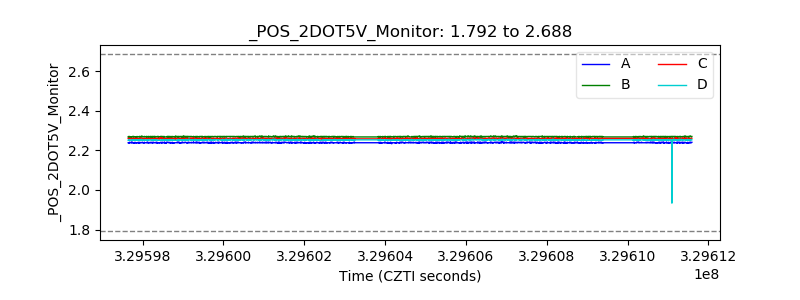 |
| +5 Volts monitor | 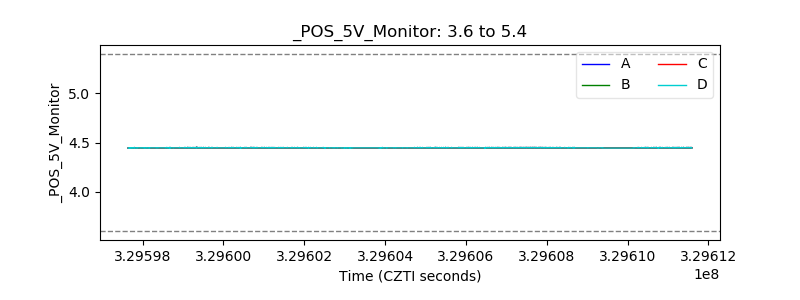 |
| _ROLL_ROT | 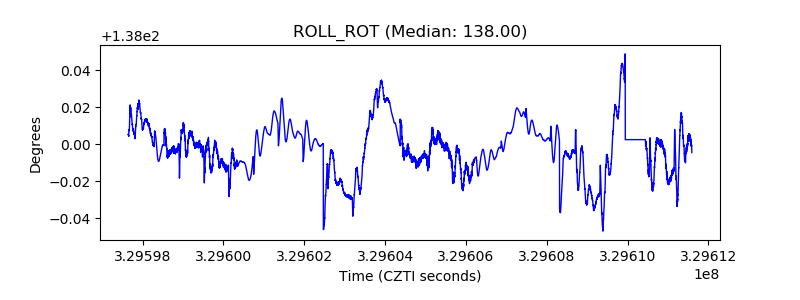 |
| _Roll_DEC | 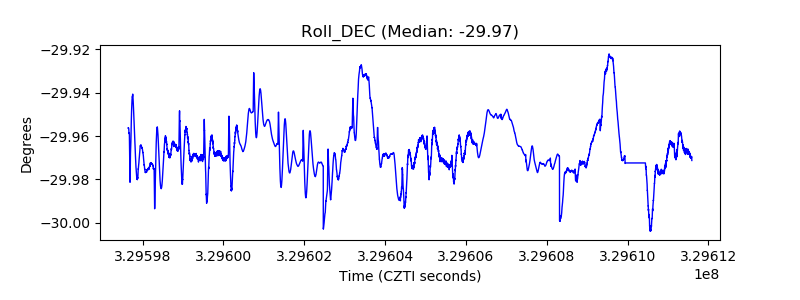 |
| _Roll_RA | 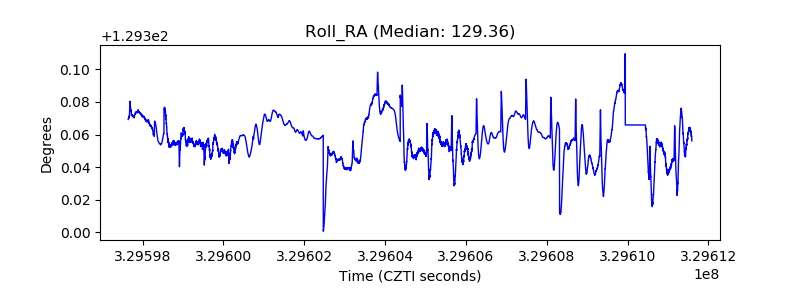 |
| Veto Counter | 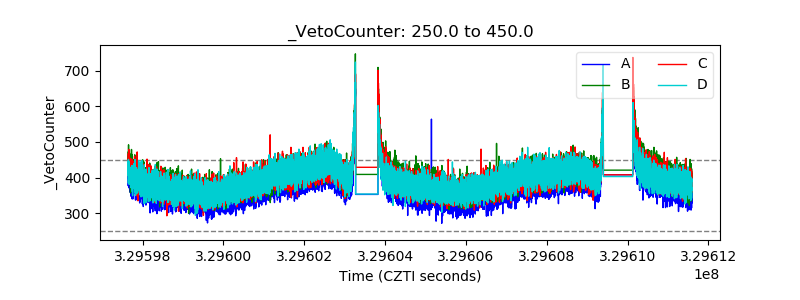 |