| Param | Original file | Final file |
|---|---|---|
| Filename | modeM0/AS1A09_085T02_9000003716_25441cztM0_level2.evt | modeM0/AS1A09_085T02_9000003716_25441cztM0_level2_quad_clean.evt |
| Size (bytes) | 561,487,680 | 73,788,480 |
| Size | 535.5 MB | 70.4 MB |
| Events in quadrant A | 3,397,422 | 461,165 |
| Events in quadrant B | 3,446,476 | 464,172 |
| Events in quadrant C | 3,563,108 | 443,695 |
| Events in quadrant D | 6,114,613 | 368,867 |
| Mode M9 | |||
|---|---|---|---|
| Quadrant | BADHDUFLAG | Total packets | Discarded packets |
| A | 0 | 16 | 0 |
| B | 0 | 16 | 0 |
| C | 0 | 16 | 0 |
| D | 0 | 16 | 0 |
| Mode M0 | |||
|---|---|---|---|
| Quadrant | BADHDUFLAG | Total packets | Discarded packets |
| A | 0 | 14537 | 0 |
| B | 0 | 14627 | 0 |
| C | 0 | 14939 | 0 |
| D | 0 | 22663 | 0 |
| Quadrant | Total seconds | Saturated seconds | Saturation percentage |
|---|---|---|---|
| A | 7115 | 44 | 0.618412% |
| B | 7115 | 56 | 0.787070% |
| C | 7116 | 85 | 1.194491% |
| D | 7115 | 857 | 12.044975% |
Noise dominated data is calculated using 1-second bins in cleaned event files. If a bin has >2000 counts, and if more than 50% of those come from <1% of pixels, then it is considered to be noise-dominated and hence unusable.
| Quadrant | # 1 sec bins | Bins with >0 counts | Bins with >2000 counts | High rate bins dominated by noise | Noise dominated (total time) | Noise dominated (detector-on time) | Marked lightcurve |
|---|---|---|---|---|---|---|---|
| A | 8744 | 7116 | 0 | 0 | 0.00% | 0.00% | 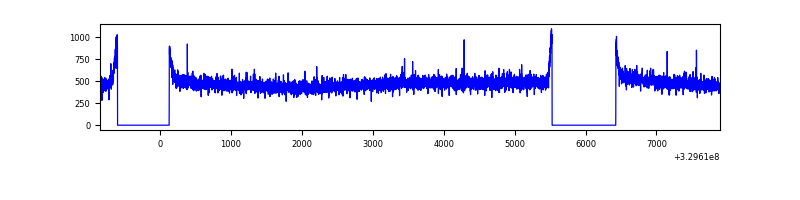 |
| B | 8744 | 7116 | 0 | 0 | 0.00% | 0.00% | 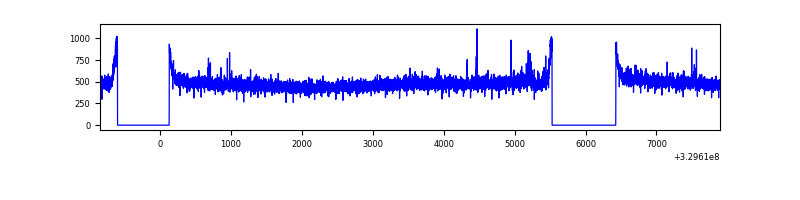 |
| C | 8745 | 7117 | 5 | 5 | 0.06% | 0.07% | 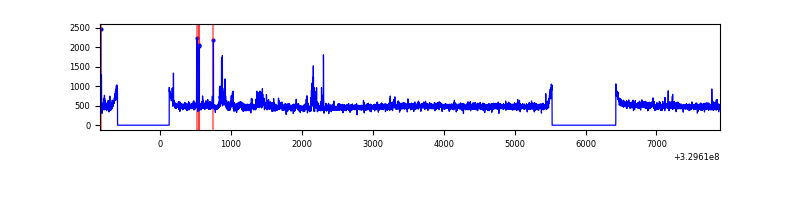 |
| D | 8744 | 7116 | 820 | 820 | 9.38% | 11.52% | 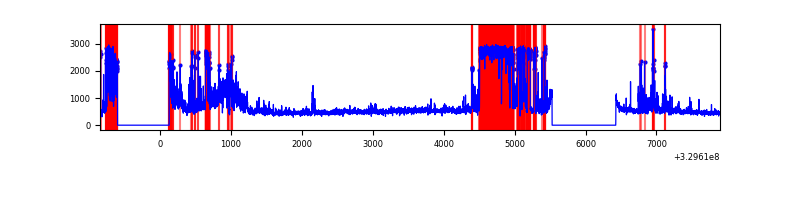 |
Top three noisy pixels from each quadrant. If the there are fewer than three noisy pixels in the level2.evt file, extra rows are filled as -1
| Pixel properties | Quadrant properties | ||||||
|---|---|---|---|---|---|---|---|
| Quadrant | DetID | PixID | Counts | Sigma | Mean | Median | Sigma |
| A | 13 | 254 | 9922 | 50.97 | 880 | 861 | 177.8 |
| A | 3 | 137 | 8207 | 41.32 | 880 | 861 | 177.8 |
| A | 0 | 226 | 7582 | 37.81 | 880 | 861 | 177.8 |
| B | 12 | 111 | 21126 | 121.86 | 871 | 850 | 166.4 |
| B | 11 | 111 | 18591 | 106.63 | 871 | 850 | 166.4 |
| B | 14 | 111 | 17230 | 98.45 | 871 | 850 | 166.4 |
| C | 9 | 54 | 163986 | 833.71 | 834 | 837 | 195.7 |
| C | 14 | 238 | 134061 | 680.79 | 834 | 837 | 195.7 |
| C | 2 | 16 | 11456 | 54.26 | 834 | 837 | 195.7 |
| D | 7 | 238 | 1789259 | 9304.02 | 784 | 759 | 192.2 |
| D | 9 | 35 | 652182 | 3388.79 | 784 | 759 | 192.2 |
| D | 2 | 82 | 188692 | 977.65 | 784 | 759 | 192.2 |
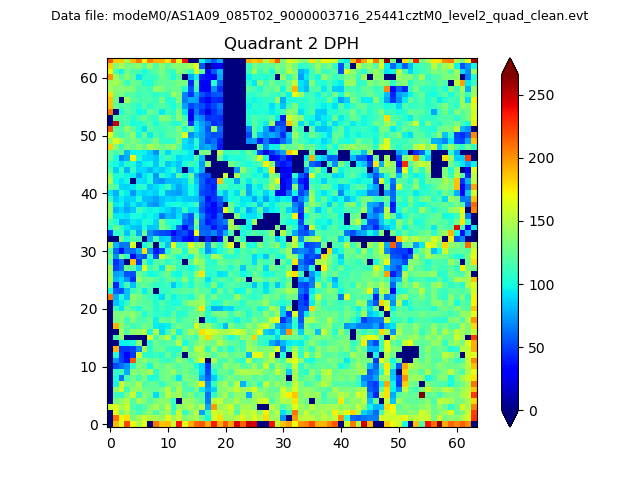
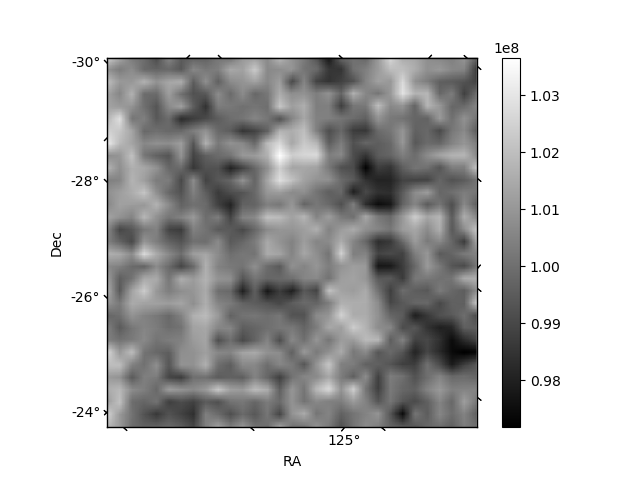
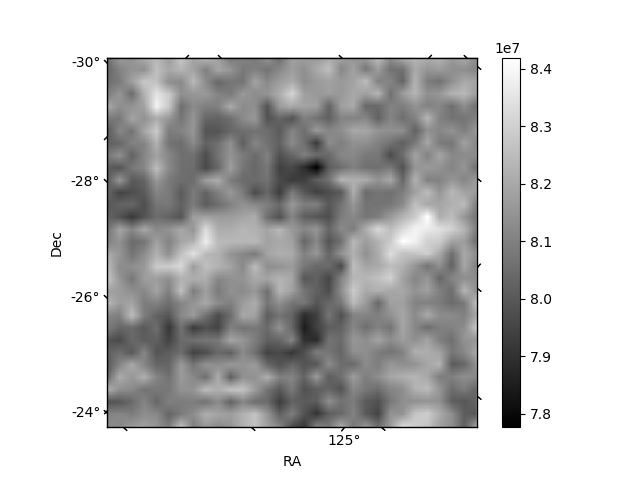
Histogram calculated using DETX and DETY for each event in the final _common_clean file
| Quadrant A | 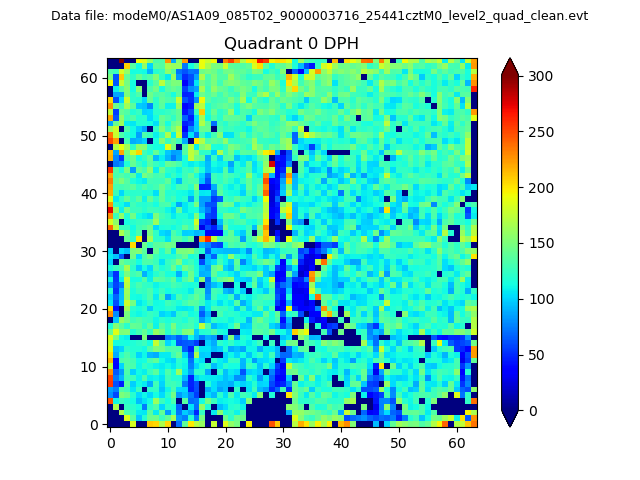 |
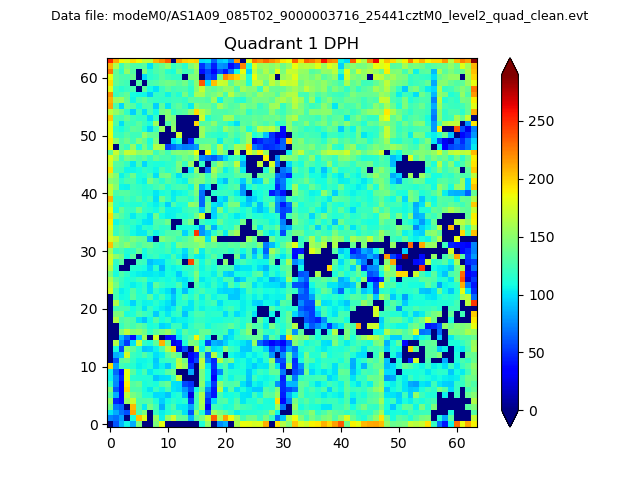 |
Quadrant B |
|---|---|---|---|
| Quadrant D | 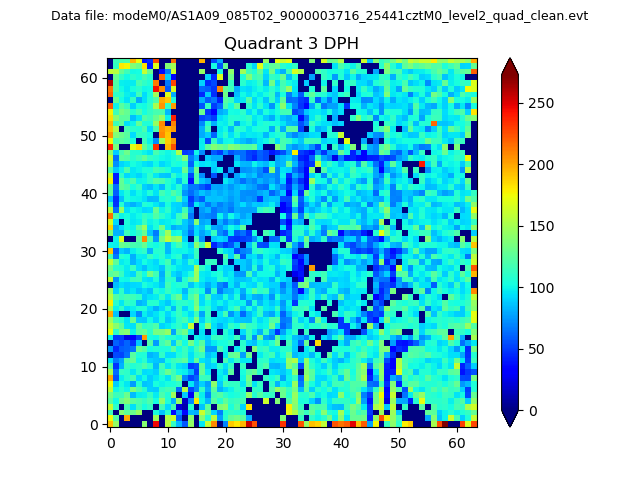 |
 |
Quadrant C |
| Plot type | Count rate plots | Images |
|---|---|---|
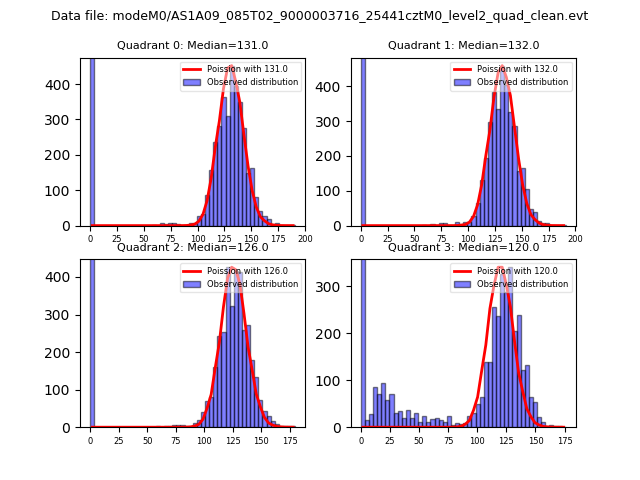
| Comparison with Poisson distribution Blue bars denote a histogram of data divided into 1 sec bins. Red curve is a Poisson curve with rate = median count rate of data. |
 |
 |
| Quadrant-wise count rates Data is divided into 100 sec bins |
 |
|
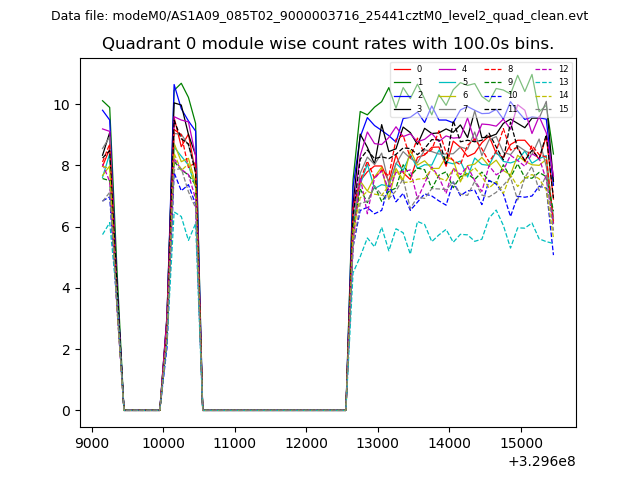
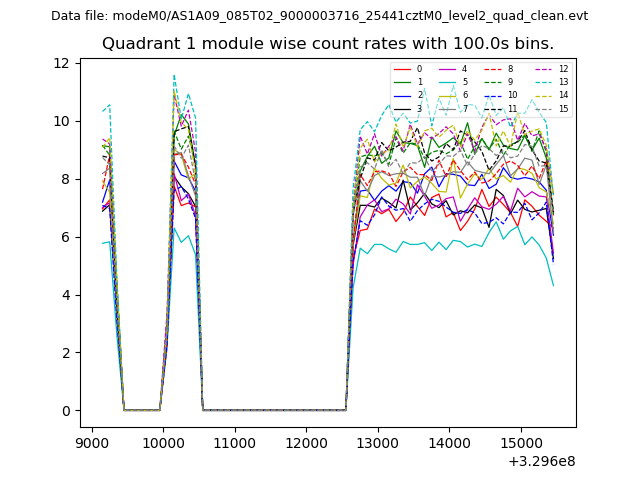
| Module-wise count rates for Quadrant A Data is divided into 100 sec bins |
 |
 |
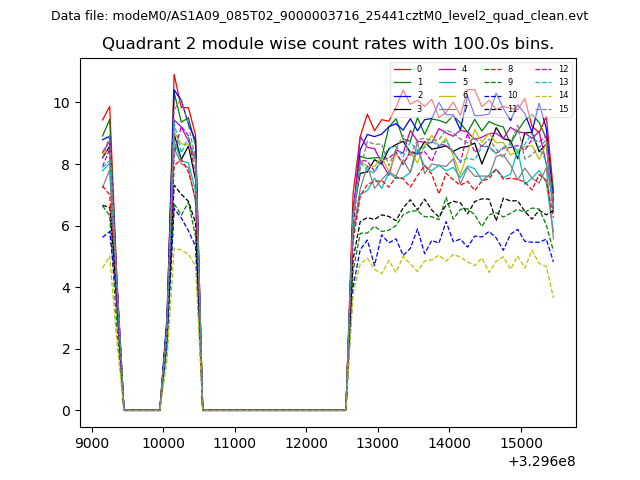
| Module-wise count rates for Quadrant B Data is divided into 100 sec bins |
 |
 |
| Module-wise count rates for Quadrant C Data is divided into 100 sec bins |
 |
 |
| Module-wise count rates for Quadrant D Data is divided into 100 sec bins |
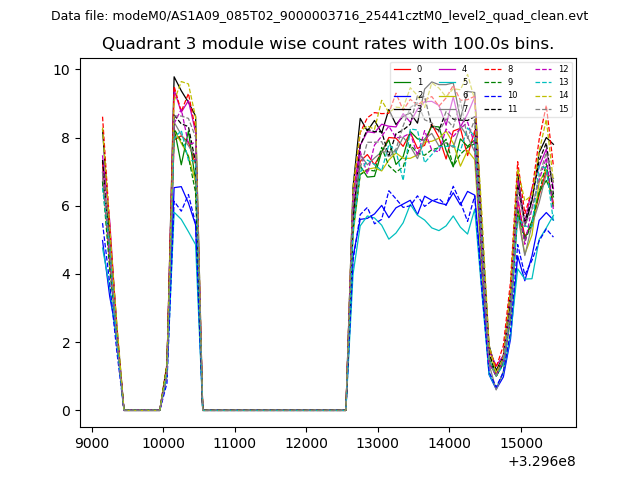 |
 |
| Parameter | Plot |
|---|---|
| CZT HV Monitor | 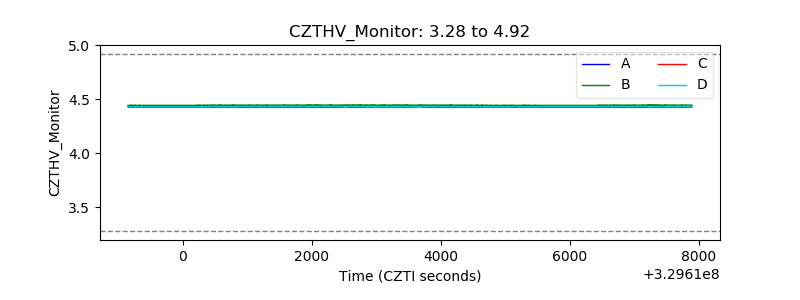 |
| D_VDD | 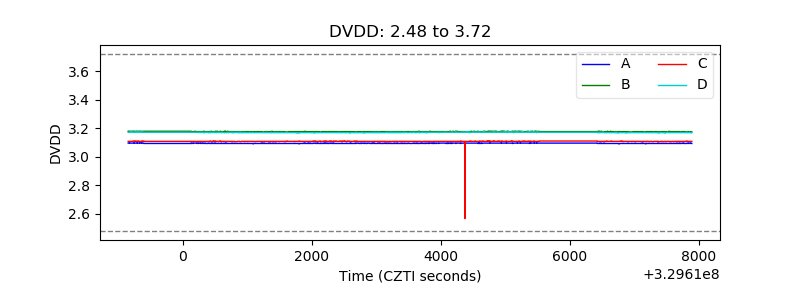 |
| Temperature 1 | 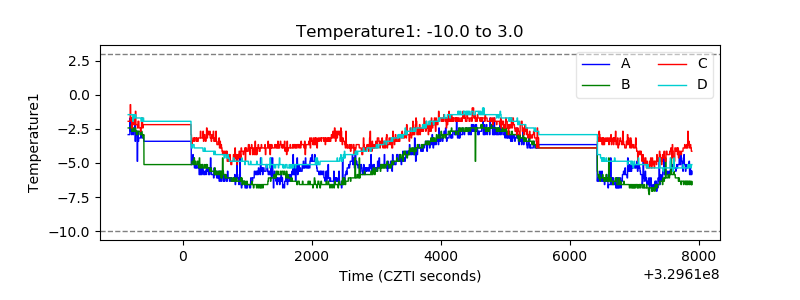 |
| Veto HV Monitor | 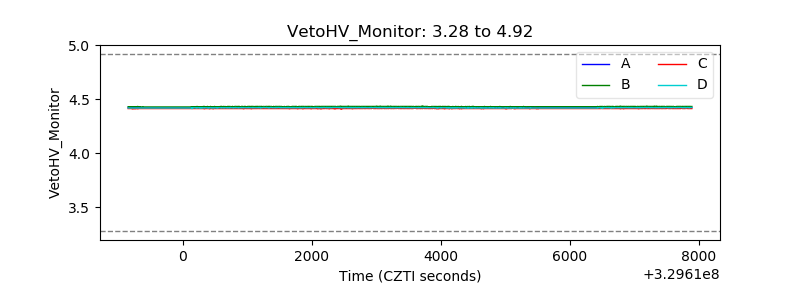 |
| Veto LLD | 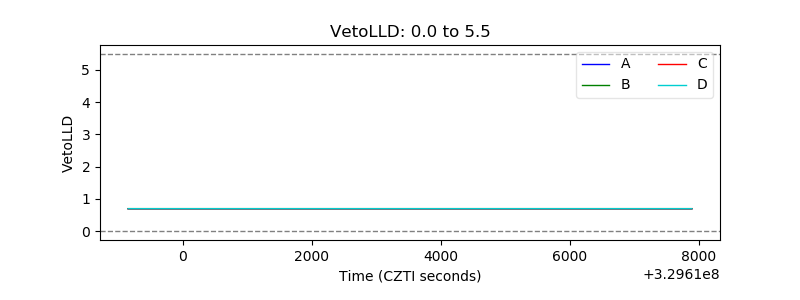 |
| Alpha Counter | 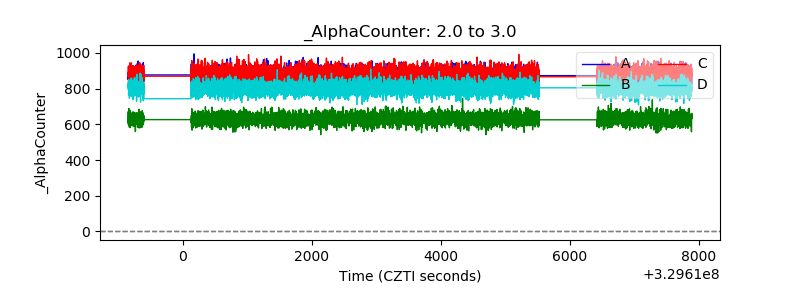 |
| _CPM_Rate | 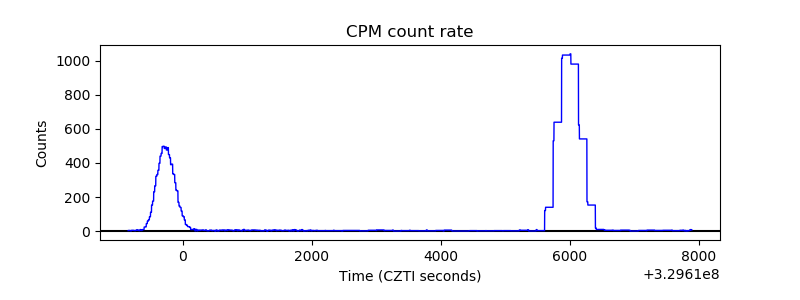 |
| CZT Counter | 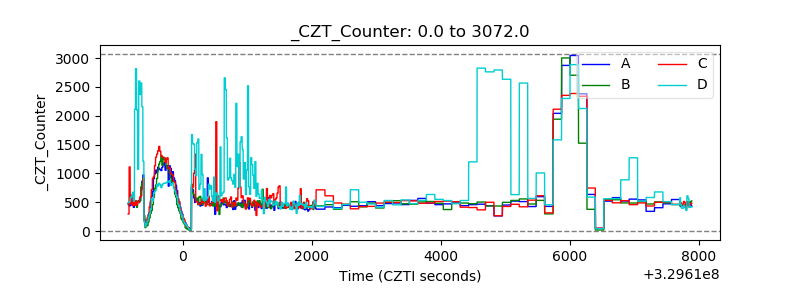 |
| +2.5 Volts monitor |  |
| +5 Volts monitor |  |
| _ROLL_ROT | 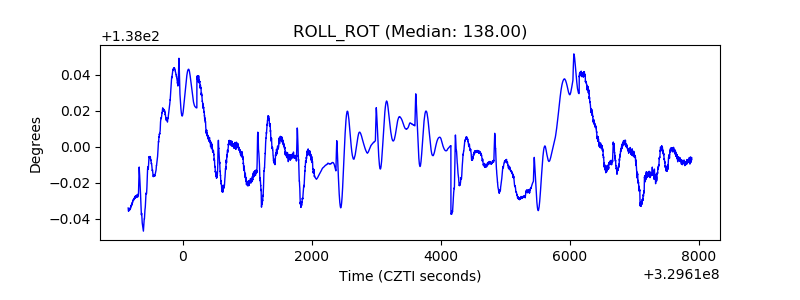 |
| _Roll_DEC | 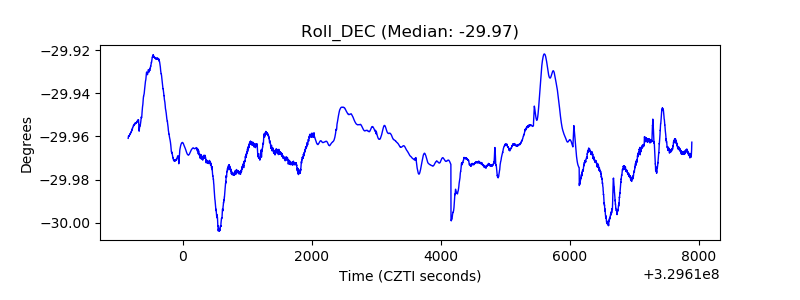 |
| _Roll_RA | 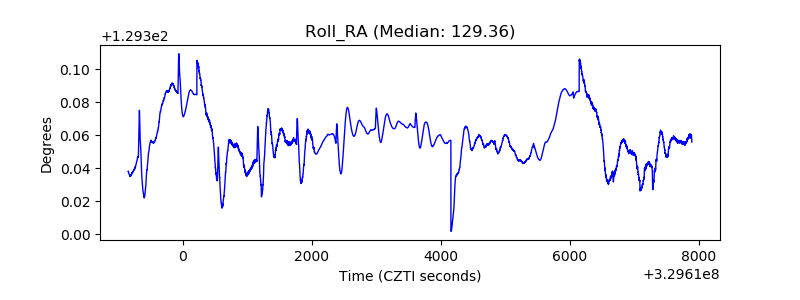 |
| Veto Counter | 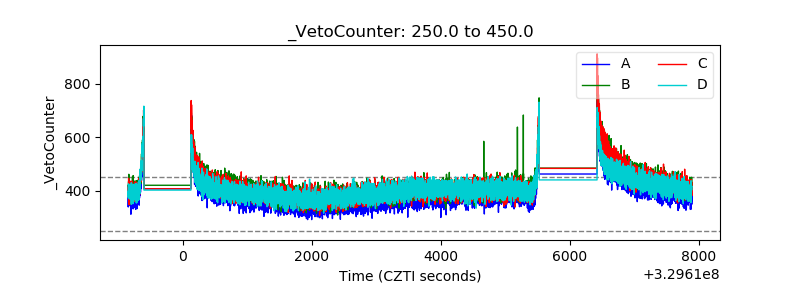 |