| Param | Original file | Final file |
|---|---|---|
| Filename | modeM0/AS1A09_085T02_9000003716_25444cztM0_level2.evt | modeM0/AS1A09_085T02_9000003716_25444cztM0_level2_quad_clean.evt |
| Size (bytes) | 511,102,080 | 78,428,160 |
| Size | 487.4 MB | 74.8 MB |
| Events in quadrant A | 3,388,499 | 493,503 |
| Events in quadrant B | 3,518,458 | 495,656 |
| Events in quadrant C | 3,868,000 | 471,892 |
| Events in quadrant D | 4,263,849 | 461,259 |
| Mode M9 | |||
|---|---|---|---|
| Quadrant | BADHDUFLAG | Total packets | Discarded packets |
| A | 0 | 12 | 0 |
| B | 0 | 13 | 0 |
| C | 0 | 13 | 0 |
| D | 0 | 13 | 0 |
| Mode M0 | |||
|---|---|---|---|
| Quadrant | BADHDUFLAG | Total packets | Discarded packets |
| A | 0 | 14042 | 0 |
| B | 0 | 14415 | 0 |
| C | 0 | 15530 | 0 |
| D | 0 | 16887 | 0 |
| Quadrant | Total seconds | Saturated seconds | Saturation percentage |
|---|---|---|---|
| A | 6487 | 60 | 0.924927% |
| B | 6487 | 115 | 1.772776% |
| C | 6486 | 162 | 2.497687% |
| D | 6486 | 143 | 2.204749% |
Noise dominated data is calculated using 1-second bins in cleaned event files. If a bin has >2000 counts, and if more than 50% of those come from <1% of pixels, then it is considered to be noise-dominated and hence unusable.
| Quadrant | # 1 sec bins | Bins with >0 counts | Bins with >2000 counts | High rate bins dominated by noise | Noise dominated (total time) | Noise dominated (detector-on time) | Marked lightcurve |
|---|---|---|---|---|---|---|---|
| A | 7641 | 6486 | 0 | 0 | 0.00% | 0.00% | 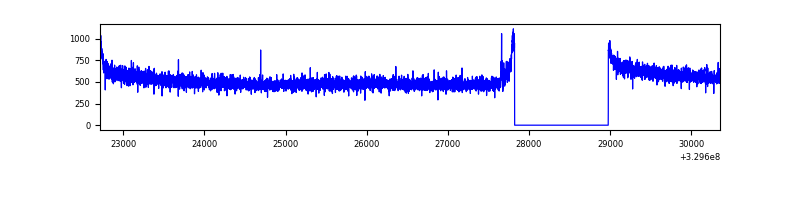 |
| B | 7641 | 6486 | 21 | 21 | 0.27% | 0.32% | 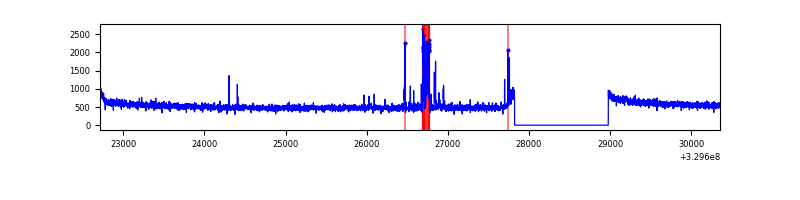 |
| C | 7640 | 6485 | 21 | 21 | 0.27% | 0.32% | 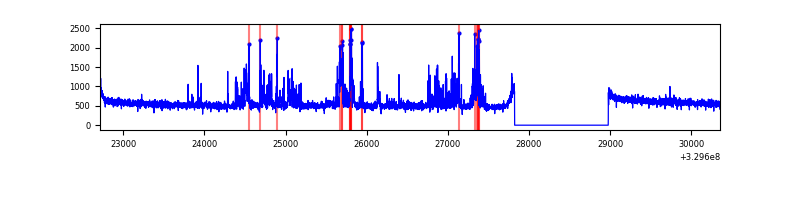 |
| D | 7640 | 6485 | 79 | 79 | 1.03% | 1.22% | 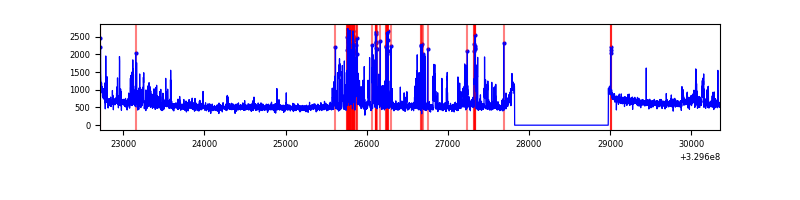 |
Top three noisy pixels from each quadrant. If the there are fewer than three noisy pixels in the level2.evt file, extra rows are filled as -1
| Pixel properties | Quadrant properties | ||||||
|---|---|---|---|---|---|---|---|
| Quadrant | DetID | PixID | Counts | Sigma | Mean | Median | Sigma |
| A | 0 | 247 | 9598 | 50.18 | 875 | 859 | 174.1 |
| A | 13 | 254 | 9391 | 48.99 | 875 | 859 | 174.1 |
| A | 15 | 173 | 8166 | 41.96 | 875 | 859 | 174.1 |
| B | 5 | 172 | 109734 | 678.47 | 863 | 844 | 160.5 |
| B | 12 | 111 | 19675 | 117.33 | 863 | 844 | 160.5 |
| B | 11 | 111 | 17522 | 103.92 | 863 | 844 | 160.5 |
| C | 9 | 54 | 477504 | 2449.88 | 835 | 842 | 194.6 |
| C | 14 | 238 | 137269 | 701.19 | 835 | 842 | 194.6 |
| C | 13 | 61 | 5802 | 25.49 | 835 | 842 | 194.6 |
| D | 1 | 52 | 784928 | 3885.24 | 842 | 819 | 201.8 |
| D | 8 | 195 | 186841 | 921.73 | 842 | 819 | 201.8 |
| D | 2 | 72 | 49973 | 243.56 | 842 | 819 | 201.8 |
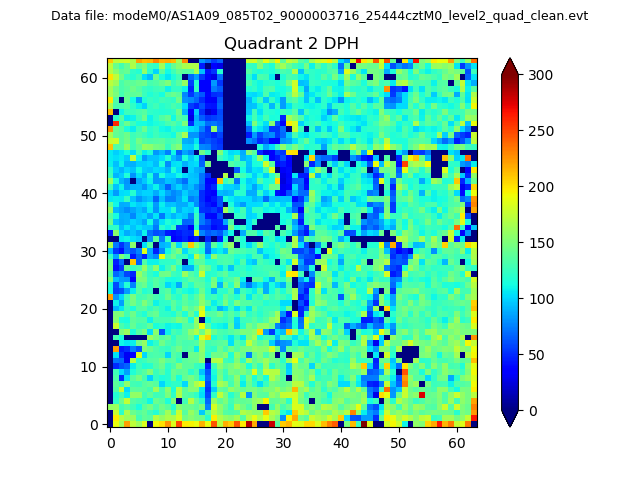
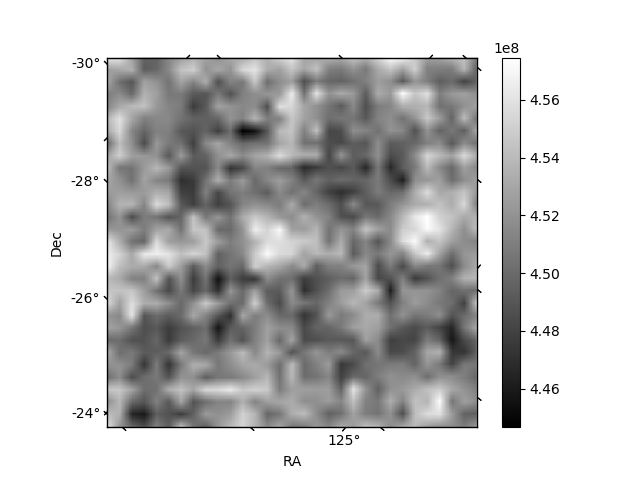
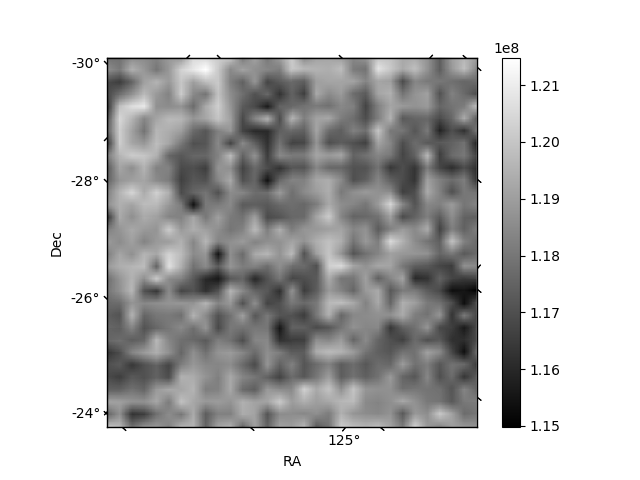
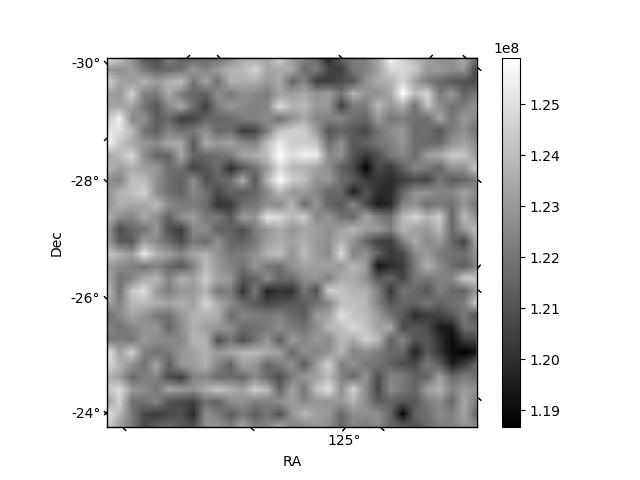
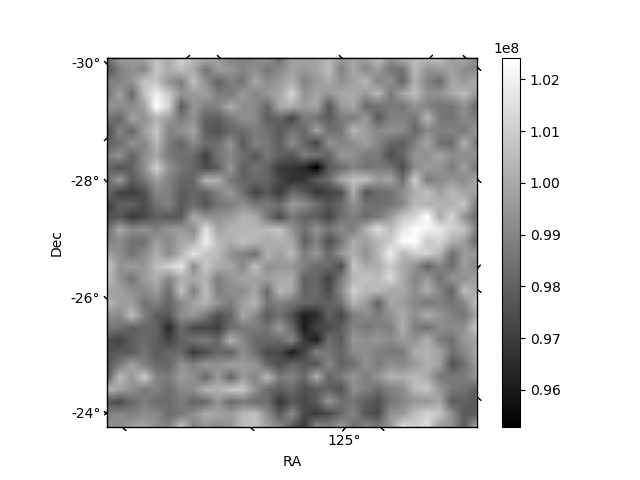
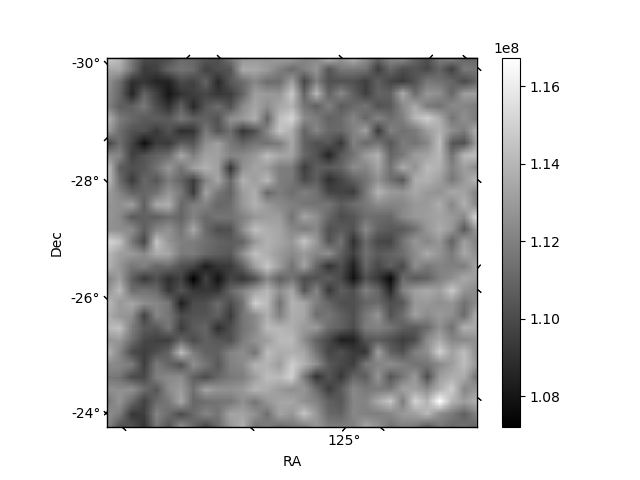
Histogram calculated using DETX and DETY for each event in the final _common_clean file
| Quadrant A | 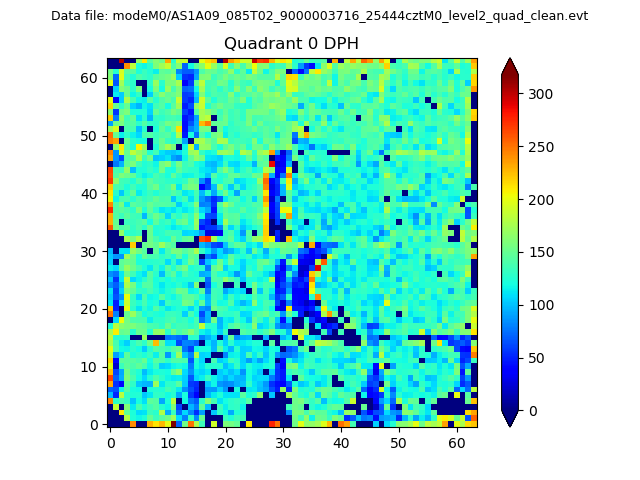 |
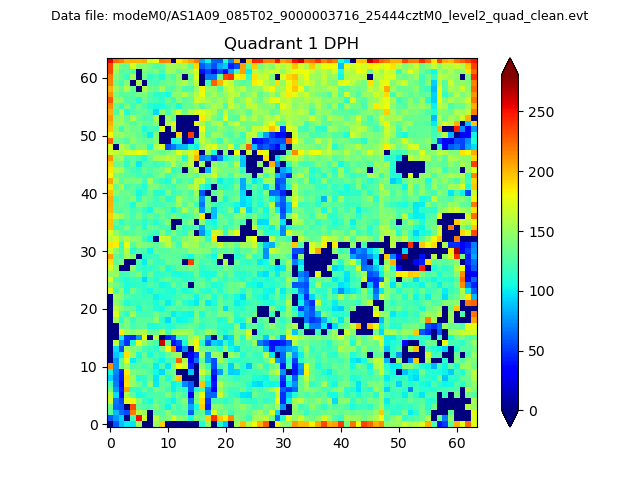 |
Quadrant B |
|---|---|---|---|
| Quadrant D | 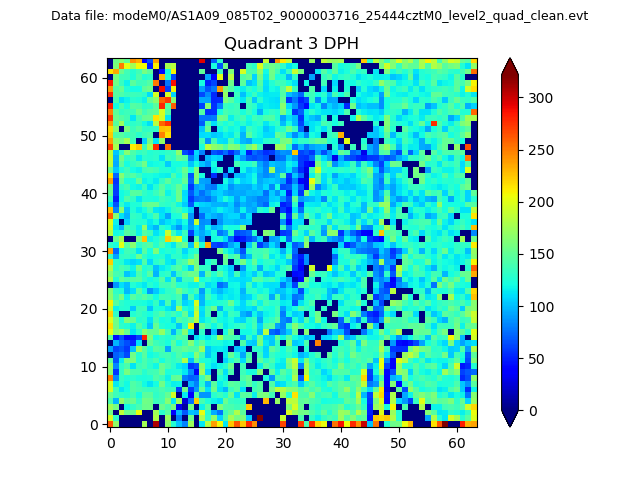 |
 |
Quadrant C |
| Plot type | Count rate plots | Images |
|---|---|---|
| Comparison with Poisson distribution Blue bars denote a histogram of data divided into 1 sec bins. Red curve is a Poisson curve with rate = median count rate of data. |
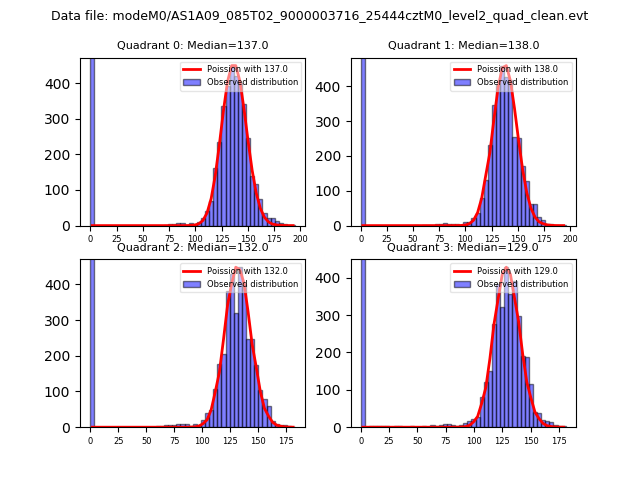 |
 |
| Quadrant-wise count rates Data is divided into 100 sec bins |
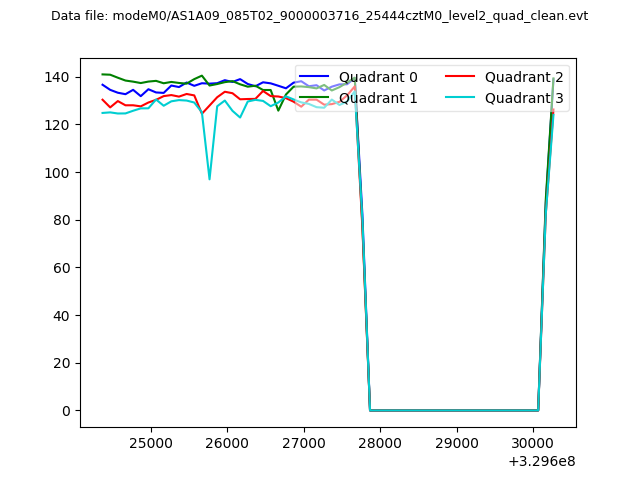 |
|
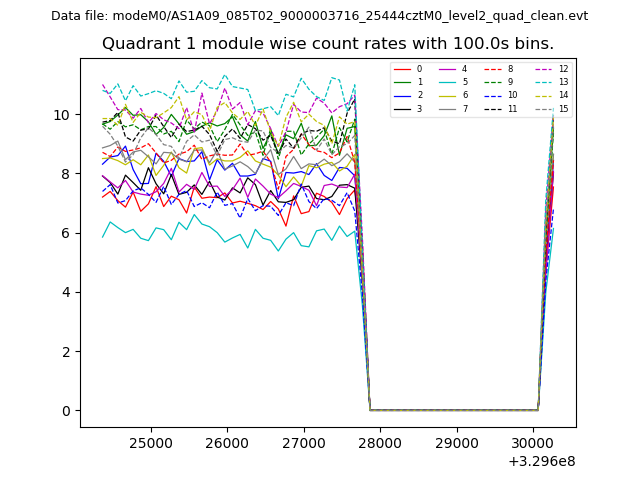
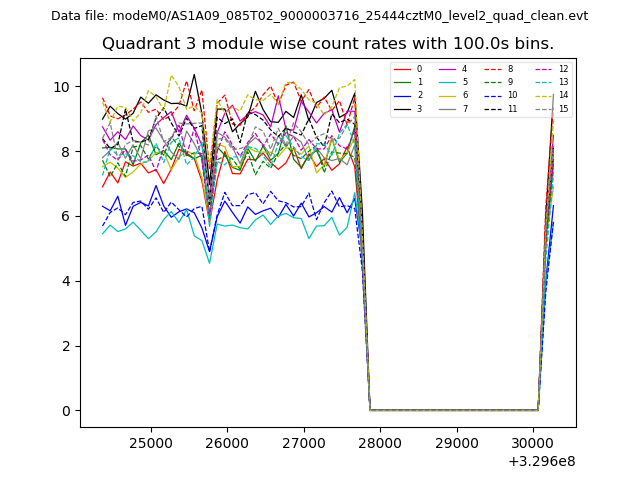
| Module-wise count rates for Quadrant A Data is divided into 100 sec bins |
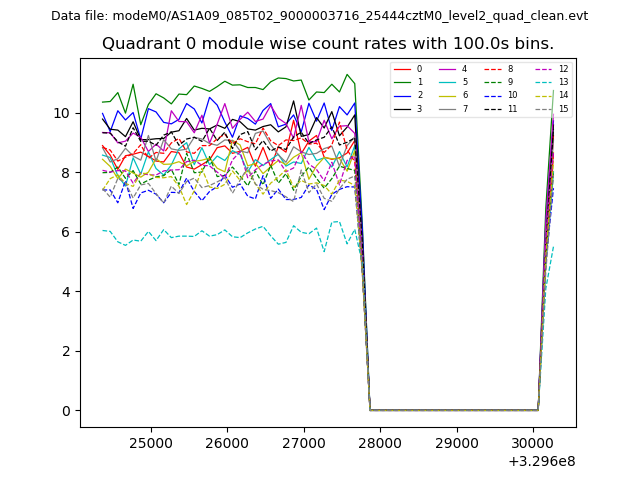 |
 |
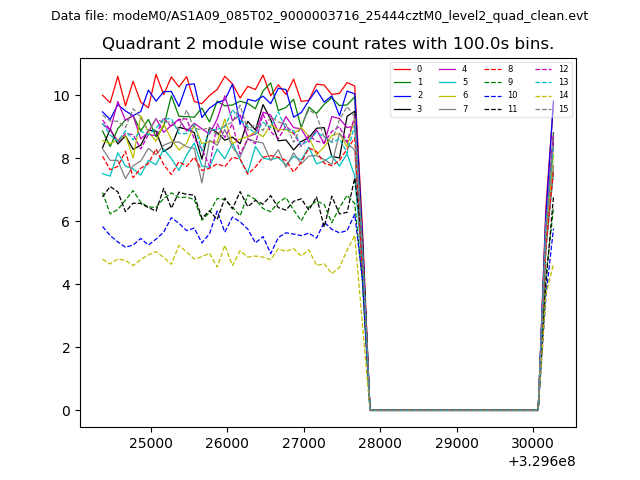
| Module-wise count rates for Quadrant B Data is divided into 100 sec bins |
 |
 |
| Module-wise count rates for Quadrant C Data is divided into 100 sec bins |
 |
 |
| Module-wise count rates for Quadrant D Data is divided into 100 sec bins |
 |
 |
| Parameter | Plot |
|---|---|
| CZT HV Monitor | 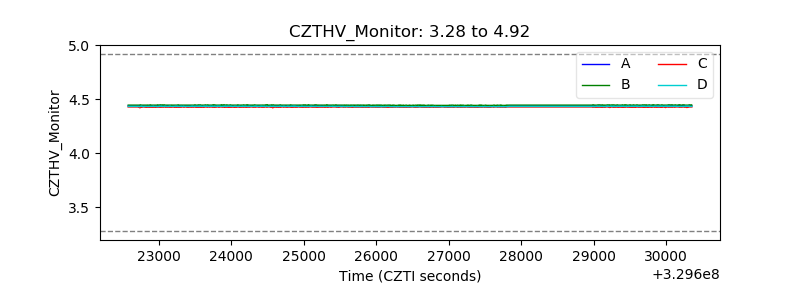 |
| D_VDD | 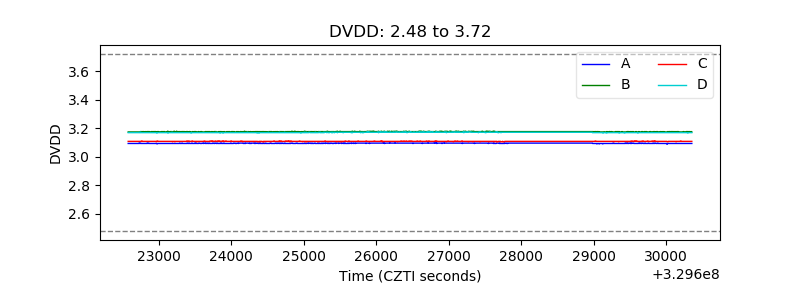 |
| Temperature 1 | 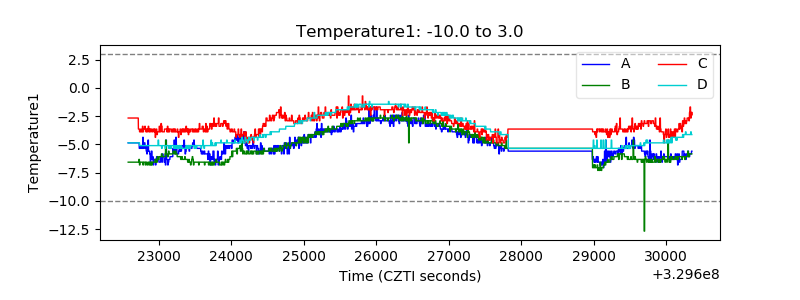 |
| Veto HV Monitor | 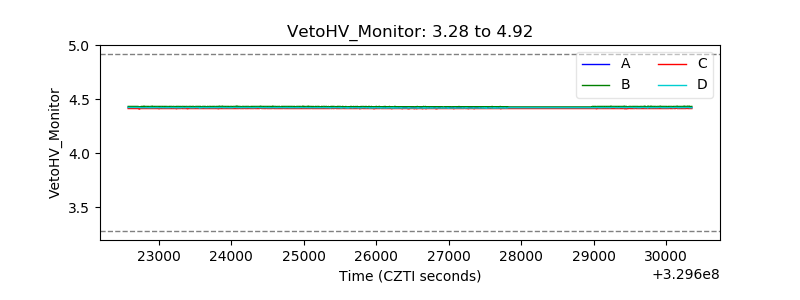 |
| Veto LLD | 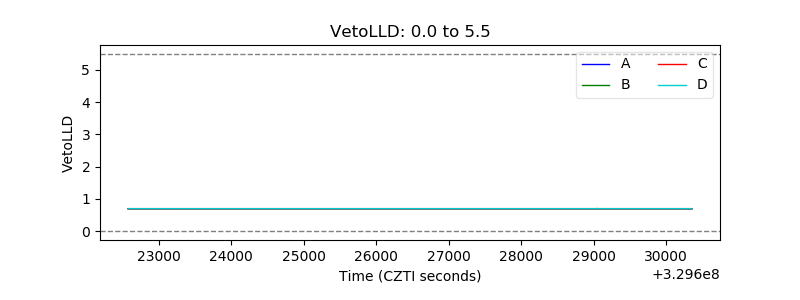 |
| Alpha Counter | 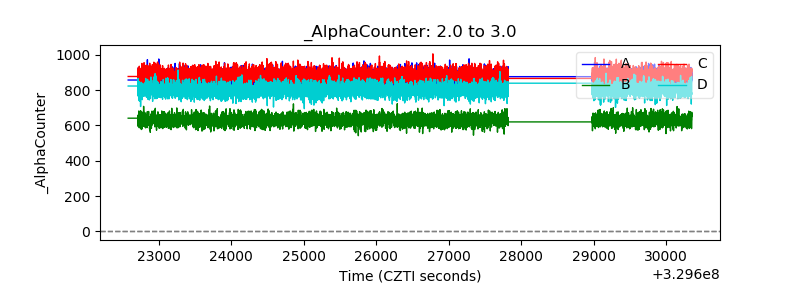 |
| _CPM_Rate | 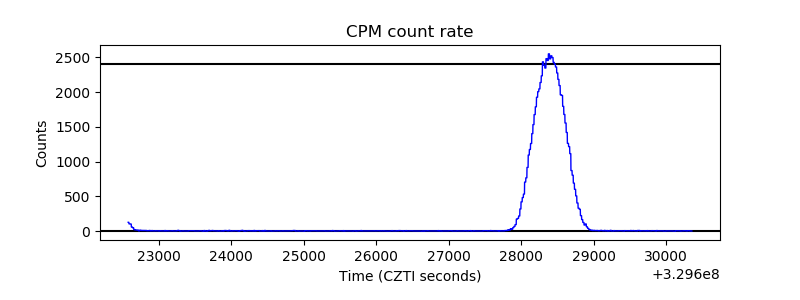 |
| CZT Counter | 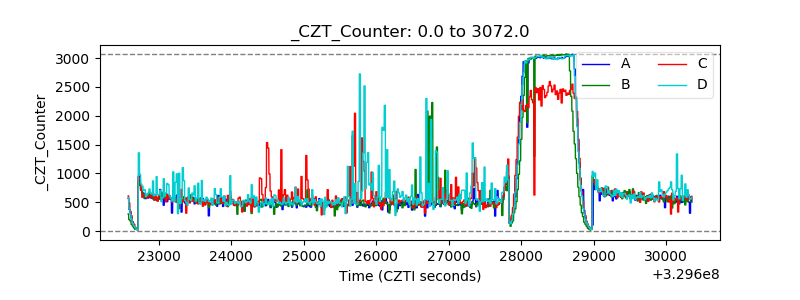 |
| +2.5 Volts monitor | 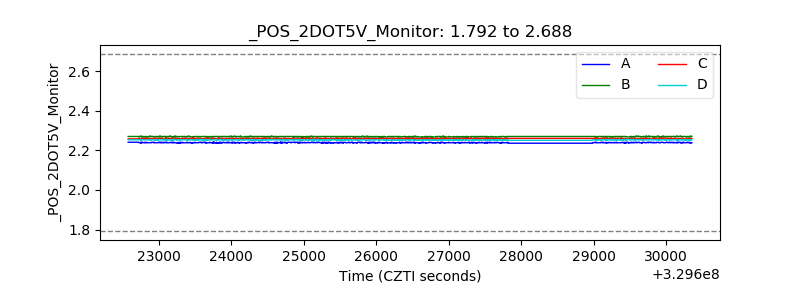 |
| +5 Volts monitor | 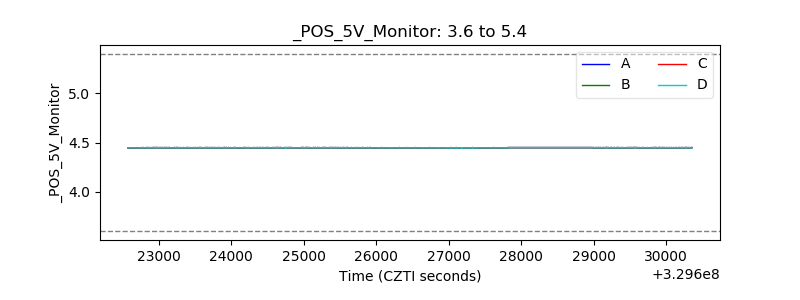 |
| _ROLL_ROT | 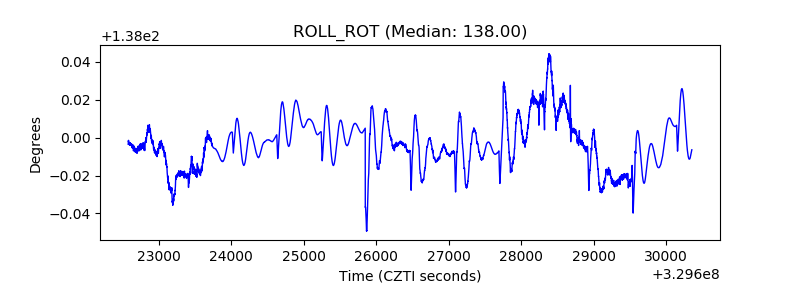 |
| _Roll_DEC | 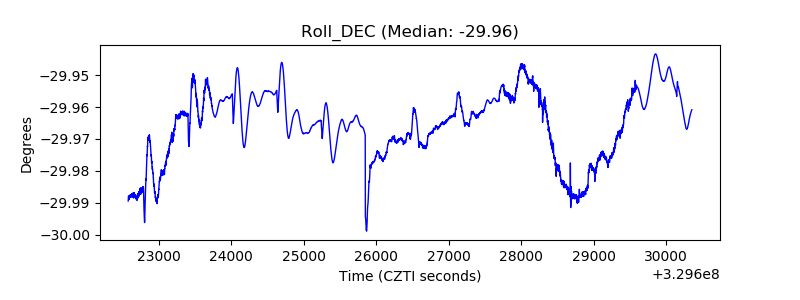 |
| _Roll_RA | 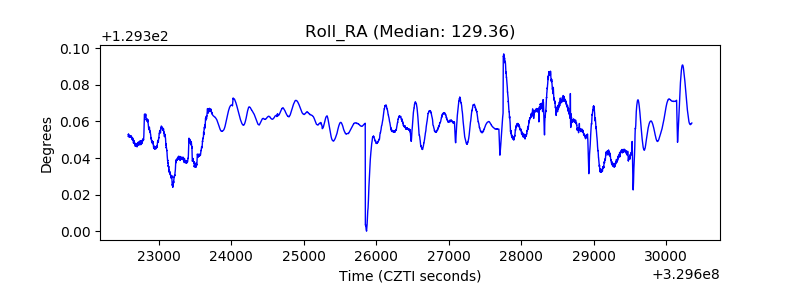 |
| Veto Counter | 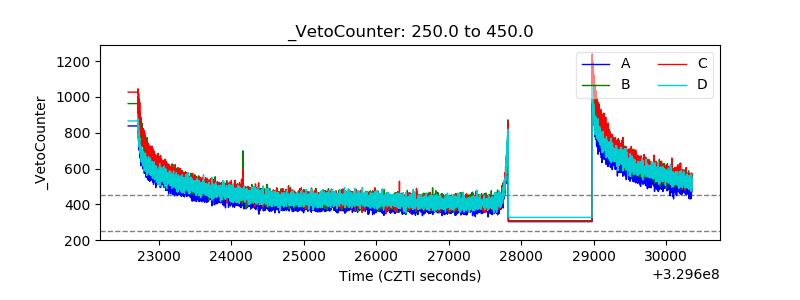 |