| Param | Original file | Final file |
|---|---|---|
| Filename | modeM0/AS1A09_085T02_9000003716_25446cztM0_level2.evt | modeM0/AS1A09_085T02_9000003716_25446cztM0_level2_quad_clean.evt |
| Size (bytes) | 533,188,800 | 109,359,360 |
| Size | 508.5 MB | 104.3 MB |
| Events in quadrant A | 3,452,624 | 744,643 |
| Events in quadrant B | 3,526,075 | 747,534 |
| Events in quadrant C | 3,574,222 | 718,981 |
| Events in quadrant D | 5,186,930 | 680,218 |
| Mode M9 | |||
|---|---|---|---|
| Quadrant | BADHDUFLAG | Total packets | Discarded packets |
| A | 0 | 13 | 0 |
| B | 0 | 13 | 0 |
| C | 0 | 13 | 0 |
| D | 0 | 13 | 0 |
| Mode M0 | |||
|---|---|---|---|
| Quadrant | BADHDUFLAG | Total packets | Discarded packets |
| A | 0 | 14293 | 0 |
| B | 0 | 14372 | 0 |
| C | 0 | 14684 | 0 |
| D | 0 | 19597 | 0 |
| Quadrant | Total seconds | Saturated seconds | Saturation percentage |
|---|---|---|---|
| A | 6023 | 81 | 1.344845% |
| B | 6024 | 102 | 1.693227% |
| C | 6024 | 183 | 3.037849% |
| D | 6023 | 479 | 7.952847% |
Noise dominated data is calculated using 1-second bins in cleaned event files. If a bin has >2000 counts, and if more than 50% of those come from <1% of pixels, then it is considered to be noise-dominated and hence unusable.
| Quadrant | # 1 sec bins | Bins with >0 counts | Bins with >2000 counts | High rate bins dominated by noise | Noise dominated (total time) | Noise dominated (detector-on time) | Marked lightcurve |
|---|---|---|---|---|---|---|---|
| A | 7357 | 6023 | 0 | 0 | 0.00% | 0.00% | 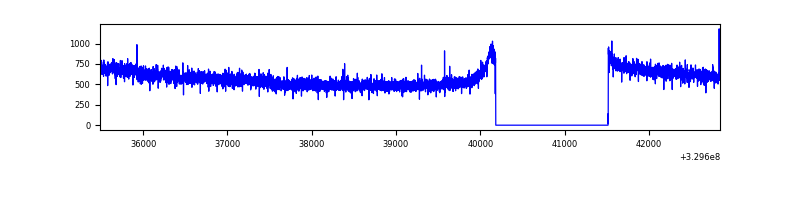 |
| B | 7358 | 6024 | 2 | 2 | 0.03% | 0.03% | 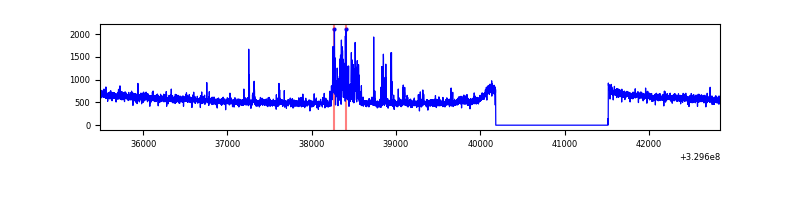 |
| C | 7358 | 6024 | 14 | 14 | 0.19% | 0.23% | 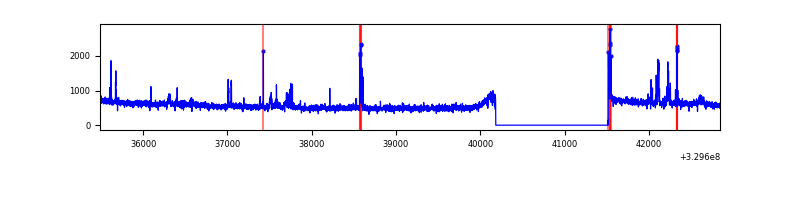 |
| D | 7357 | 6023 | 394 | 394 | 5.36% | 6.54% | 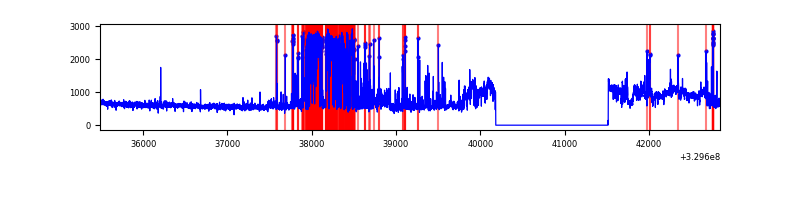 |
Top three noisy pixels from each quadrant. If the there are fewer than three noisy pixels in the level2.evt file, extra rows are filled as -1
| Pixel properties | Quadrant properties | ||||||
|---|---|---|---|---|---|---|---|
| Quadrant | DetID | PixID | Counts | Sigma | Mean | Median | Sigma |
| A | 6 | 16 | 103999 | 600.62 | 869 | 853 | 171.7 |
| A | 13 | 254 | 8461 | 44.3 | 869 | 853 | 171.7 |
| A | 0 | 226 | 7517 | 38.8 | 869 | 853 | 171.7 |
| B | 3 | 112 | 195773 | 1248.82 | 846 | 829 | 156.1 |
| B | 0 | 190 | 21702 | 133.71 | 846 | 829 | 156.1 |
| B | 12 | 111 | 18490 | 113.14 | 846 | 829 | 156.1 |
| C | 9 | 54 | 139018 | 731.03 | 828 | 838 | 189.0 |
| C | 14 | 238 | 136503 | 717.72 | 828 | 838 | 189.0 |
| C | 7 | 87 | 58063 | 302.74 | 828 | 838 | 189.0 |
| D | 1 | 52 | 1620690 | 8191.23 | 830 | 809 | 197.8 |
| D | 8 | 195 | 149721 | 753.0 | 830 | 809 | 197.8 |
| D | 7 | 238 | 144190 | 725.03 | 830 | 809 | 197.8 |
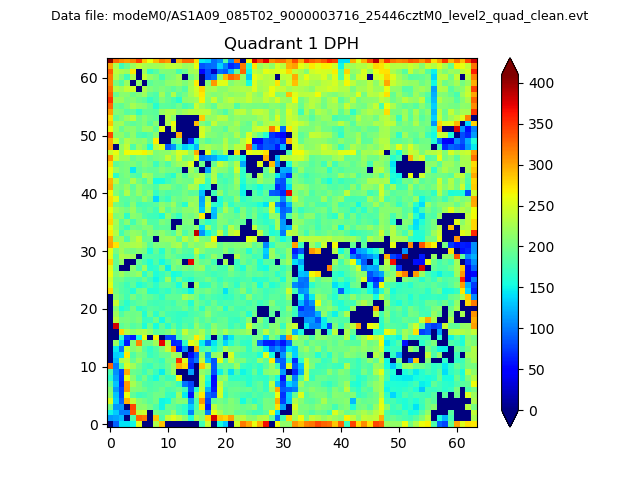
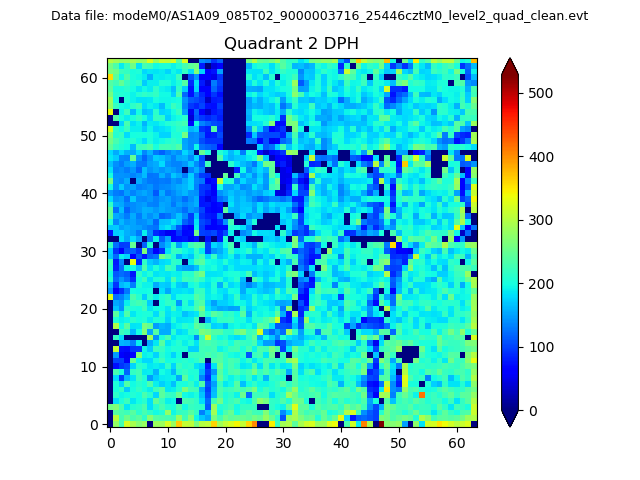
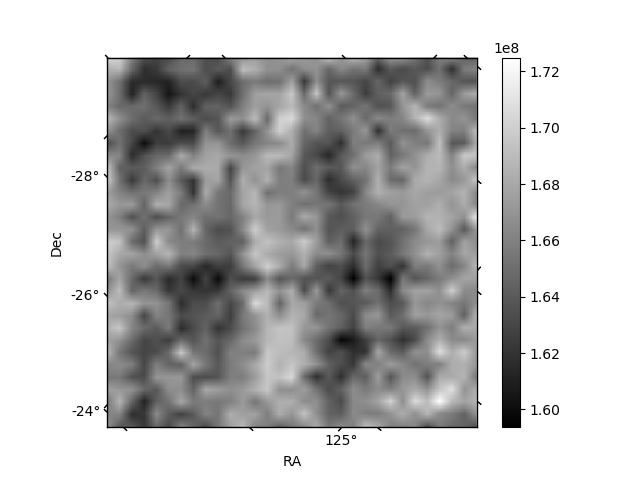
Histogram calculated using DETX and DETY for each event in the final _common_clean file
| Quadrant A |  |
 |
Quadrant B |
|---|---|---|---|
| Quadrant D | 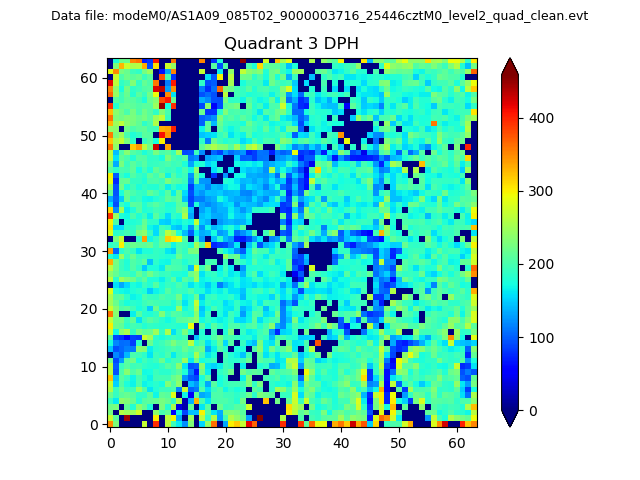 |
 |
Quadrant C |
| Plot type | Count rate plots | Images |
|---|---|---|
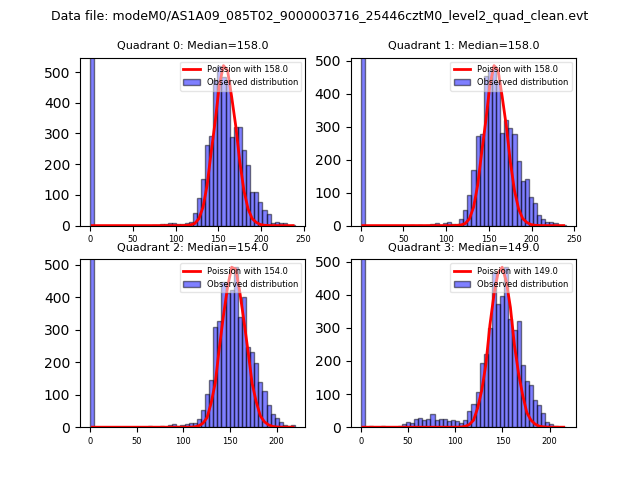
| Comparison with Poisson distribution Blue bars denote a histogram of data divided into 1 sec bins. Red curve is a Poisson curve with rate = median count rate of data. |
 |
 |
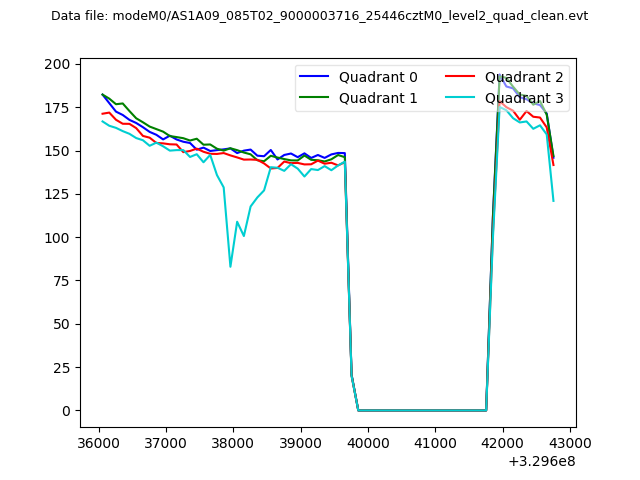
| Quadrant-wise count rates Data is divided into 100 sec bins |
 |
|
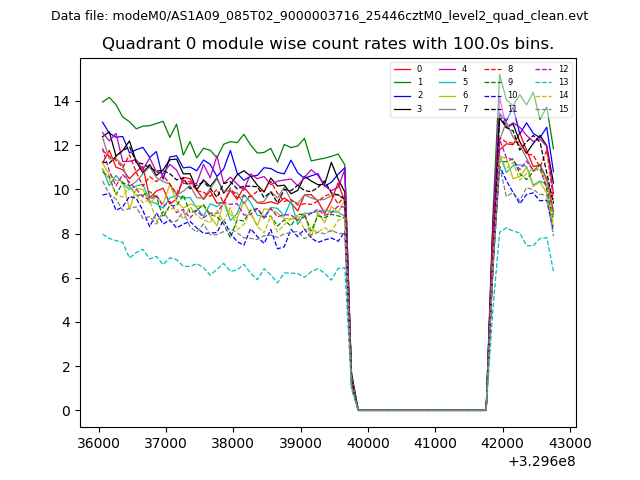
| Module-wise count rates for Quadrant A Data is divided into 100 sec bins |
 |
 |
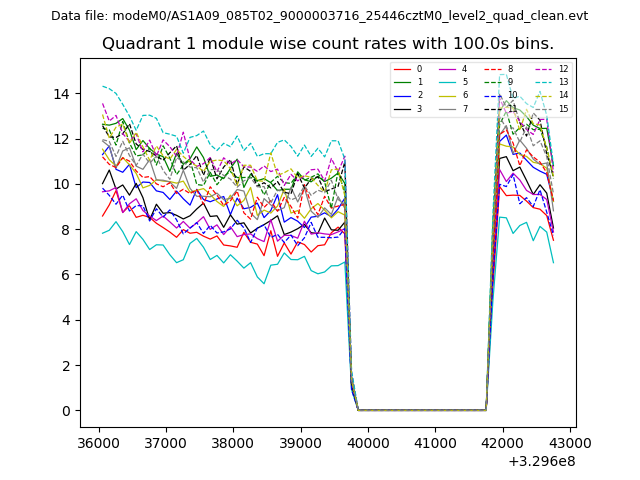
| Module-wise count rates for Quadrant B Data is divided into 100 sec bins |
 |
 |
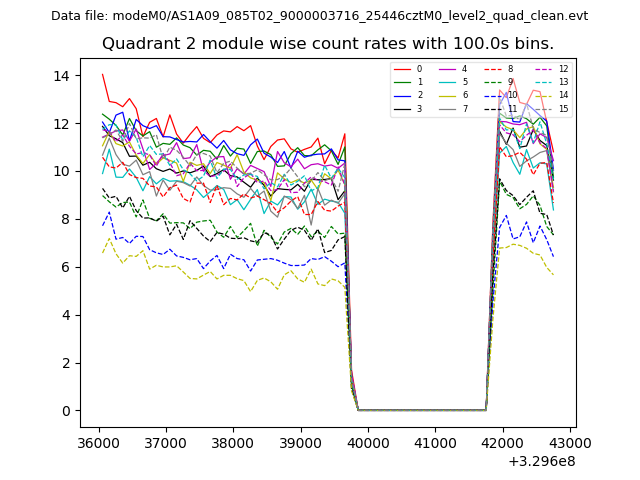
| Module-wise count rates for Quadrant C Data is divided into 100 sec bins |
 |
 |
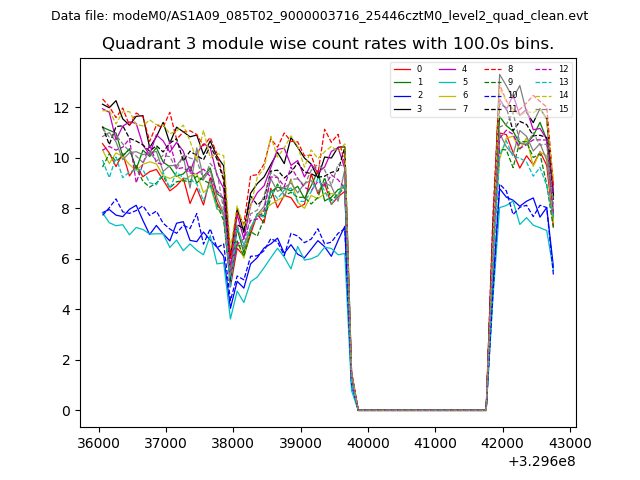
| Module-wise count rates for Quadrant D Data is divided into 100 sec bins |
 |
 |
| Parameter | Plot |
|---|---|
| CZT HV Monitor | 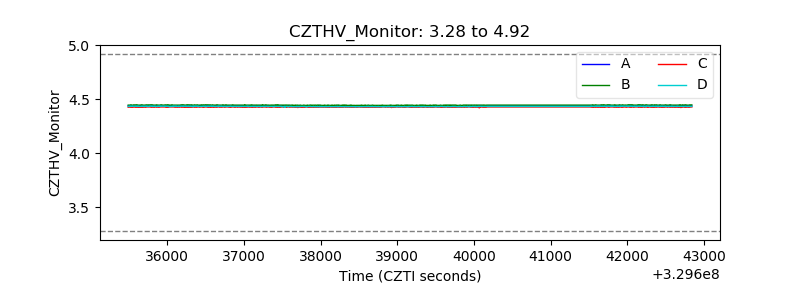 |
| D_VDD | 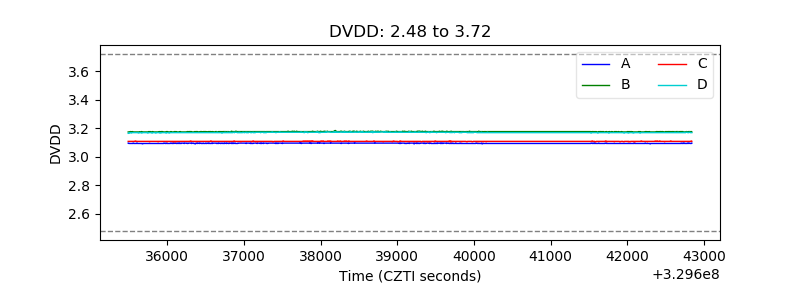 |
| Temperature 1 | 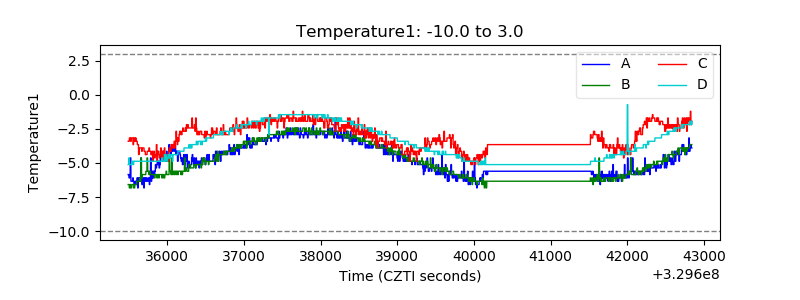 |
| Veto HV Monitor | 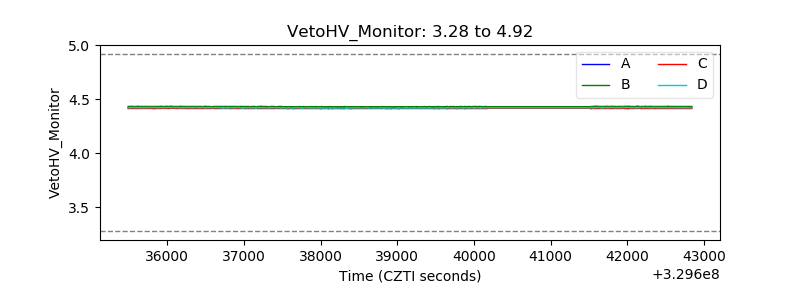 |
| Veto LLD | 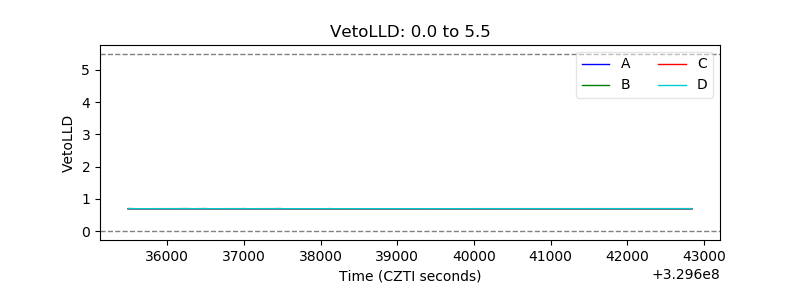 |
| Alpha Counter | 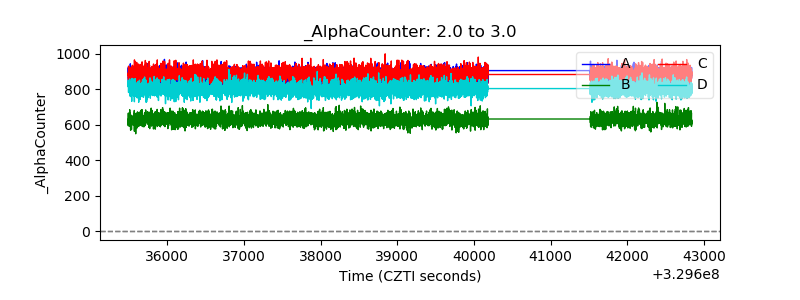 |
| _CPM_Rate | 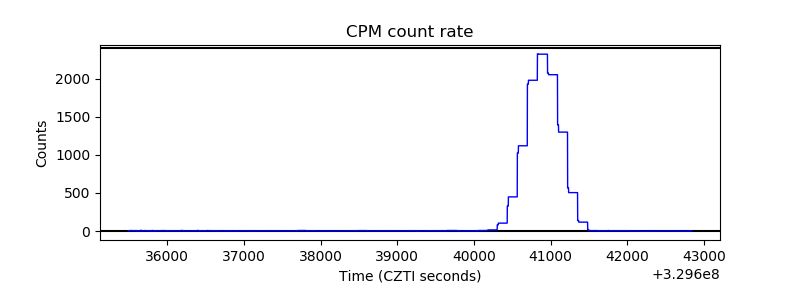 |
| CZT Counter | 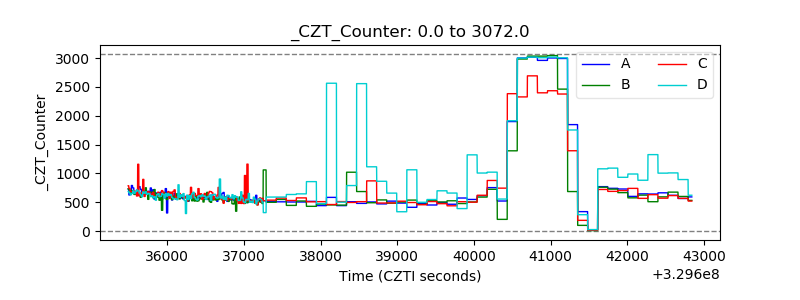 |
| +2.5 Volts monitor |  |
| +5 Volts monitor |  |
| _ROLL_ROT | 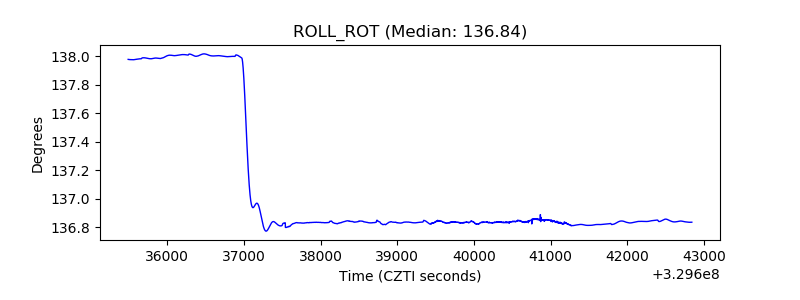 |
| _Roll_DEC | 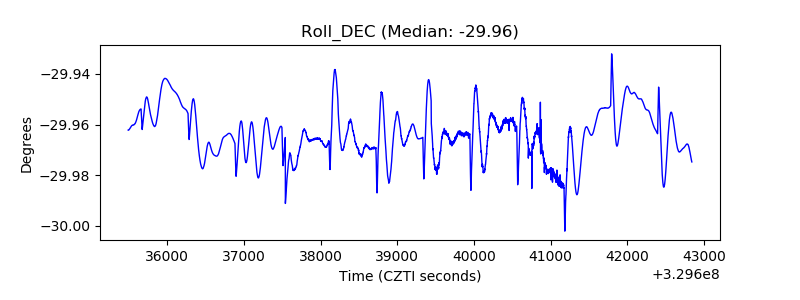 |
| _Roll_RA | 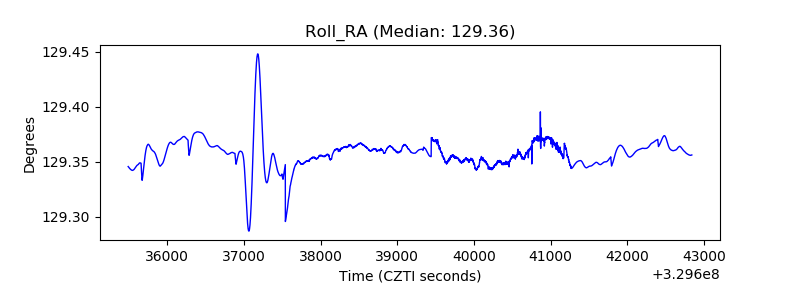 |
| Veto Counter | 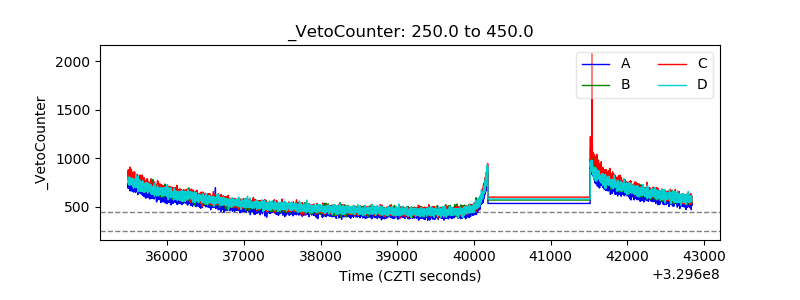 |