| Param | Original file | Final file |
|---|---|---|
| Filename | modeM0/AS1A09_085T02_9000003716_25447cztM0_level2.evt | modeM0/AS1A09_085T02_9000003716_25447cztM0_level2_quad_clean.evt |
| Size (bytes) | 541,221,120 | 125,003,520 |
| Size | 516.1 MB | 119.2 MB |
| Events in quadrant A | 3,449,515 | 867,578 |
| Events in quadrant B | 3,292,630 | 866,699 |
| Events in quadrant C | 3,439,549 | 828,018 |
| Events in quadrant D | 5,795,956 | 797,700 |
| Mode M9 | |||
|---|---|---|---|
| Quadrant | BADHDUFLAG | Total packets | Discarded packets |
| A | 0 | 13 | 0 |
| B | 0 | 13 | 0 |
| C | 0 | 13 | 0 |
| D | 0 | 13 | 0 |
| Mode M0 | |||
|---|---|---|---|
| Quadrant | BADHDUFLAG | Total packets | Discarded packets |
| A | 0 | 14298 | 0 |
| B | 0 | 13479 | 0 |
| C | 0 | 14090 | 0 |
| D | 0 | 21514 | 0 |
| Quadrant | Total seconds | Saturated seconds | Saturation percentage |
|---|---|---|---|
| A | 6098 | 77 | 1.262709% |
| B | 6099 | 106 | 1.737990% |
| C | 6099 | 161 | 2.639777% |
| D | 6098 | 331 | 5.428009% |
Noise dominated data is calculated using 1-second bins in cleaned event files. If a bin has >2000 counts, and if more than 50% of those come from <1% of pixels, then it is considered to be noise-dominated and hence unusable.
| Quadrant | # 1 sec bins | Bins with >0 counts | Bins with >2000 counts | High rate bins dominated by noise | Noise dominated (total time) | Noise dominated (detector-on time) | Marked lightcurve |
|---|---|---|---|---|---|---|---|
| A | 7434 | 6100 | 0 | 0 | 0.00% | 0.00% |  |
| B | 7435 | 6101 | 2 | 2 | 0.03% | 0.03% |  |
| C | 7435 | 6101 | 6 | 6 | 0.08% | 0.10% |  |
| D | 7434 | 6100 | 254 | 254 | 3.42% | 4.16% | 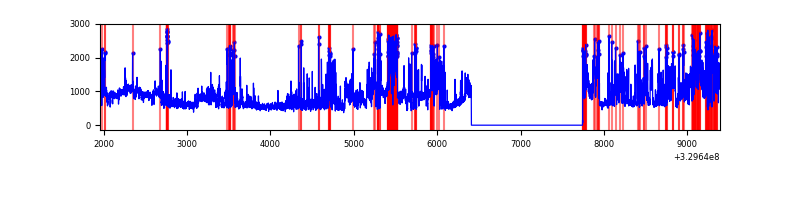 |
Top three noisy pixels from each quadrant. If the there are fewer than three noisy pixels in the level2.evt file, extra rows are filled as -1
| Pixel properties | Quadrant properties | ||||||
|---|---|---|---|---|---|---|---|
| Quadrant | DetID | PixID | Counts | Sigma | Mean | Median | Sigma |
| A | 6 | 16 | 130037 | 753.64 | 860 | 848 | 171.4 |
| A | 13 | 254 | 8405 | 44.08 | 860 | 848 | 171.4 |
| A | 0 | 226 | 7545 | 39.07 | 860 | 848 | 171.4 |
| B | 12 | 111 | 18019 | 109.89 | 834 | 813 | 156.6 |
| B | 11 | 111 | 16491 | 100.13 | 834 | 813 | 156.6 |
| B | 14 | 111 | 15269 | 92.32 | 834 | 813 | 156.6 |
| C | 14 | 238 | 133728 | 701.89 | 816 | 825 | 189.3 |
| C | 9 | 54 | 115775 | 607.08 | 816 | 825 | 189.3 |
| C | 13 | 61 | 5524 | 24.82 | 816 | 825 | 189.3 |
| D | 1 | 52 | 2311251 | 11698.71 | 828 | 808 | 197.5 |
| D | 8 | 195 | 156560 | 788.64 | 828 | 808 | 197.5 |
| D | 7 | 238 | 112535 | 565.72 | 828 | 808 | 197.5 |
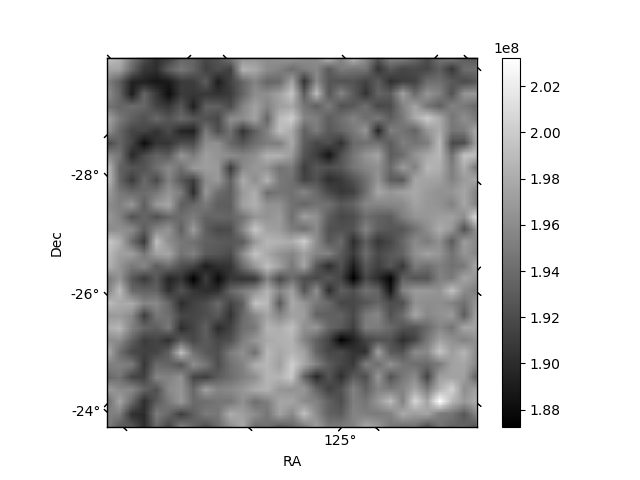
Histogram calculated using DETX and DETY for each event in the final _common_clean file
| Quadrant A | 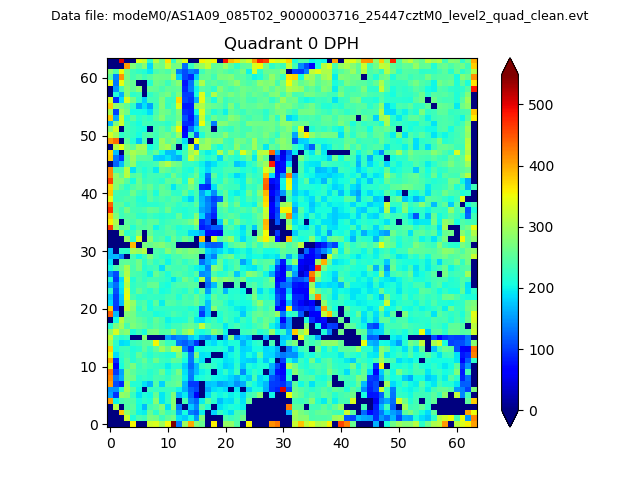 |
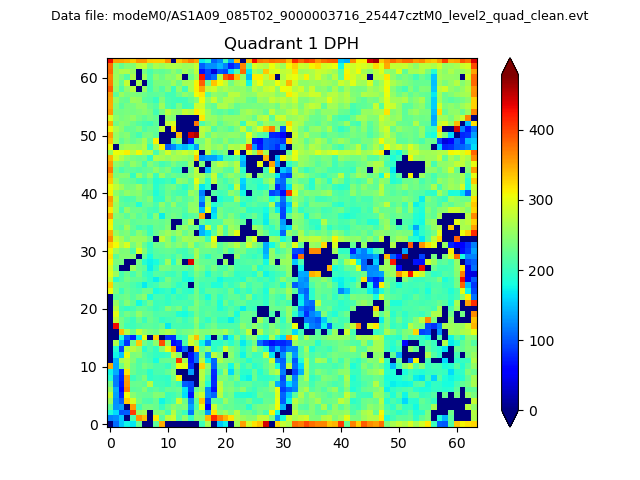 |
Quadrant B |
|---|---|---|---|
| Quadrant D | 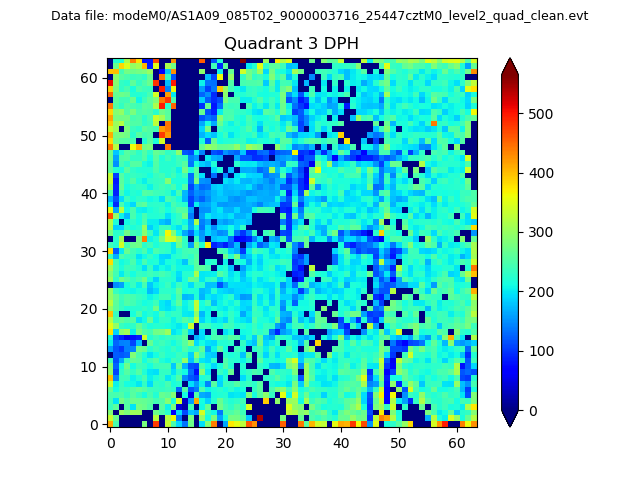 |
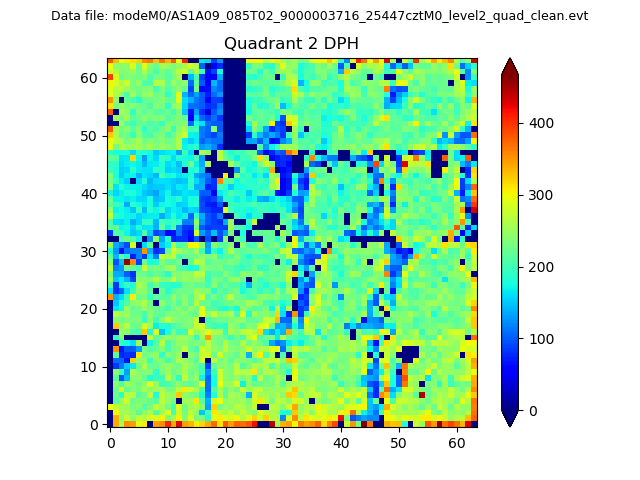 |
Quadrant C |
| Plot type | Count rate plots | Images |
|---|---|---|
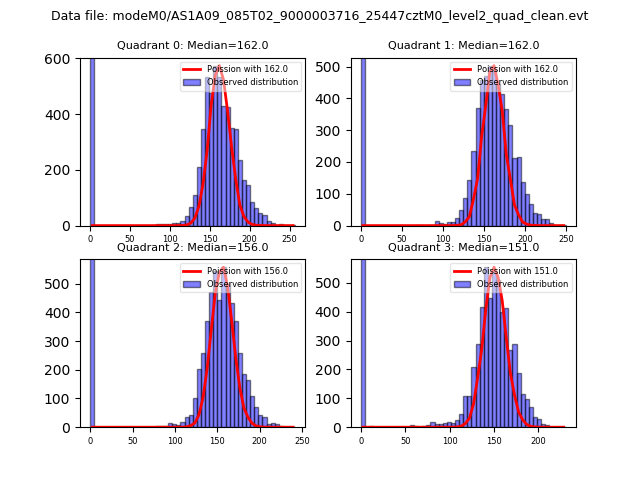
| Comparison with Poisson distribution Blue bars denote a histogram of data divided into 1 sec bins. Red curve is a Poisson curve with rate = median count rate of data. |
 |
 |
| Quadrant-wise count rates Data is divided into 100 sec bins |
 |
|
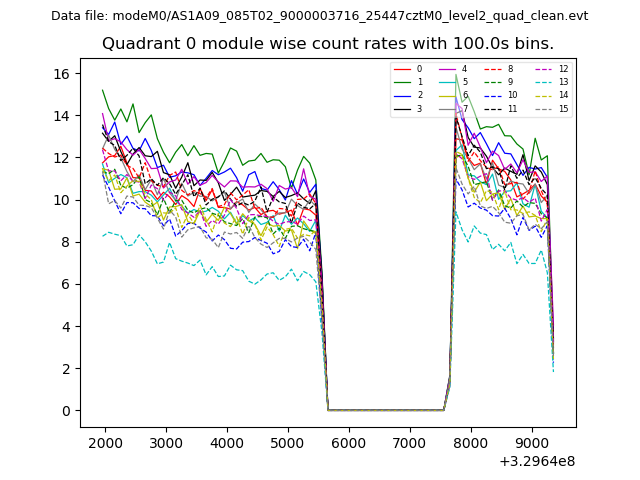
| Module-wise count rates for Quadrant A Data is divided into 100 sec bins |
 |
 |
| Module-wise count rates for Quadrant B Data is divided into 100 sec bins |
 |
 |
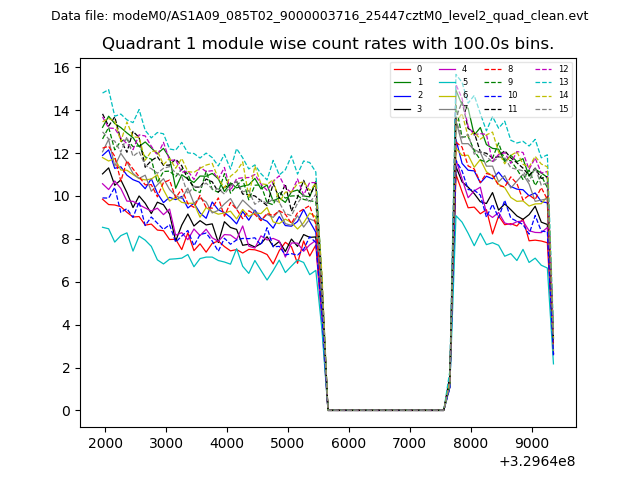
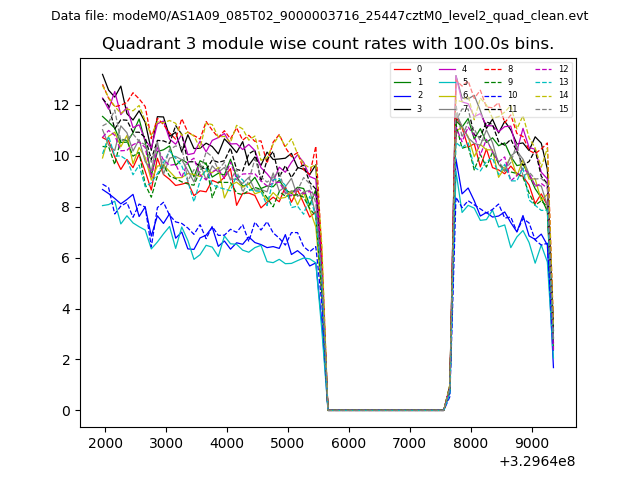
| Module-wise count rates for Quadrant C Data is divided into 100 sec bins |
 |
 |
| Module-wise count rates for Quadrant D Data is divided into 100 sec bins |
 |
 |
| Parameter | Plot |
|---|---|
| CZT HV Monitor | 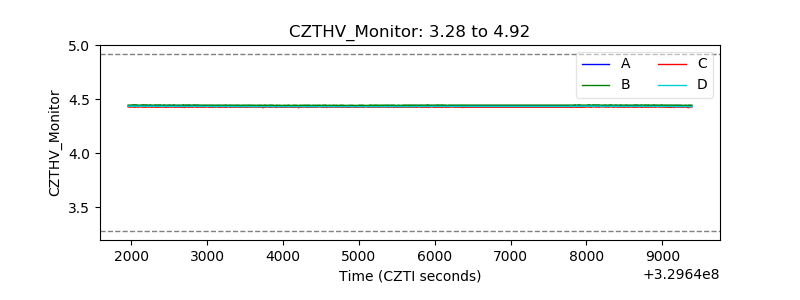 |
| D_VDD | 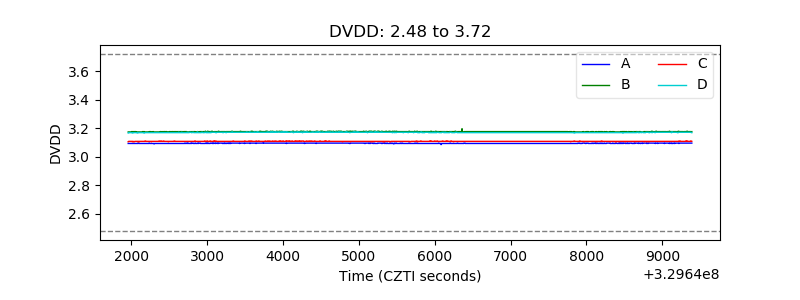 |
| Temperature 1 | 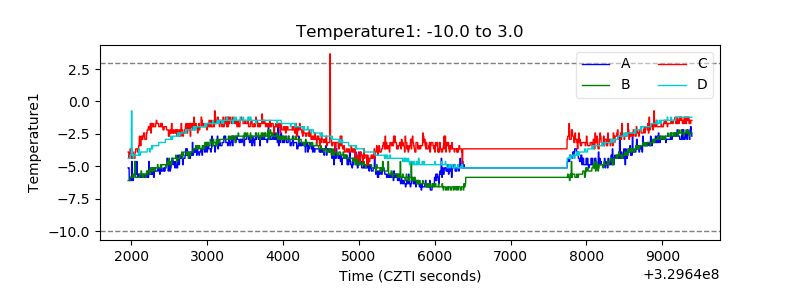 |
| Veto HV Monitor | 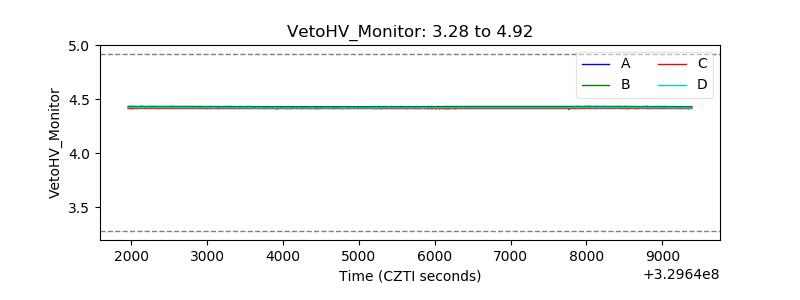 |
| Veto LLD | 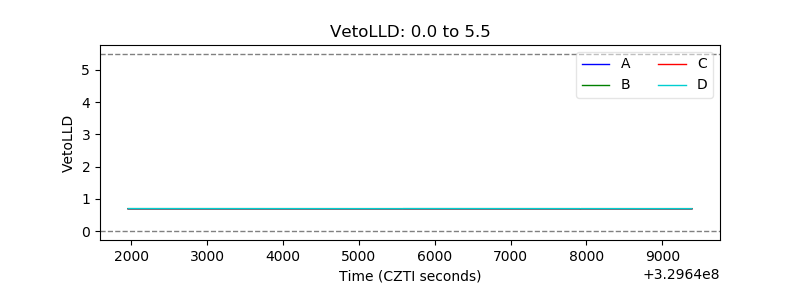 |
| Alpha Counter | 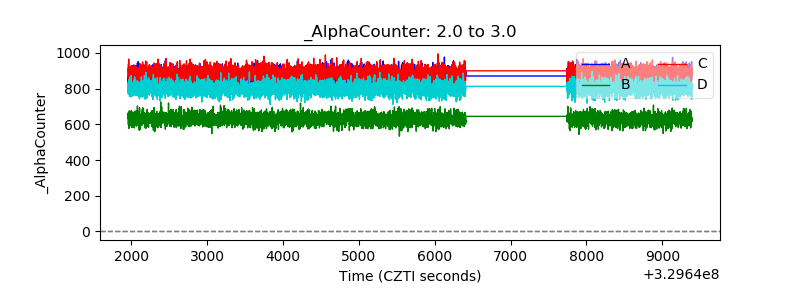 |
| _CPM_Rate | 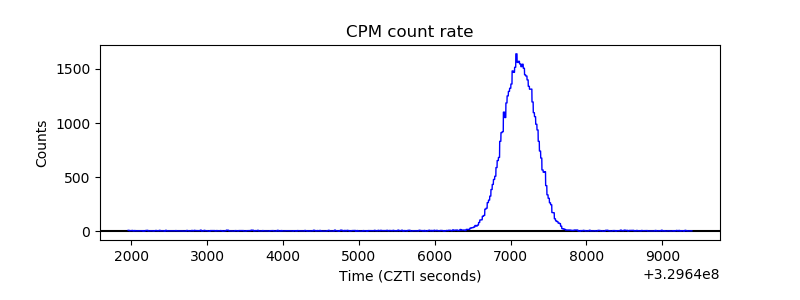 |
| CZT Counter | 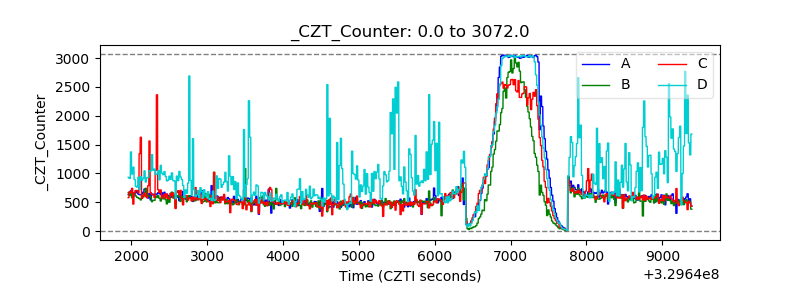 |
| +2.5 Volts monitor |  |
| +5 Volts monitor |  |
| _ROLL_ROT | 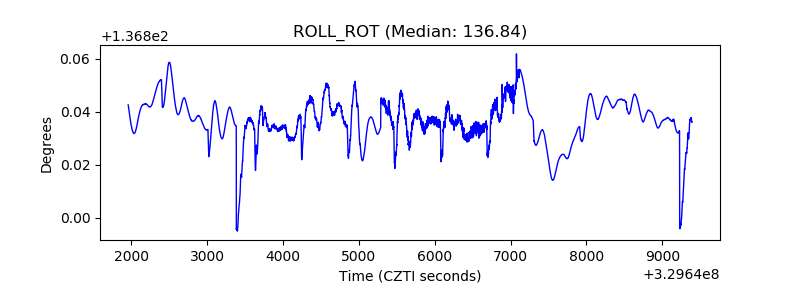 |
| _Roll_DEC | 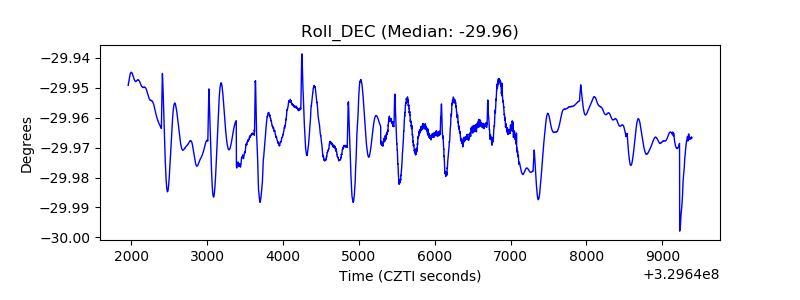 |
| _Roll_RA | 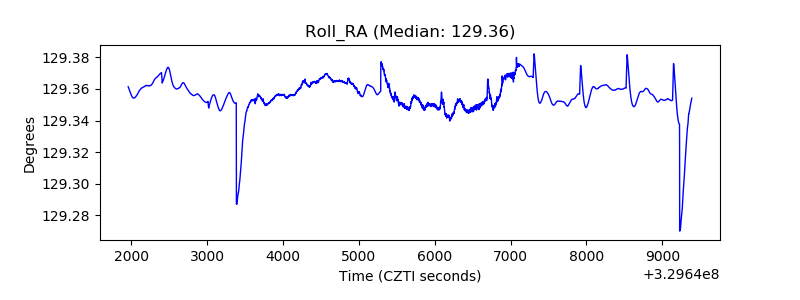 |
| Veto Counter | 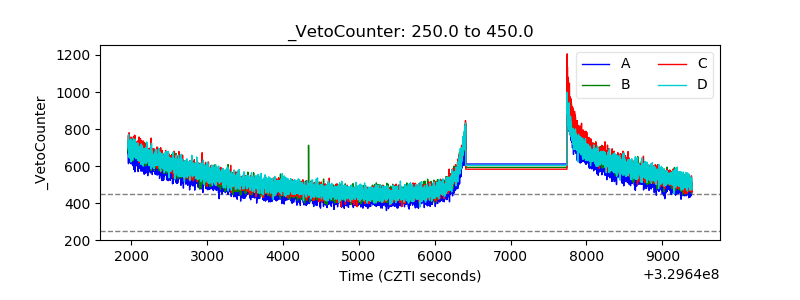 |