| Param | Original file | Final file |
|---|---|---|
| Filename | modeM0/AS1A09_085T02_9000003716_25449cztM0_level2.evt | modeM0/AS1A09_085T02_9000003716_25449cztM0_level2_quad_clean.evt |
| Size (bytes) | 501,747,840 | 95,987,520 |
| Size | 478.5 MB | 91.5 MB |
| Events in quadrant A | 3,411,216 | 633,608 |
| Events in quadrant B | 3,218,451 | 633,393 |
| Events in quadrant C | 3,731,444 | 604,129 |
| Events in quadrant D | 4,398,267 | 587,421 |
| Mode M9 | |||
|---|---|---|---|
| Quadrant | BADHDUFLAG | Total packets | Discarded packets |
| A | 0 | 9 | 0 |
| B | 0 | 9 | 0 |
| C | 0 | 9 | 0 |
| D | 0 | 9 | 0 |
| Mode M0 | |||
|---|---|---|---|
| Quadrant | BADHDUFLAG | Total packets | Discarded packets |
| A | 0 | 13932 | 0 |
| B | 0 | 13472 | 0 |
| C | 0 | 15089 | 0 |
| D | 0 | 17190 | 0 |
| Quadrant | Total seconds | Saturated seconds | Saturation percentage |
|---|---|---|---|
| A | 6427 | 94 | 1.462580% |
| B | 6428 | 90 | 1.400124% |
| C | 6428 | 255 | 3.967019% |
| D | 6428 | 270 | 4.200373% |
Noise dominated data is calculated using 1-second bins in cleaned event files. If a bin has >2000 counts, and if more than 50% of those come from <1% of pixels, then it is considered to be noise-dominated and hence unusable.
| Quadrant | # 1 sec bins | Bins with >0 counts | Bins with >2000 counts | High rate bins dominated by noise | Noise dominated (total time) | Noise dominated (detector-on time) | Marked lightcurve |
|---|---|---|---|---|---|---|---|
| A | 7352 | 6428 | 0 | 0 | 0.00% | 0.00% | 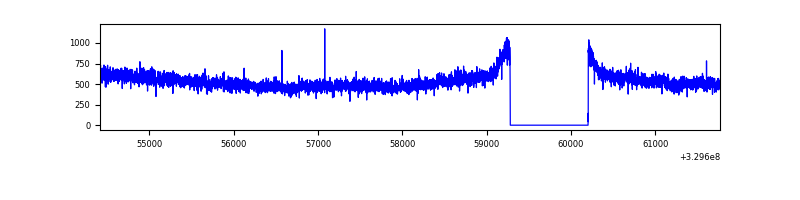 |
| B | 7353 | 6429 | 0 | 0 | 0.00% | 0.00% | 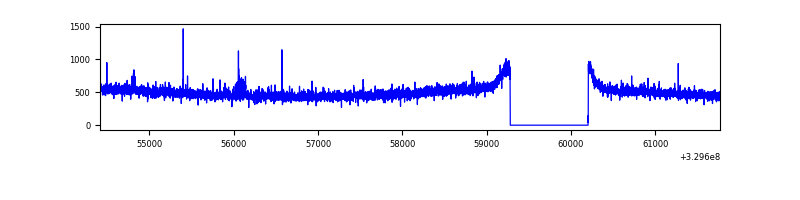 |
| C | 7353 | 6429 | 26 | 26 | 0.35% | 0.40% | 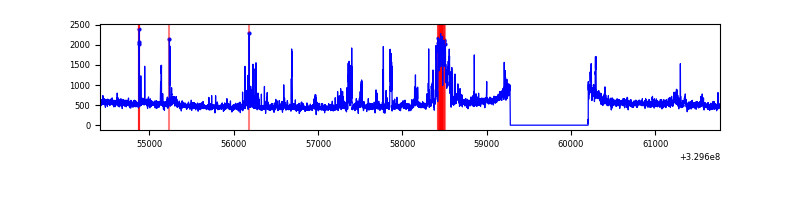 |
| D | 7353 | 6429 | 182 | 182 | 2.48% | 2.83% | 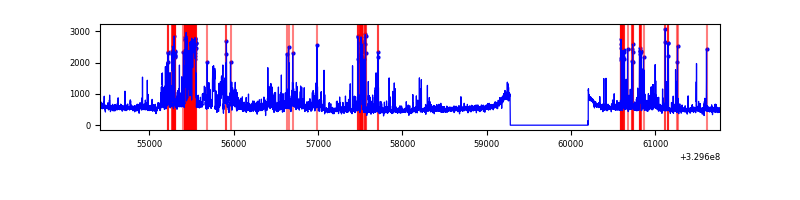 |
Top three noisy pixels from each quadrant. If the there are fewer than three noisy pixels in the level2.evt file, extra rows are filled as -1
| Pixel properties | Quadrant properties | ||||||
|---|---|---|---|---|---|---|---|
| Quadrant | DetID | PixID | Counts | Sigma | Mean | Median | Sigma |
| A | 6 | 16 | 195681 | 1164.7 | 833 | 817 | 167.3 |
| A | 13 | 254 | 10381 | 57.16 | 833 | 817 | 167.3 |
| A | 0 | 226 | 7405 | 39.38 | 833 | 817 | 167.3 |
| B | 12 | 111 | 18971 | 116.73 | 813 | 795 | 155.7 |
| B | 15 | 32 | 17174 | 105.19 | 813 | 795 | 155.7 |
| B | 11 | 111 | 16922 | 103.57 | 813 | 795 | 155.7 |
| C | 9 | 54 | 444607 | 2434.05 | 780 | 786 | 182.3 |
| C | 14 | 238 | 124579 | 678.92 | 780 | 786 | 182.3 |
| C | 7 | 87 | 84122 | 457.04 | 780 | 786 | 182.3 |
| D | 1 | 52 | 443167 | 2272.18 | 800 | 778 | 194.7 |
| D | 7 | 238 | 394606 | 2022.76 | 800 | 778 | 194.7 |
| D | 9 | 35 | 210854 | 1078.98 | 800 | 778 | 194.7 |
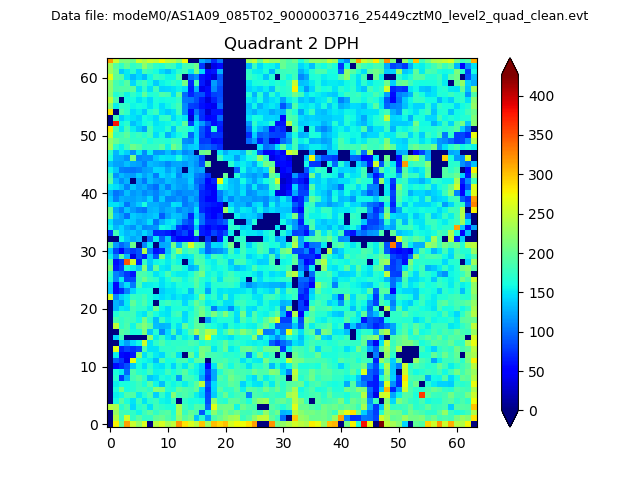
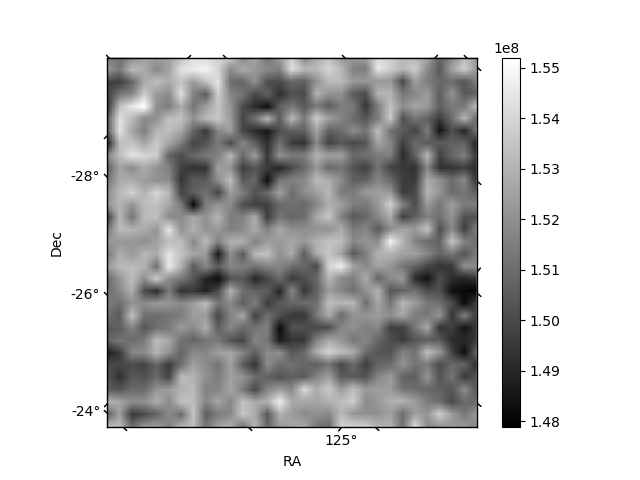
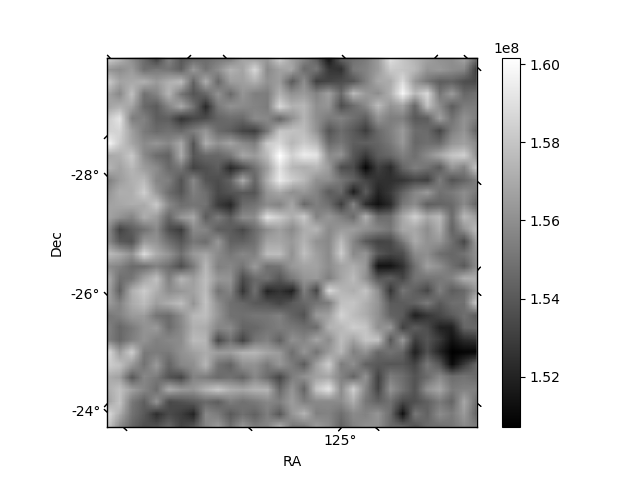
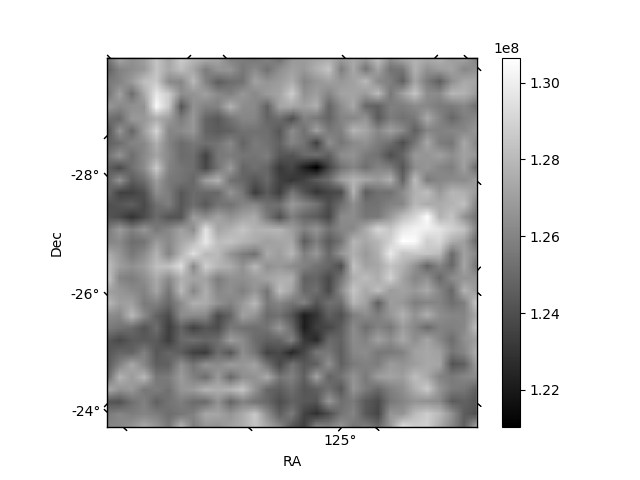
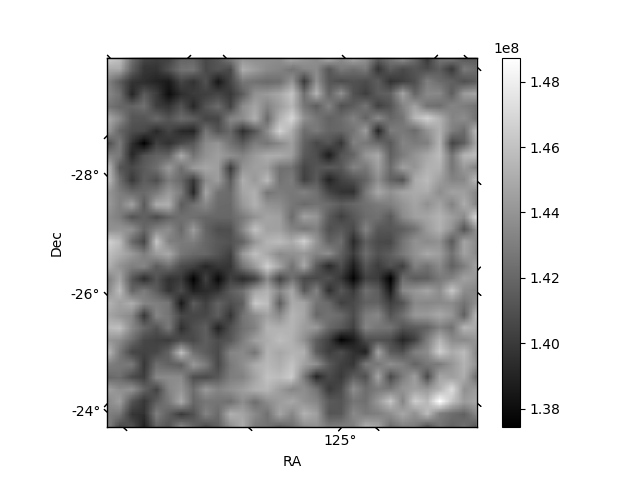
Histogram calculated using DETX and DETY for each event in the final _common_clean file
| Quadrant A | 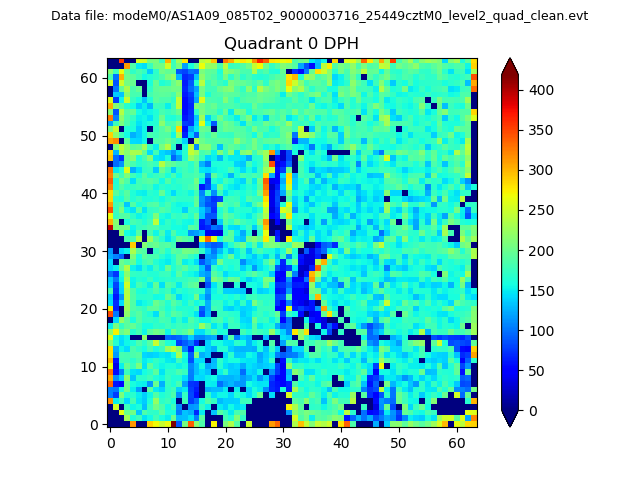 |
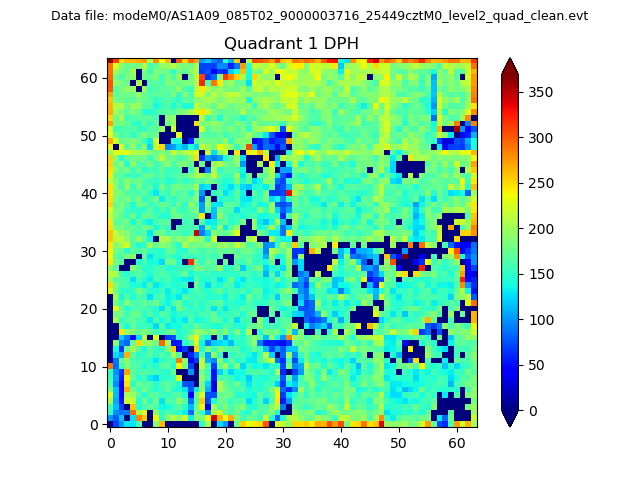 |
Quadrant B |
|---|---|---|---|
| Quadrant D | 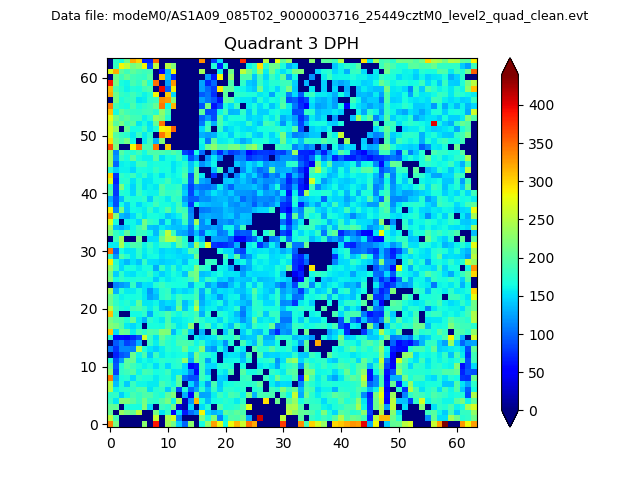 |
 |
Quadrant C |
| Plot type | Count rate plots | Images |
|---|---|---|
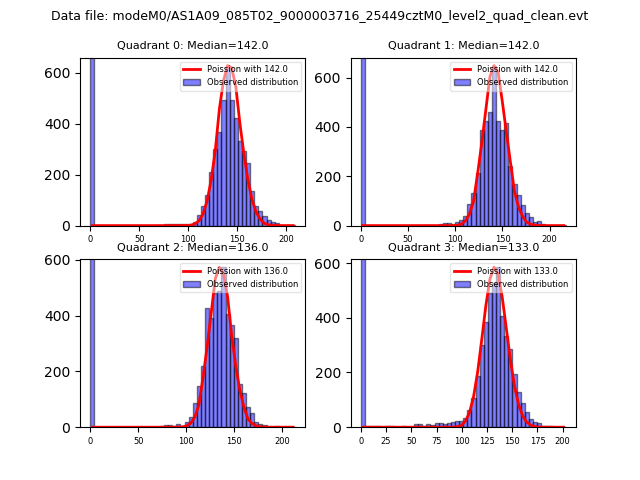
| Comparison with Poisson distribution Blue bars denote a histogram of data divided into 1 sec bins. Red curve is a Poisson curve with rate = median count rate of data. |
 |
 |
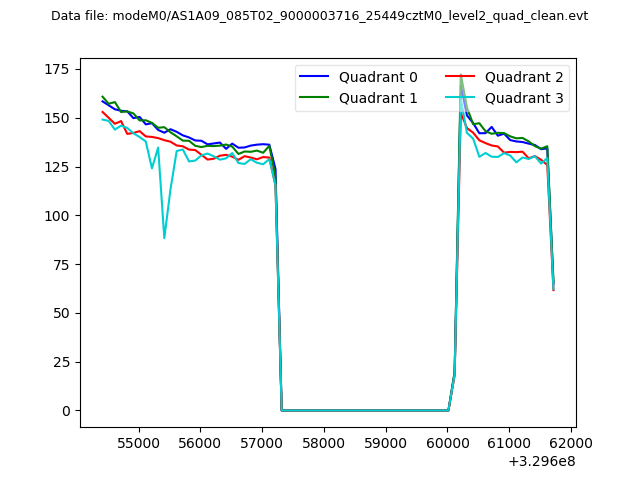
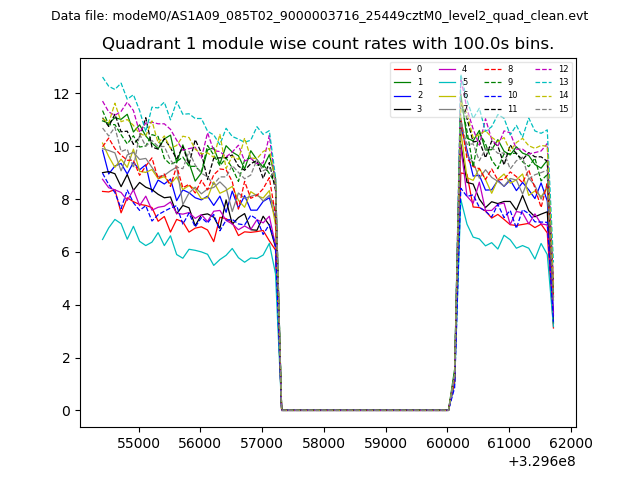
| Quadrant-wise count rates Data is divided into 100 sec bins |
 |
|
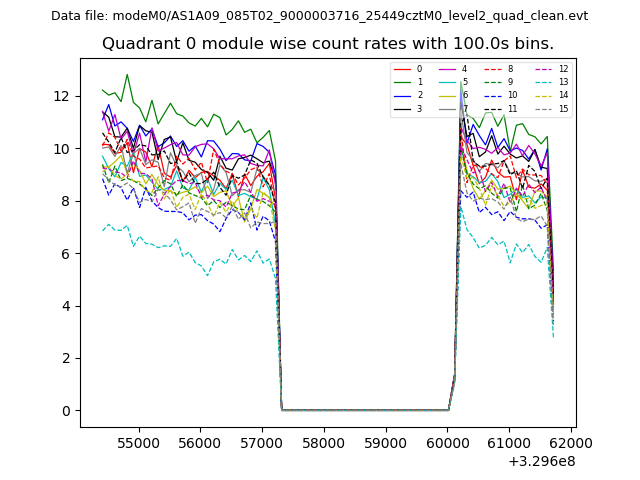
| Module-wise count rates for Quadrant A Data is divided into 100 sec bins |
 |
 |
| Module-wise count rates for Quadrant B Data is divided into 100 sec bins |
 |
 |
| Module-wise count rates for Quadrant C Data is divided into 100 sec bins |
 |
 |
| Module-wise count rates for Quadrant D Data is divided into 100 sec bins |
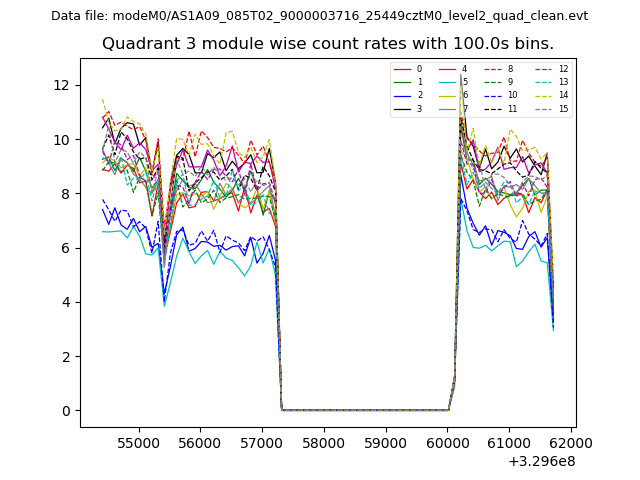 |
 |
| Parameter | Plot |
|---|---|
| CZT HV Monitor | 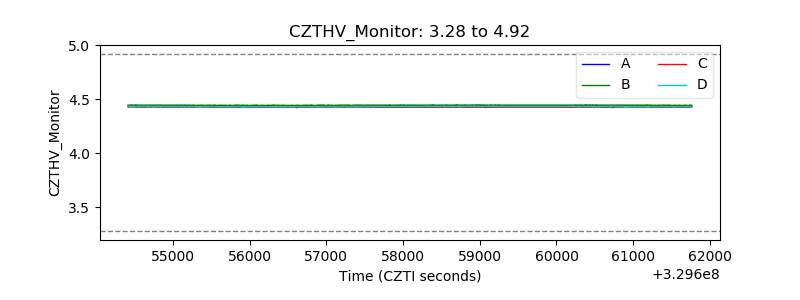 |
| D_VDD | 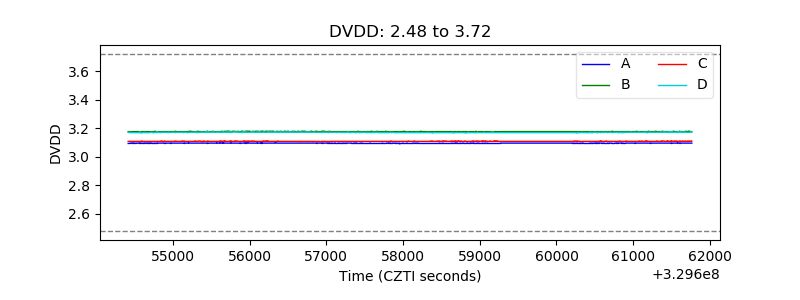 |
| Temperature 1 | 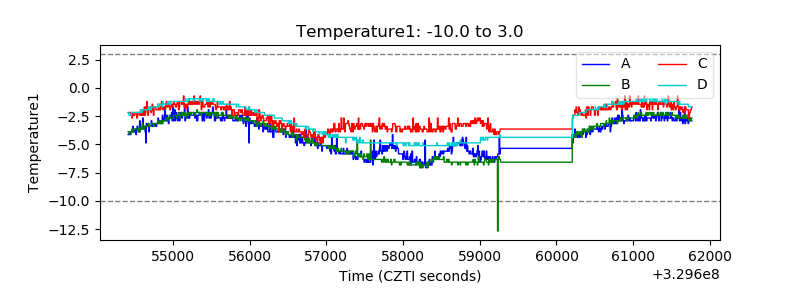 |
| Veto HV Monitor | 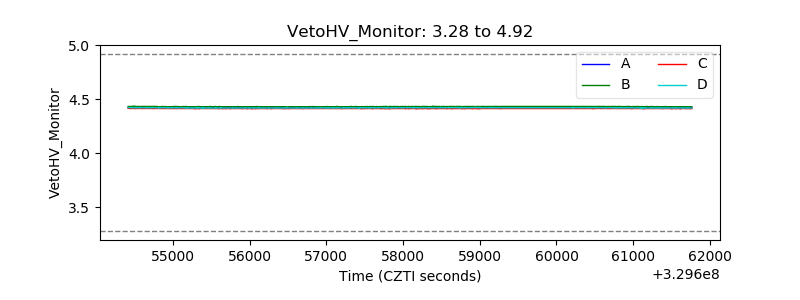 |
| Veto LLD | 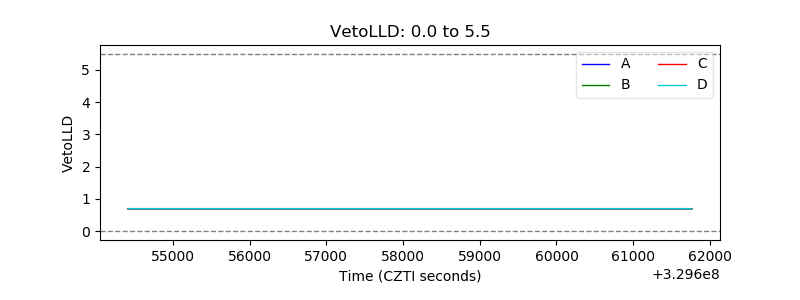 |
| Alpha Counter | 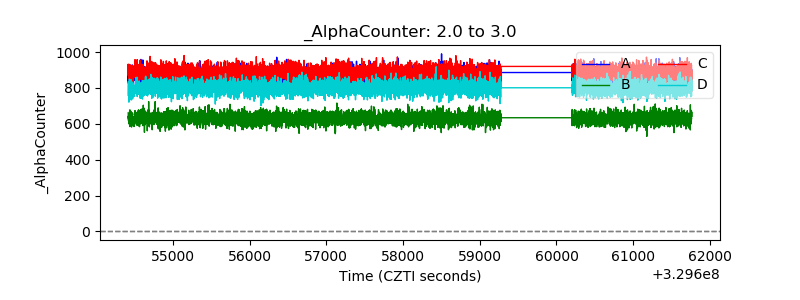 |
| _CPM_Rate | 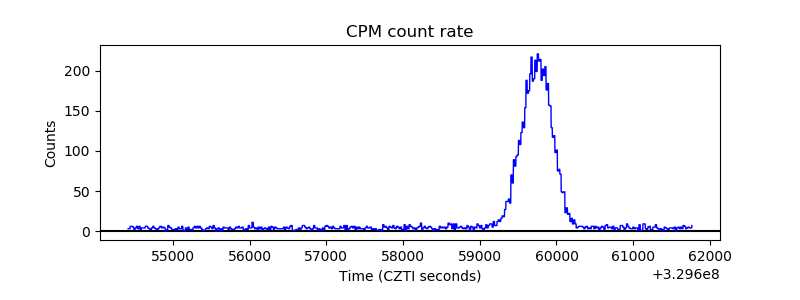 |
| CZT Counter | 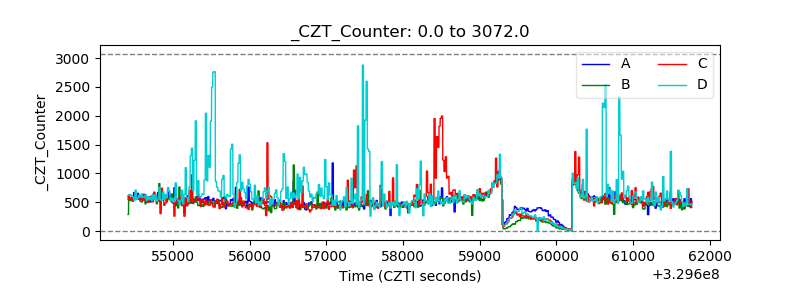 |
| +2.5 Volts monitor | 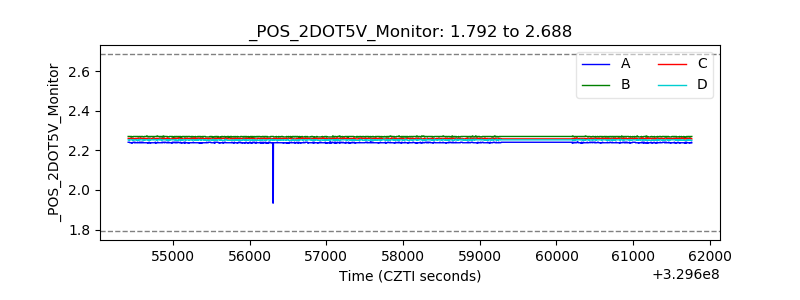 |
| +5 Volts monitor | 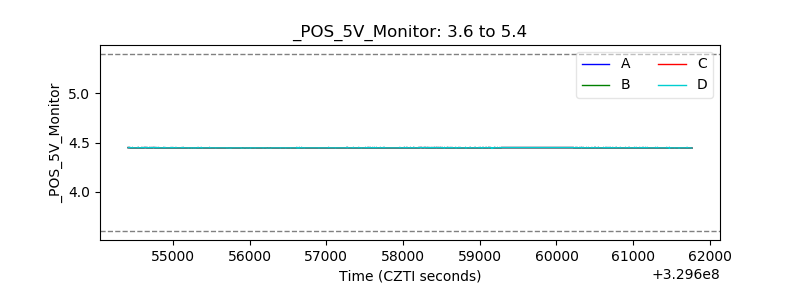 |
| _ROLL_ROT | 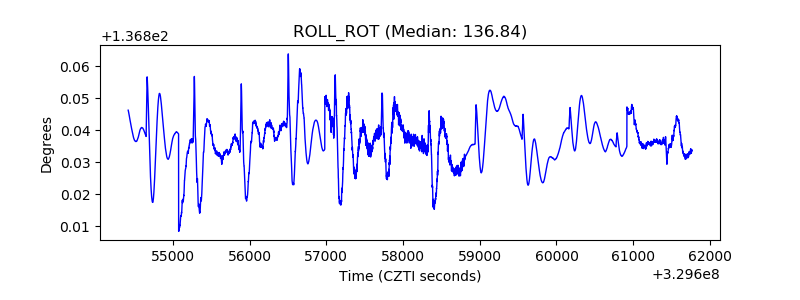 |
| _Roll_DEC |  |
| _Roll_RA | 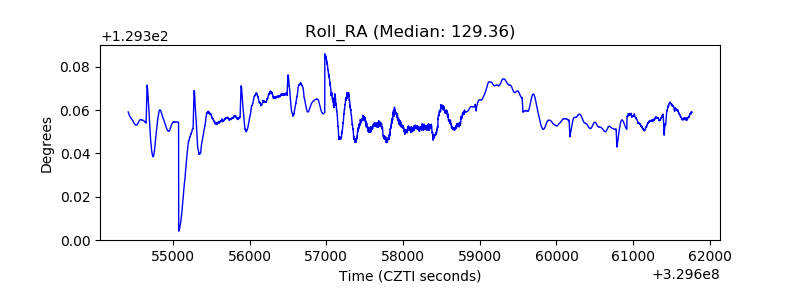 |
| Veto Counter | 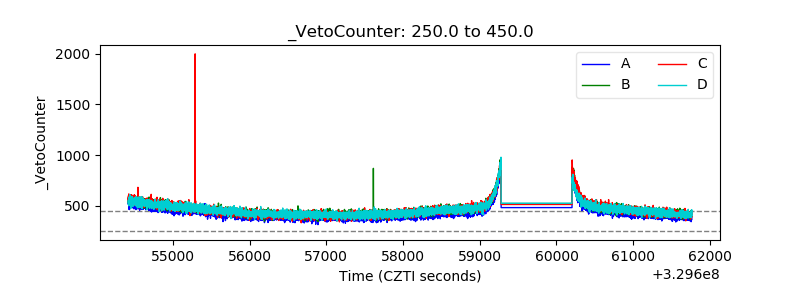 |