| Param | Original file | Final file |
|---|---|---|
| Filename | modeM0/AS1A09_085T02_9000003716_25450cztM0_level2.evt | modeM0/AS1A09_085T02_9000003716_25450cztM0_level2_quad_clean.evt |
| Size (bytes) | 447,122,880 | 87,848,640 |
| Size | 426.4 MB | 83.8 MB |
| Events in quadrant A | 3,179,167 | 567,557 |
| Events in quadrant B | 3,097,464 | 567,993 |
| Events in quadrant C | 3,290,367 | 545,670 |
| Events in quadrant D | 3,543,184 | 536,521 |
| Mode M9 | |||
|---|---|---|---|
| Quadrant | BADHDUFLAG | Total packets | Discarded packets |
| A | 0 | 6 | 0 |
| B | 0 | 6 | 0 |
| C | 0 | 6 | 0 |
| D | 0 | 6 | 0 |
| Mode M0 | |||
|---|---|---|---|
| Quadrant | BADHDUFLAG | Total packets | Discarded packets |
| A | 0 | 13313 | 0 |
| B | 0 | 13231 | 0 |
| C | 0 | 13727 | 0 |
| D | 0 | 14553 | 0 |
| Quadrant | Total seconds | Saturated seconds | Saturation percentage |
|---|---|---|---|
| A | 6343 | 68 | 1.072048% |
| B | 6344 | 75 | 1.182219% |
| C | 6344 | 106 | 1.670870% |
| D | 6344 | 176 | 2.774275% |
Noise dominated data is calculated using 1-second bins in cleaned event files. If a bin has >2000 counts, and if more than 50% of those come from <1% of pixels, then it is considered to be noise-dominated and hence unusable.
| Quadrant | # 1 sec bins | Bins with >0 counts | Bins with >2000 counts | High rate bins dominated by noise | Noise dominated (total time) | Noise dominated (detector-on time) | Marked lightcurve |
|---|---|---|---|---|---|---|---|
| A | 6913 | 6345 | 0 | 0 | 0.00% | 0.00% | 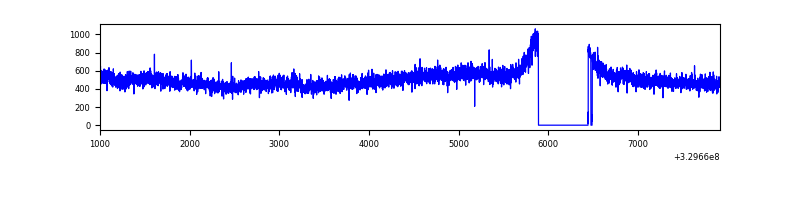 |
| B | 6914 | 6346 | 1 | 1 | 0.01% | 0.02% | 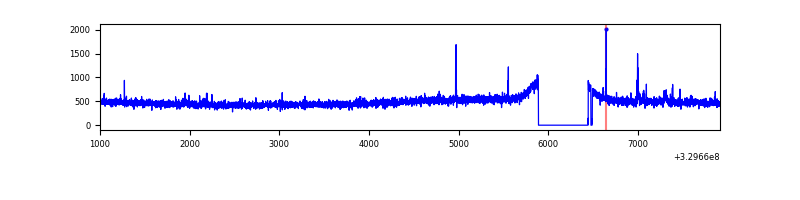 |
| C | 6914 | 6346 | 4 | 4 | 0.06% | 0.06% | 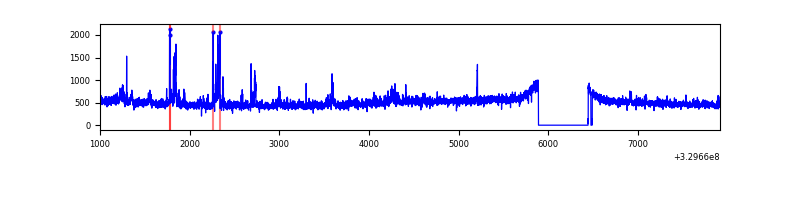 |
| D | 6914 | 6346 | 126 | 126 | 1.82% | 1.99% | 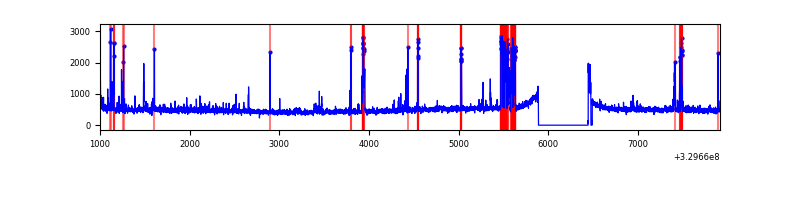 |
Top three noisy pixels from each quadrant. If the there are fewer than three noisy pixels in the level2.evt file, extra rows are filled as -1
| Pixel properties | Quadrant properties | ||||||
|---|---|---|---|---|---|---|---|
| Quadrant | DetID | PixID | Counts | Sigma | Mean | Median | Sigma |
| A | 6 | 16 | 130660 | 815.22 | 791 | 777 | 159.3 |
| A | 13 | 254 | 9478 | 54.61 | 791 | 777 | 159.3 |
| A | 3 | 137 | 7280 | 40.82 | 791 | 777 | 159.3 |
| B | 0 | 245 | 22058 | 141.39 | 776 | 756 | 150.7 |
| B | 12 | 111 | 18313 | 116.54 | 776 | 756 | 150.7 |
| B | 0 | 190 | 17089 | 108.41 | 776 | 756 | 150.7 |
| C | 9 | 54 | 175405 | 999.62 | 748 | 752 | 174.7 |
| C | 14 | 238 | 120194 | 683.62 | 748 | 752 | 174.7 |
| C | 7 | 87 | 65640 | 371.39 | 748 | 752 | 174.7 |
| D | 1 | 52 | 373368 | 1990.31 | 763 | 740 | 187.2 |
| D | 8 | 195 | 105443 | 559.25 | 763 | 740 | 187.2 |
| D | 2 | 82 | 68330 | 361.02 | 763 | 740 | 187.2 |
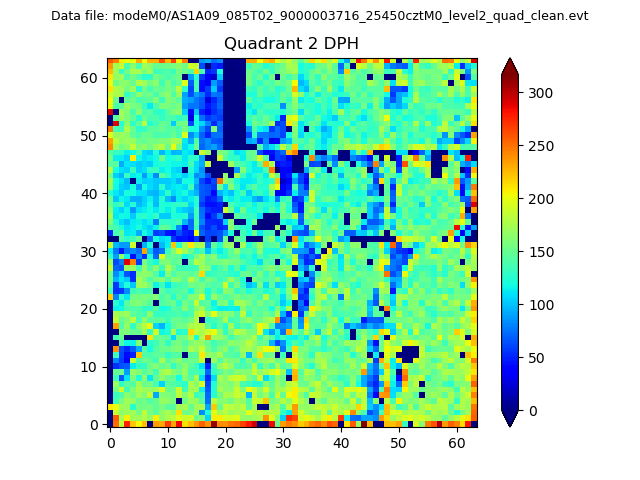
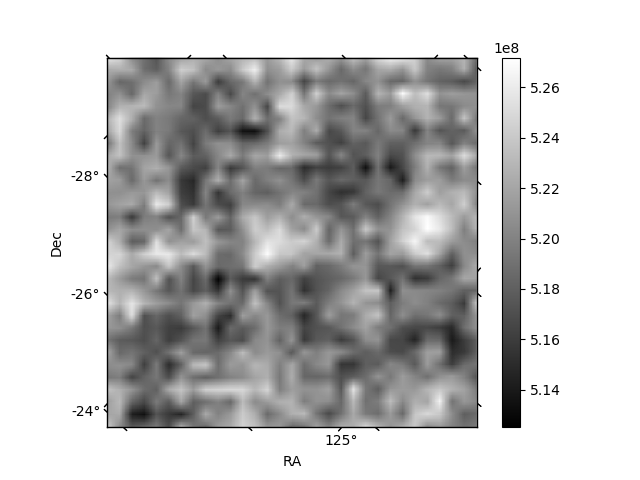
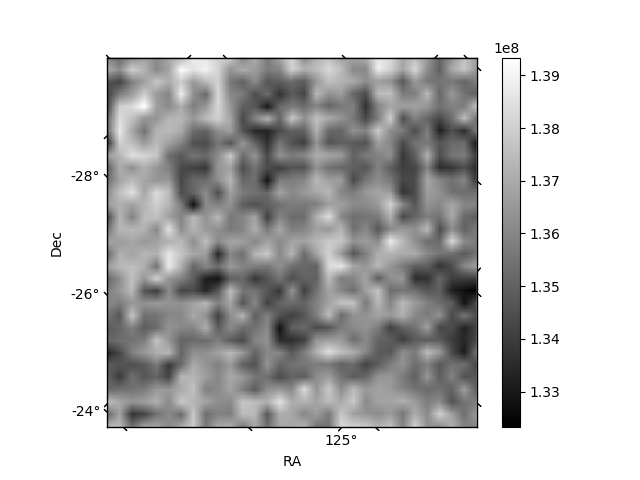
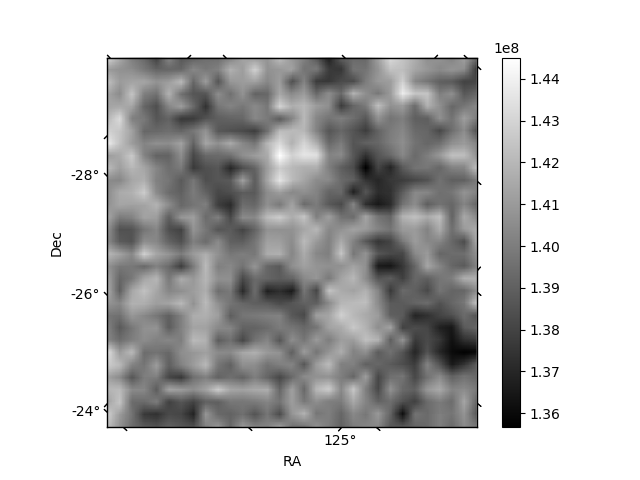
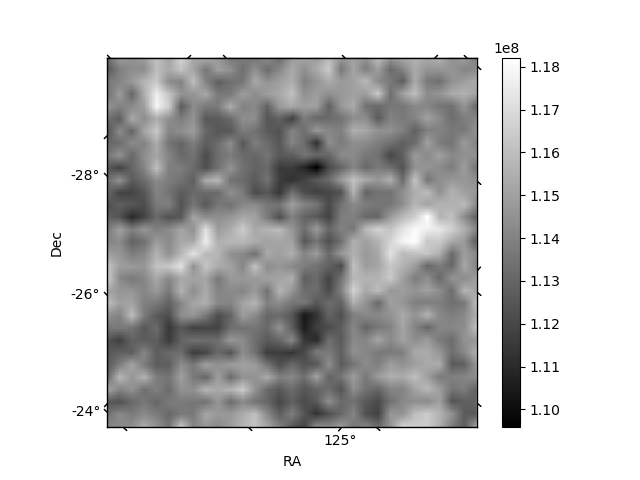
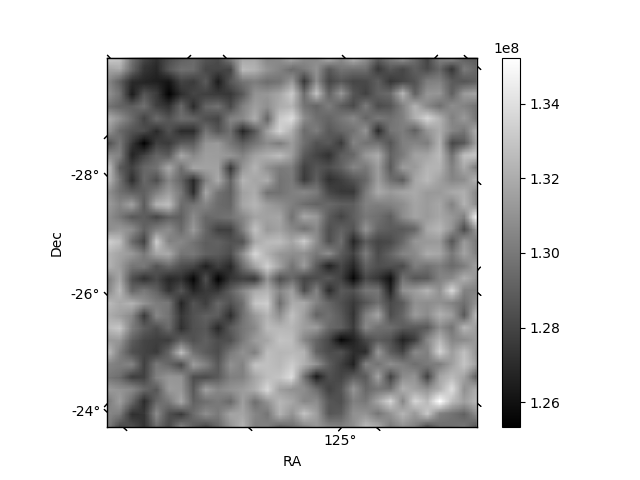
Histogram calculated using DETX and DETY for each event in the final _common_clean file
| Quadrant A | 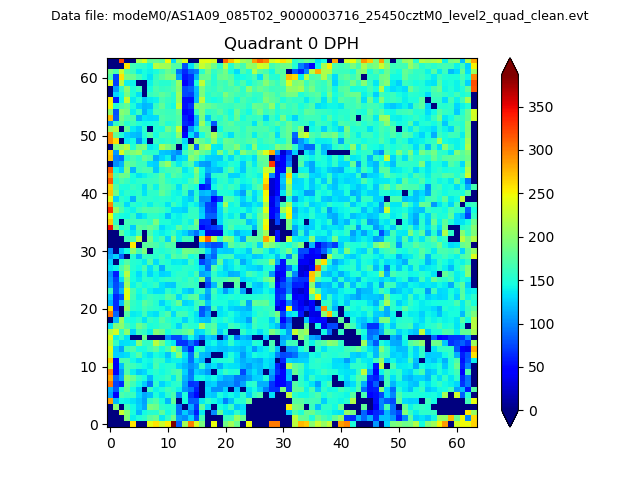 |
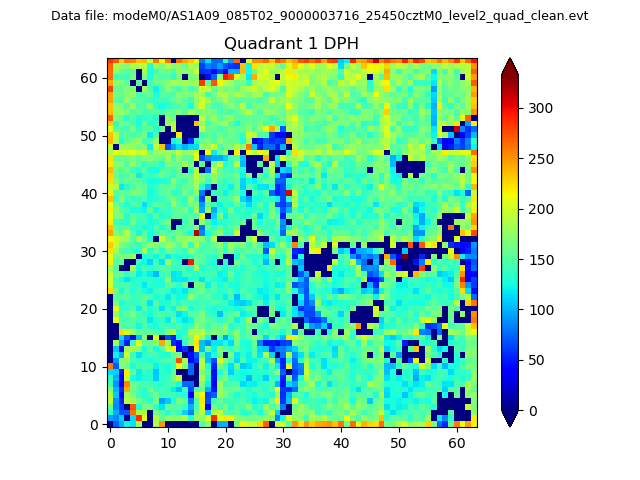 |
Quadrant B |
|---|---|---|---|
| Quadrant D | 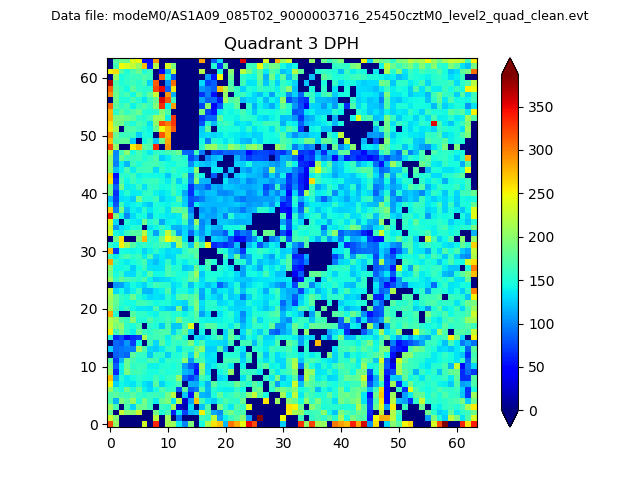 |
 |
Quadrant C |
| Plot type | Count rate plots | Images |
|---|---|---|
| Comparison with Poisson distribution Blue bars denote a histogram of data divided into 1 sec bins. Red curve is a Poisson curve with rate = median count rate of data. |
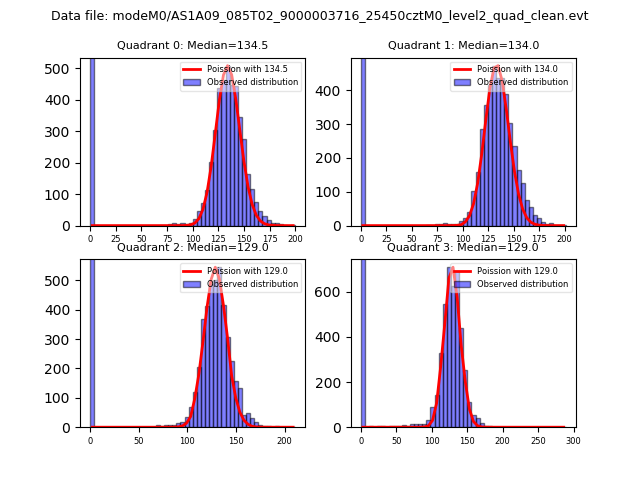 |
 |
| Quadrant-wise count rates Data is divided into 100 sec bins |
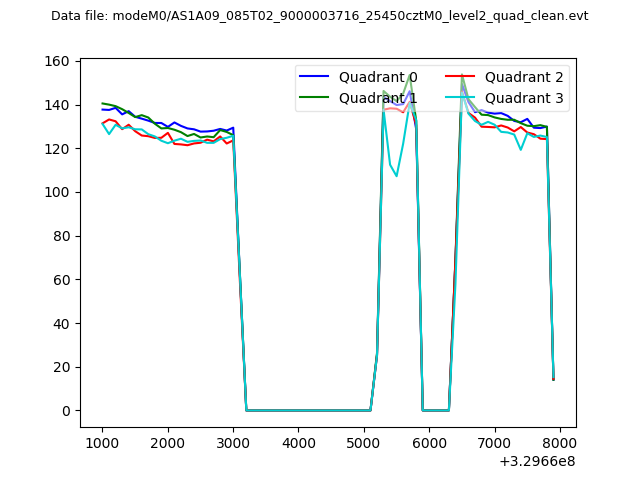 |
|
| Module-wise count rates for Quadrant A Data is divided into 100 sec bins |
 |
 |
| Module-wise count rates for Quadrant B Data is divided into 100 sec bins |
 |
 |
| Module-wise count rates for Quadrant C Data is divided into 100 sec bins |
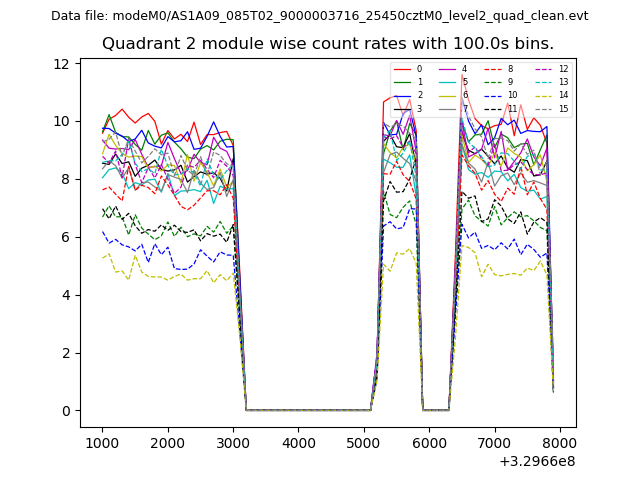 |
 |
| Module-wise count rates for Quadrant D Data is divided into 100 sec bins |
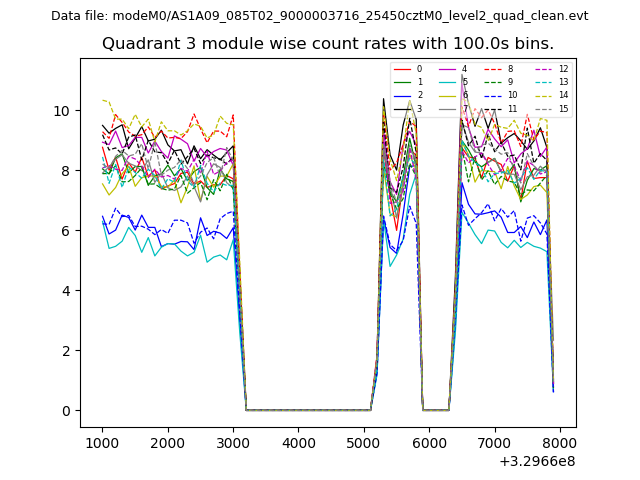 |
 |
| Parameter | Plot |
|---|---|
| CZT HV Monitor |  |
| D_VDD | 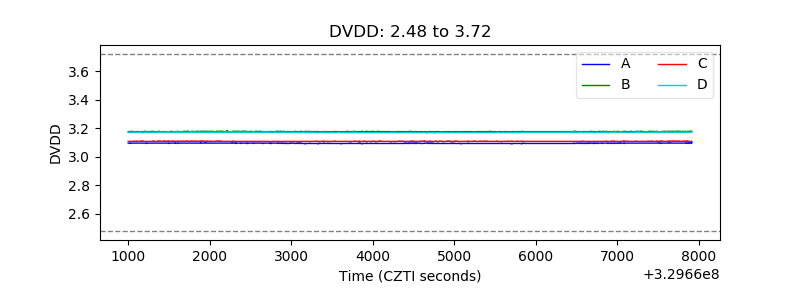 |
| Temperature 1 | 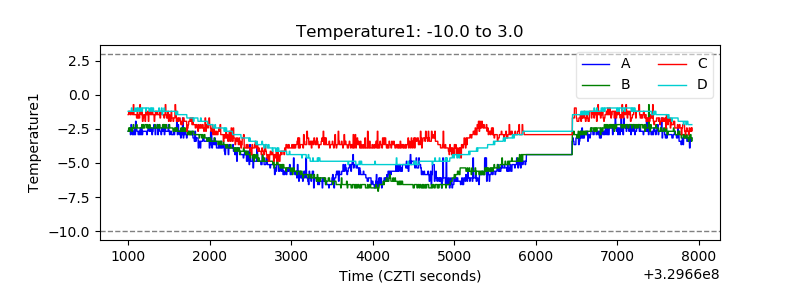 |
| Veto HV Monitor | 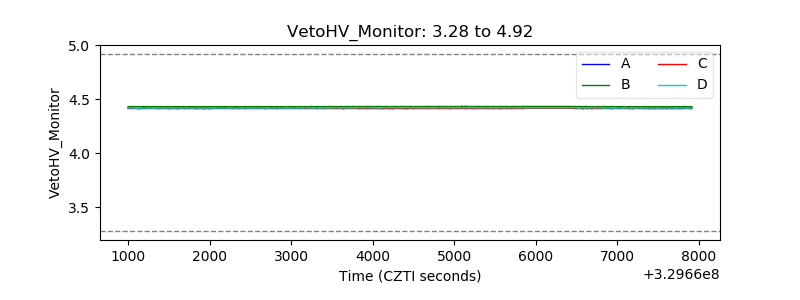 |
| Veto LLD | 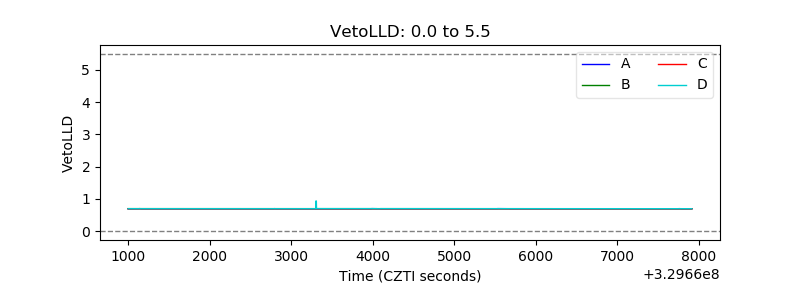 |
| Alpha Counter | 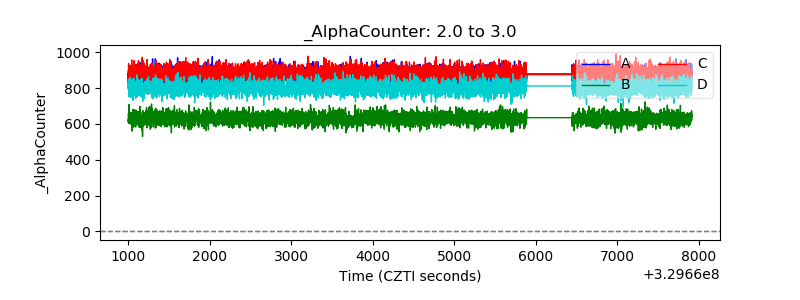 |
| _CPM_Rate | 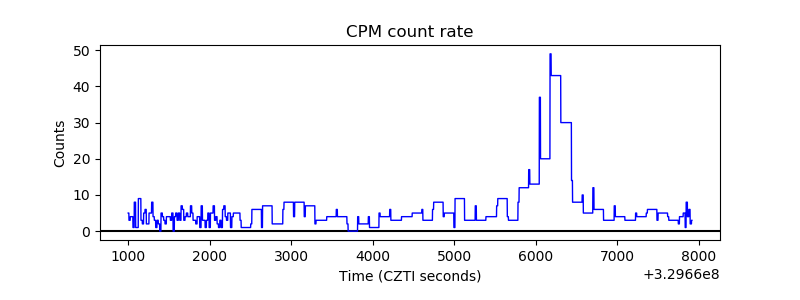 |
| CZT Counter | 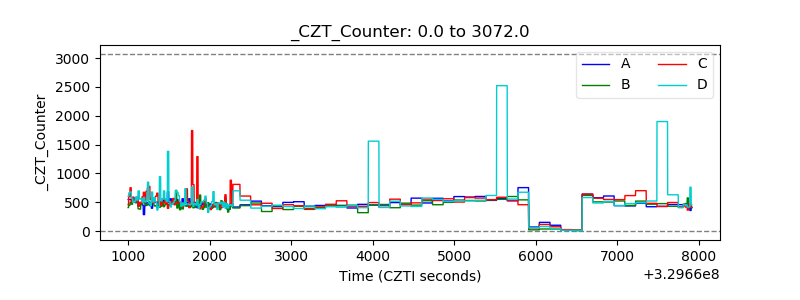 |
| +2.5 Volts monitor | 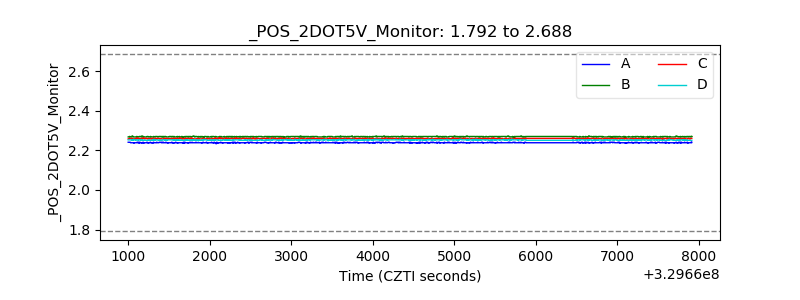 |
| +5 Volts monitor | 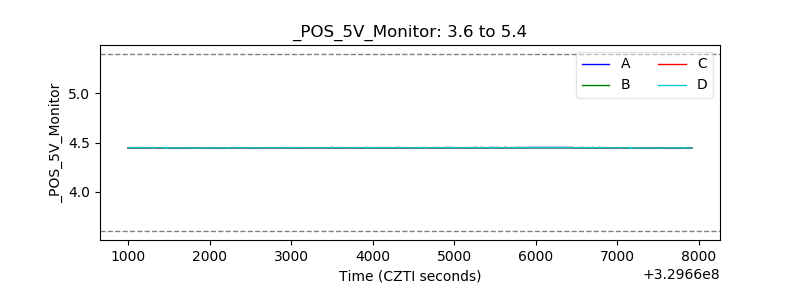 |
| _ROLL_ROT | 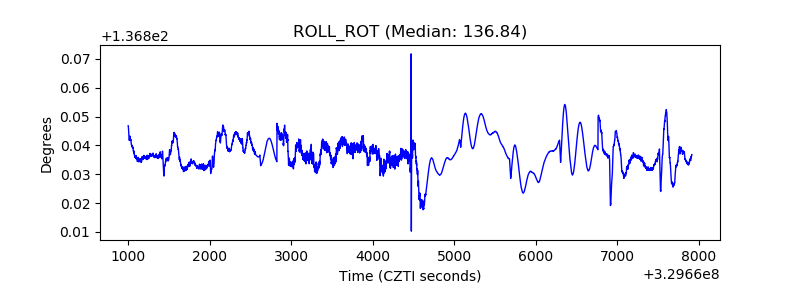 |
| _Roll_DEC | 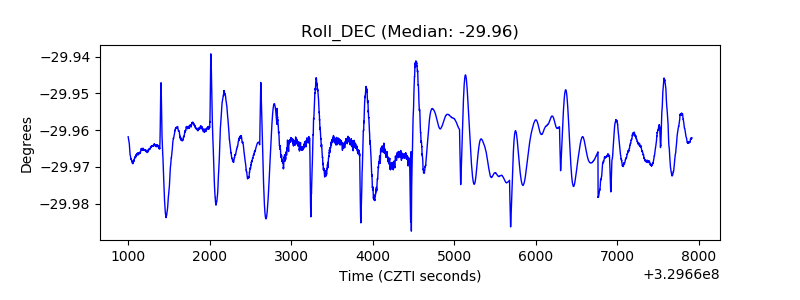 |
| _Roll_RA | 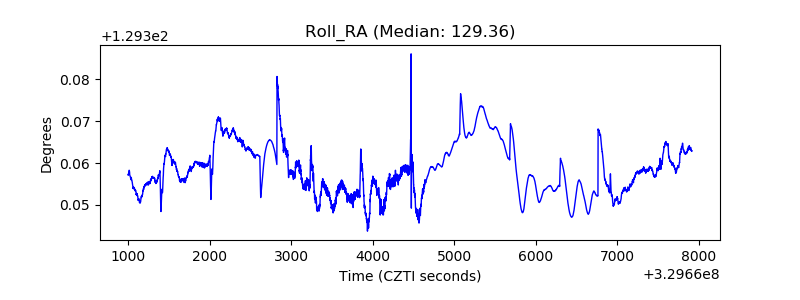 |
| Veto Counter |  |