| Param | Original file | Final file |
|---|---|---|
| Filename | modeM0/AS1A09_085T02_9000003716_25451cztM0_level2.evt | modeM0/AS1A09_085T02_9000003716_25451cztM0_level2_quad_clean.evt |
| Size (bytes) | 483,399,360 | 99,938,880 |
| Size | 461.0 MB | 95.3 MB |
| Events in quadrant A | 3,447,180 | 647,837 |
| Events in quadrant B | 3,467,653 | 649,424 |
| Events in quadrant C | 3,453,072 | 623,412 |
| Events in quadrant D | 3,795,775 | 617,607 |
| Mode M9 | |||
|---|---|---|---|
| Quadrant | BADHDUFLAG | Total packets | Discarded packets |
| A | 0 | 3 | 0 |
| B | 0 | 3 | 0 |
| C | 0 | 3 | 0 |
| D | 0 | 3 | 0 |
| Mode M0 | |||
|---|---|---|---|
| Quadrant | BADHDUFLAG | Total packets | Discarded packets |
| A | 0 | 14600 | 0 |
| B | 0 | 14732 | 0 |
| C | 0 | 14708 | 0 |
| D | 0 | 15723 | 0 |
| Quadrant | Total seconds | Saturated seconds | Saturation percentage |
|---|---|---|---|
| A | 7012 | 42 | 0.598973% |
| B | 7012 | 61 | 0.869937% |
| C | 7012 | 81 | 1.155163% |
| D | 7012 | 62 | 0.884199% |
Noise dominated data is calculated using 1-second bins in cleaned event files. If a bin has >2000 counts, and if more than 50% of those come from <1% of pixels, then it is considered to be noise-dominated and hence unusable.
| Quadrant | # 1 sec bins | Bins with >0 counts | Bins with >2000 counts | High rate bins dominated by noise | Noise dominated (total time) | Noise dominated (detector-on time) | Marked lightcurve |
|---|---|---|---|---|---|---|---|
| A | 7287 | 7013 | 0 | 0 | 0.00% | 0.00% | 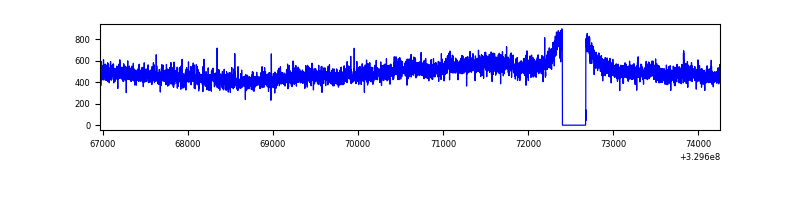 |
| B | 7287 | 7013 | 0 | 0 | 0.00% | 0.00% | 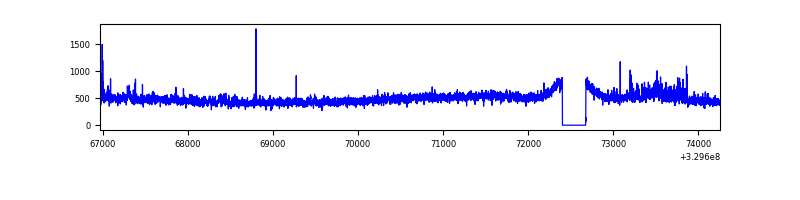 |
| C | 7287 | 7013 | 0 | 0 | 0.00% | 0.00% | 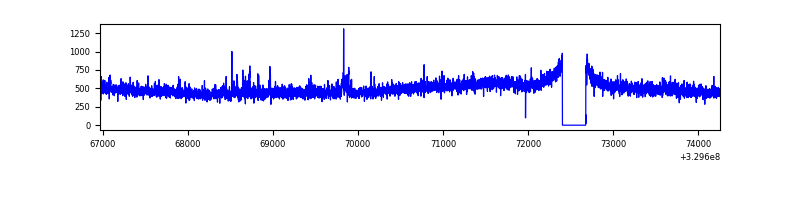 |
| D | 7287 | 7013 | 38 | 38 | 0.52% | 0.54% | 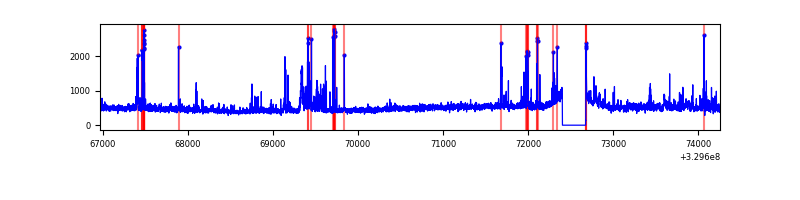 |
Top three noisy pixels from each quadrant. If the there are fewer than three noisy pixels in the level2.evt file, extra rows are filled as -1
| Pixel properties | Quadrant properties | ||||||
|---|---|---|---|---|---|---|---|
| Quadrant | DetID | PixID | Counts | Sigma | Mean | Median | Sigma |
| A | 6 | 16 | 117662 | 673.79 | 863 | 845 | 173.4 |
| A | 13 | 254 | 9740 | 51.31 | 863 | 845 | 173.4 |
| A | 3 | 137 | 8045 | 41.53 | 863 | 845 | 173.4 |
| B | 15 | 32 | 71113 | 428.69 | 848 | 827 | 164.0 |
| B | 0 | 229 | 38716 | 231.09 | 848 | 827 | 164.0 |
| B | 0 | 245 | 23179 | 136.33 | 848 | 827 | 164.0 |
| C | 14 | 238 | 131443 | 680.25 | 817 | 821 | 192.0 |
| C | 7 | 87 | 115408 | 596.75 | 817 | 821 | 192.0 |
| C | 9 | 54 | 10044 | 48.03 | 817 | 821 | 192.0 |
| D | 7 | 238 | 179779 | 882.56 | 834 | 810 | 202.8 |
| D | 9 | 35 | 114203 | 559.18 | 834 | 810 | 202.8 |
| D | 8 | 195 | 112299 | 549.79 | 834 | 810 | 202.8 |
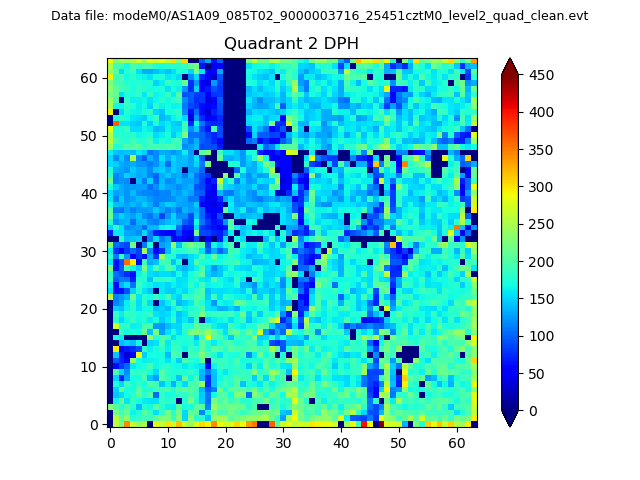
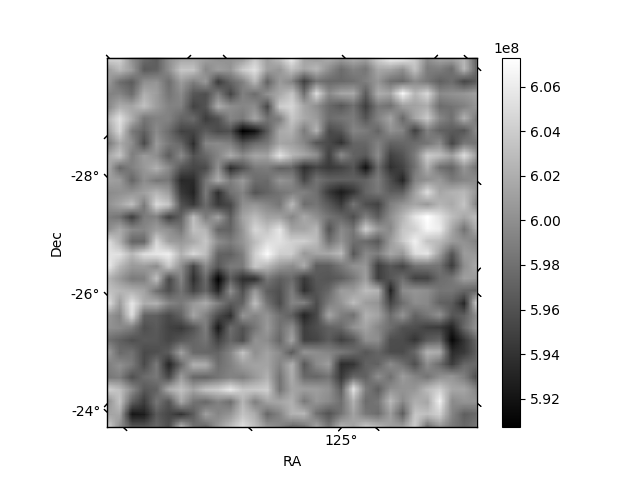
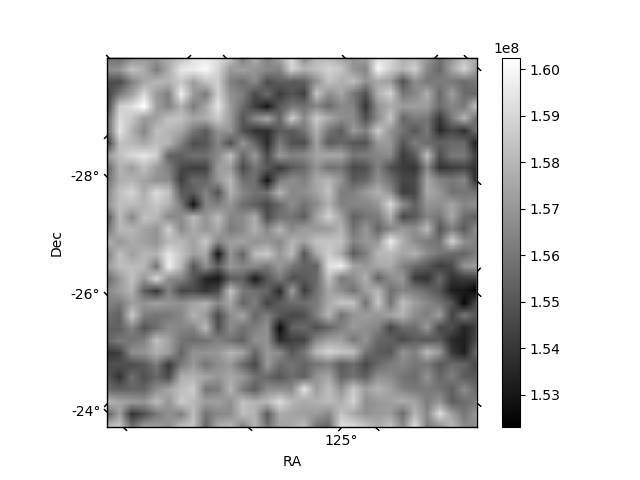
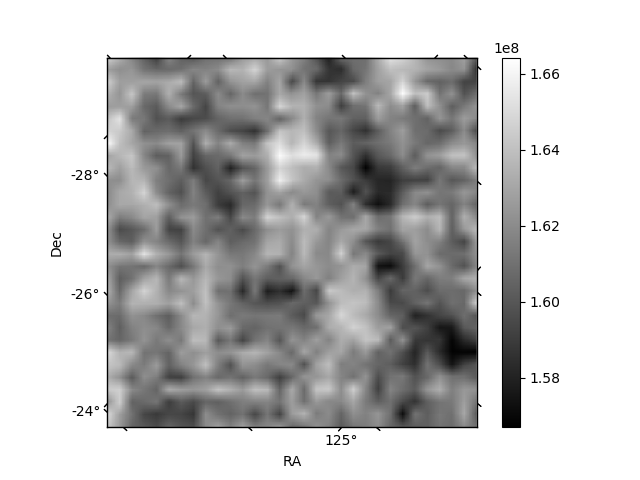
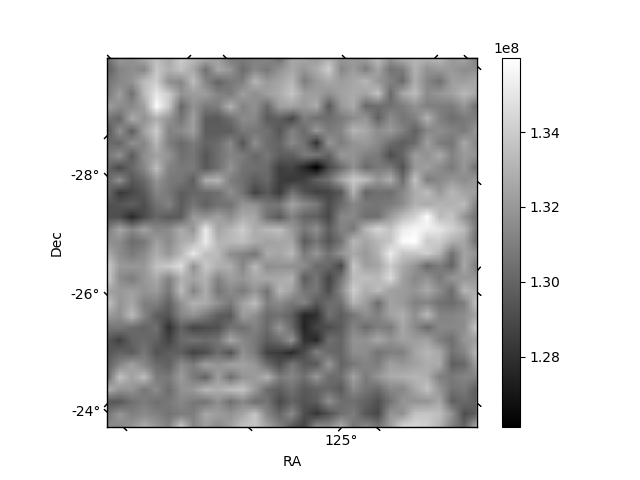
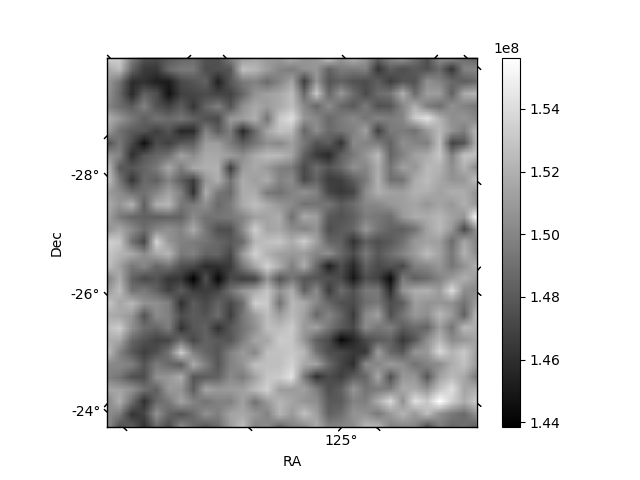
Histogram calculated using DETX and DETY for each event in the final _common_clean file
| Quadrant A | 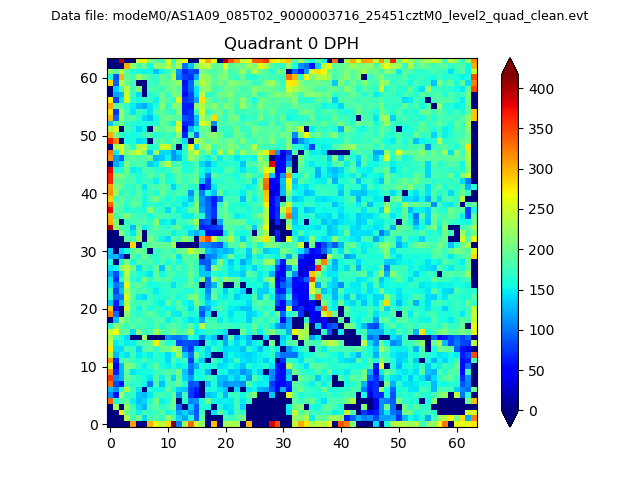 |
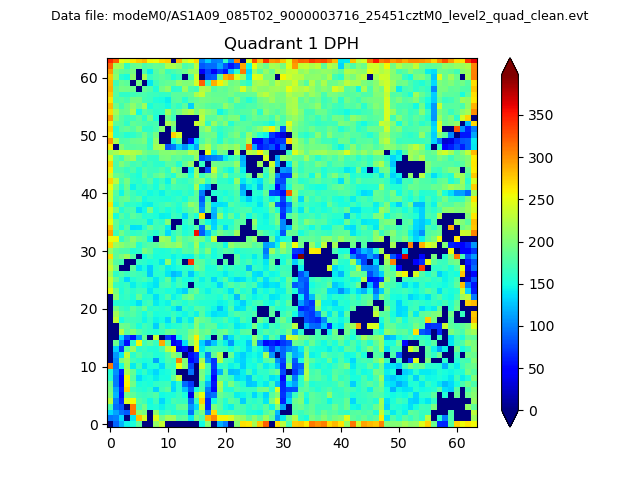 |
Quadrant B |
|---|---|---|---|
| Quadrant D | 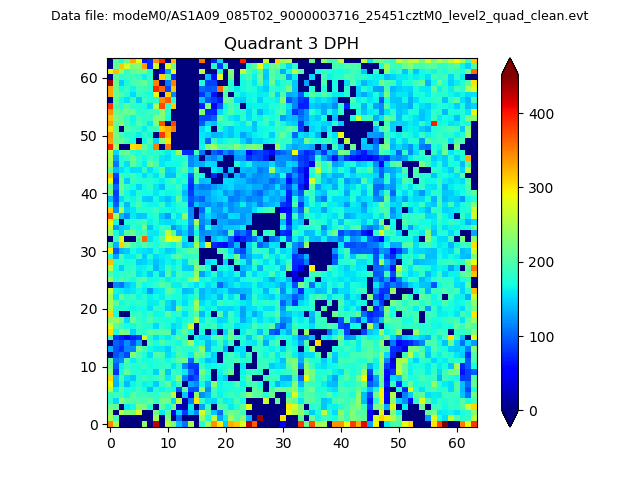 |
 |
Quadrant C |
| Plot type | Count rate plots | Images |
|---|---|---|
| Comparison with Poisson distribution Blue bars denote a histogram of data divided into 1 sec bins. Red curve is a Poisson curve with rate = median count rate of data. |
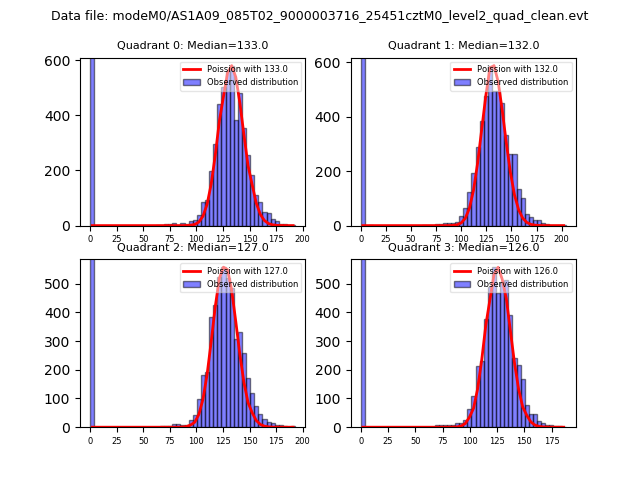 |
 |
| Quadrant-wise count rates Data is divided into 100 sec bins |
 |
|
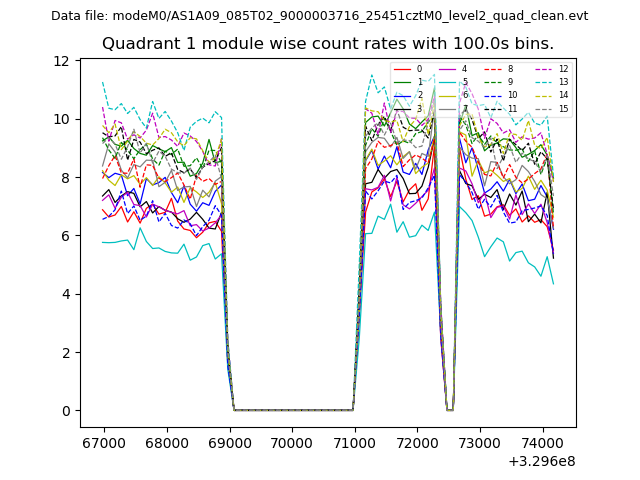
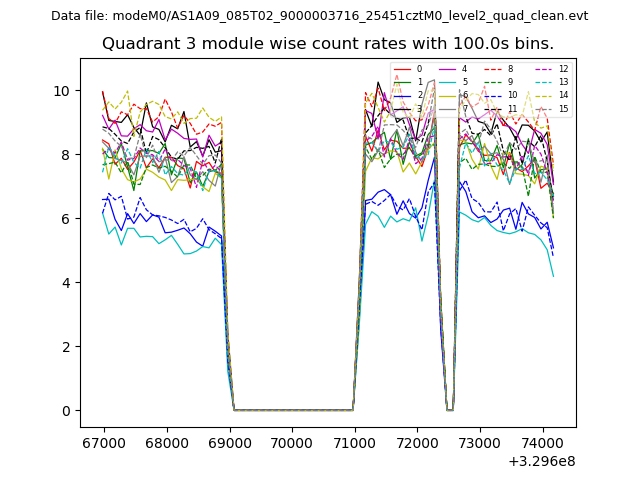
| Module-wise count rates for Quadrant A Data is divided into 100 sec bins |
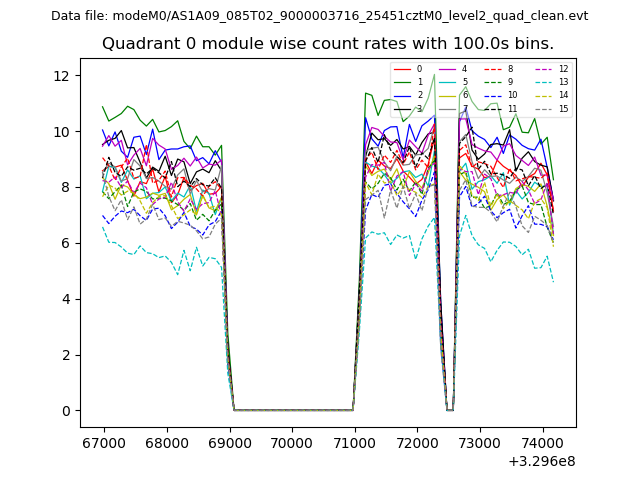 |
 |
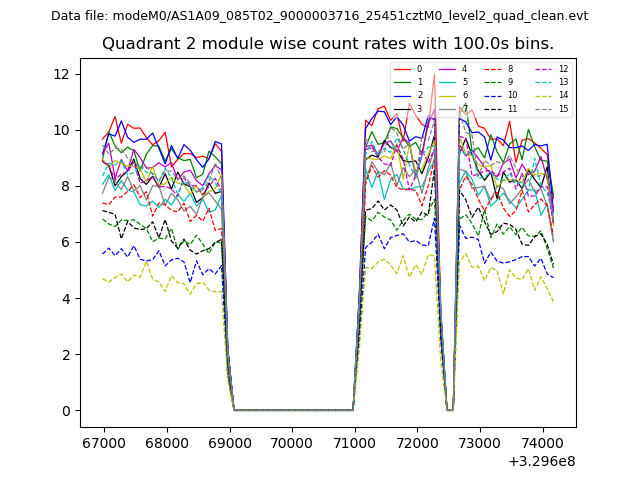
| Module-wise count rates for Quadrant B Data is divided into 100 sec bins |
 |
 |
| Module-wise count rates for Quadrant C Data is divided into 100 sec bins |
 |
 |
| Module-wise count rates for Quadrant D Data is divided into 100 sec bins |
 |
 |
| Parameter | Plot |
|---|---|
| CZT HV Monitor | 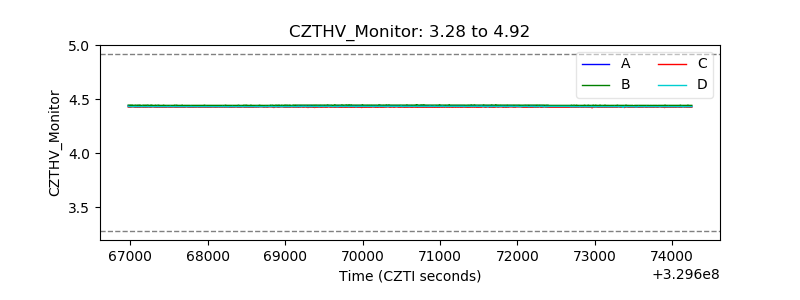 |
| D_VDD | 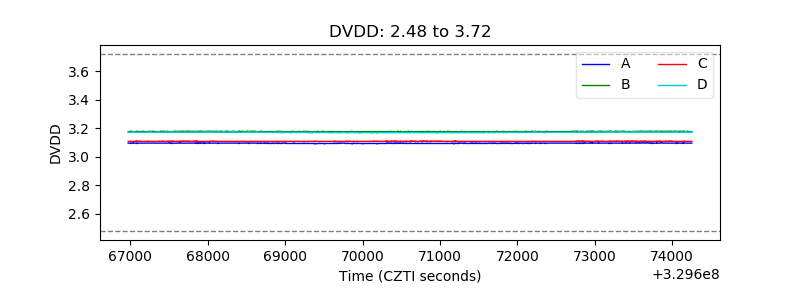 |
| Temperature 1 | 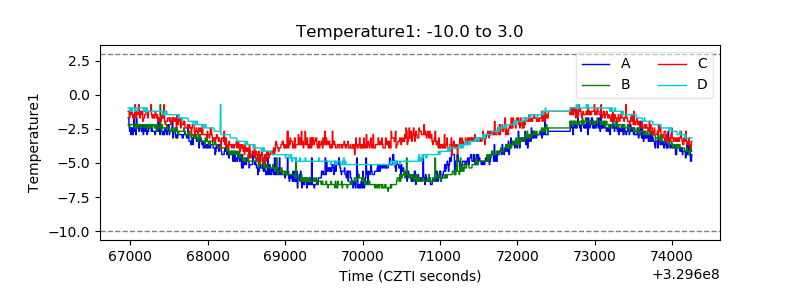 |
| Veto HV Monitor | 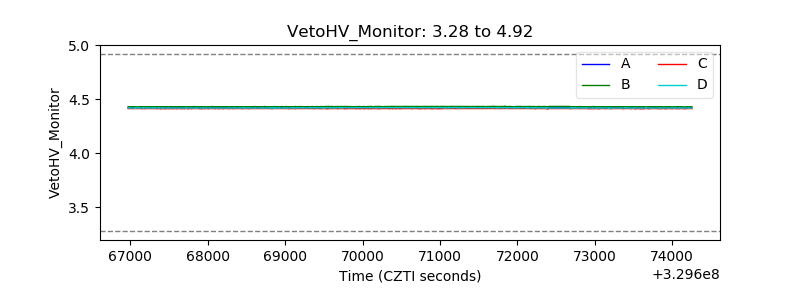 |
| Veto LLD | 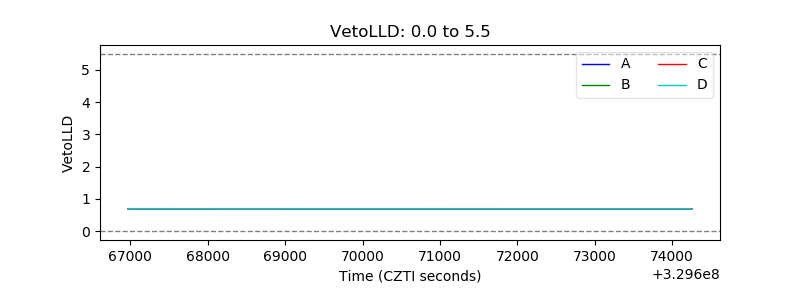 |
| Alpha Counter | 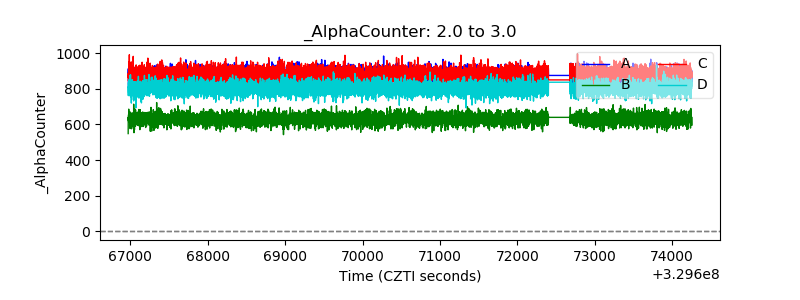 |
| _CPM_Rate | 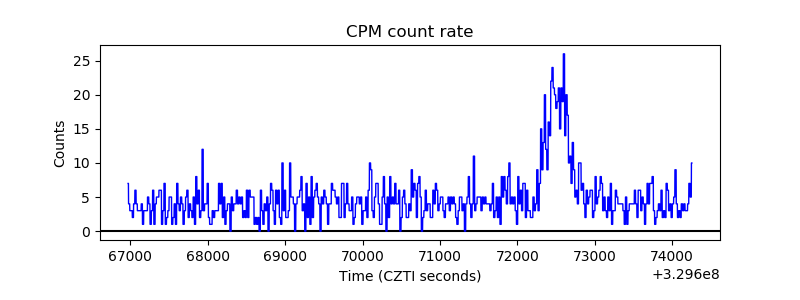 |
| CZT Counter | 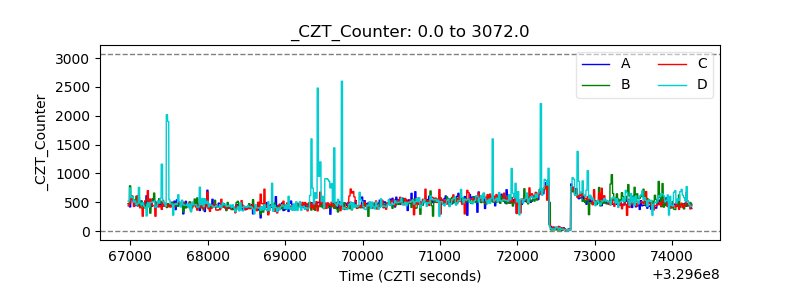 |
| +2.5 Volts monitor |  |
| +5 Volts monitor |  |
| _ROLL_ROT | 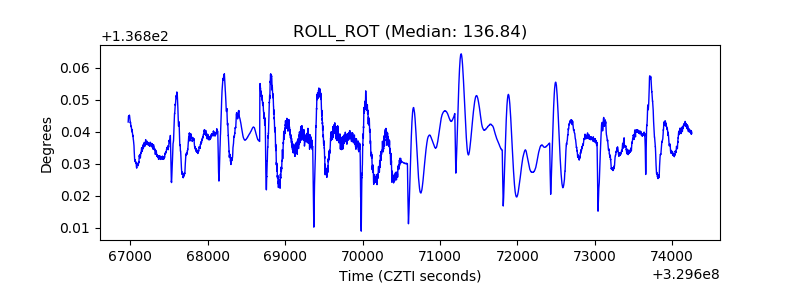 |
| _Roll_DEC | 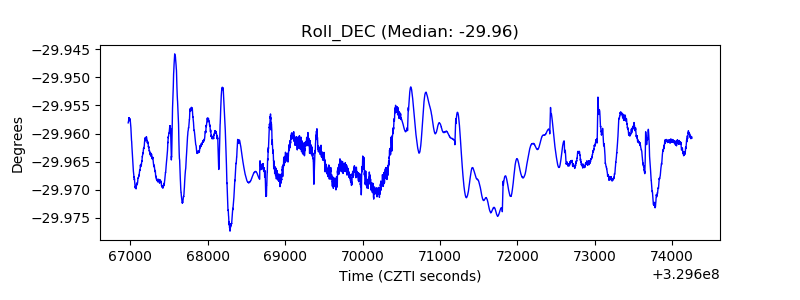 |
| _Roll_RA | 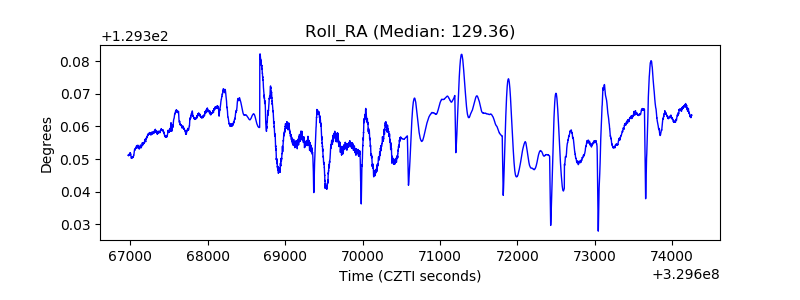 |
| Veto Counter | 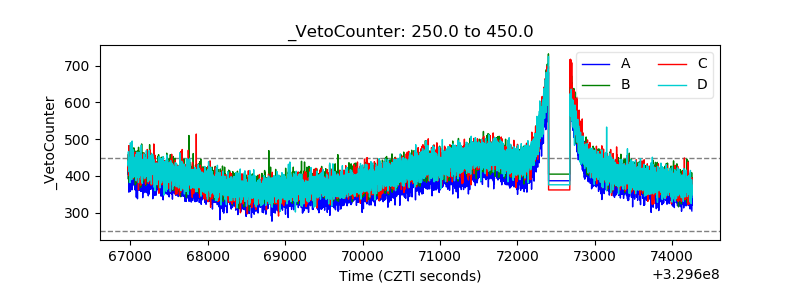 |