| Param | Original file | Final file |
|---|---|---|
| Filename | modeM0/AS1A09_085T02_9000003716_25452cztM0_level2.evt | modeM0/AS1A09_085T02_9000003716_25452cztM0_level2_quad_clean.evt |
| Size (bytes) | 526,599,360 | 105,698,880 |
| Size | 502.2 MB | 100.8 MB |
| Events in quadrant A | 3,552,010 | 686,703 |
| Events in quadrant B | 3,565,391 | 689,149 |
| Events in quadrant C | 4,195,609 | 659,418 |
| Events in quadrant D | 4,135,618 | 653,758 |
| Mode M9 | |||
|---|---|---|---|
| Quadrant | BADHDUFLAG | Total packets | Discarded packets |
| A | 0 | 4 | 0 |
| B | 0 | 4 | 0 |
| C | 0 | 4 | 0 |
| D | 0 | 4 | 0 |
| Mode M0 | |||
|---|---|---|---|
| Quadrant | BADHDUFLAG | Total packets | Discarded packets |
| A | 0 | 15073 | 0 |
| B | 0 | 15306 | 0 |
| C | 0 | 17137 | 0 |
| D | 0 | 17024 | 0 |
| Quadrant | Total seconds | Saturated seconds | Saturation percentage |
|---|---|---|---|
| A | 7362 | 26 | 0.353165% |
| B | 7362 | 38 | 0.516164% |
| C | 7363 | 277 | 3.762054% |
| D | 7363 | 94 | 1.276654% |
Noise dominated data is calculated using 1-second bins in cleaned event files. If a bin has >2000 counts, and if more than 50% of those come from <1% of pixels, then it is considered to be noise-dominated and hence unusable.
| Quadrant | # 1 sec bins | Bins with >0 counts | Bins with >2000 counts | High rate bins dominated by noise | Noise dominated (total time) | Noise dominated (detector-on time) | Marked lightcurve |
|---|---|---|---|---|---|---|---|
| A | 7722 | 7362 | 0 | 0 | 0.00% | 0.00% | 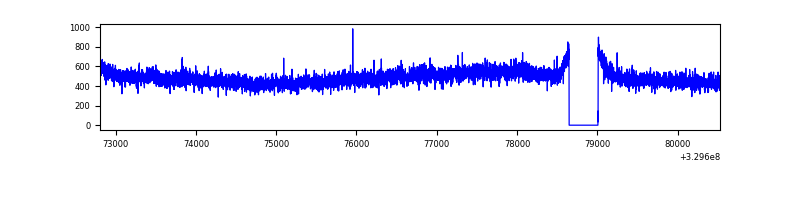 |
| B | 7722 | 7362 | 0 | 0 | 0.00% | 0.00% | 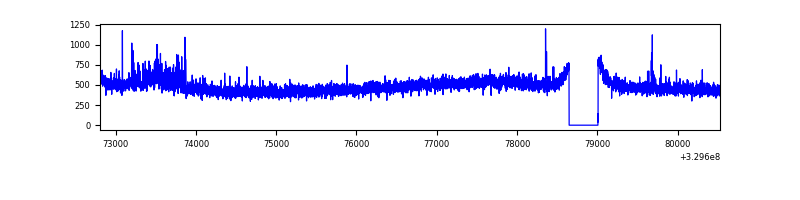 |
| C | 7723 | 7363 | 137 | 137 | 1.77% | 1.86% | 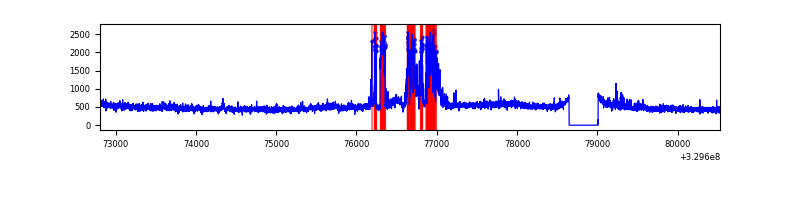 |
| D | 7723 | 7363 | 46 | 46 | 0.60% | 0.62% | 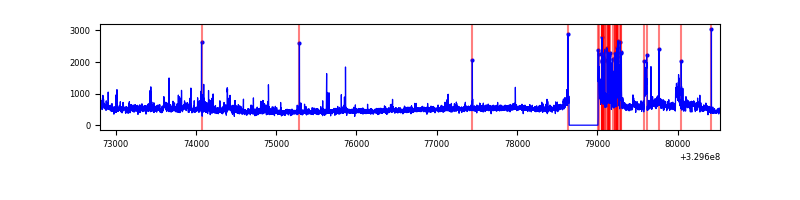 |
Top three noisy pixels from each quadrant. If the there are fewer than three noisy pixels in the level2.evt file, extra rows are filled as -1
| Pixel properties | Quadrant properties | ||||||
|---|---|---|---|---|---|---|---|
| Quadrant | DetID | PixID | Counts | Sigma | Mean | Median | Sigma |
| A | 6 | 16 | 101804 | 555.75 | 894 | 872 | 181.6 |
| A | 13 | 254 | 10601 | 53.57 | 894 | 872 | 181.6 |
| A | 3 | 137 | 8198 | 40.34 | 894 | 872 | 181.6 |
| B | 15 | 32 | 76890 | 449.48 | 880 | 858 | 169.2 |
| B | 0 | 229 | 29195 | 167.52 | 880 | 858 | 169.2 |
| B | 12 | 111 | 20956 | 118.81 | 880 | 858 | 169.2 |
| C | 9 | 54 | 565609 | 2876.63 | 838 | 843 | 196.3 |
| C | 7 | 87 | 218727 | 1109.79 | 838 | 843 | 196.3 |
| C | 14 | 238 | 134532 | 680.94 | 838 | 843 | 196.3 |
| D | 7 | 238 | 389346 | 1852.39 | 862 | 837 | 209.7 |
| D | 9 | 35 | 156167 | 740.61 | 862 | 837 | 209.7 |
| D | 8 | 195 | 146880 | 696.33 | 862 | 837 | 209.7 |
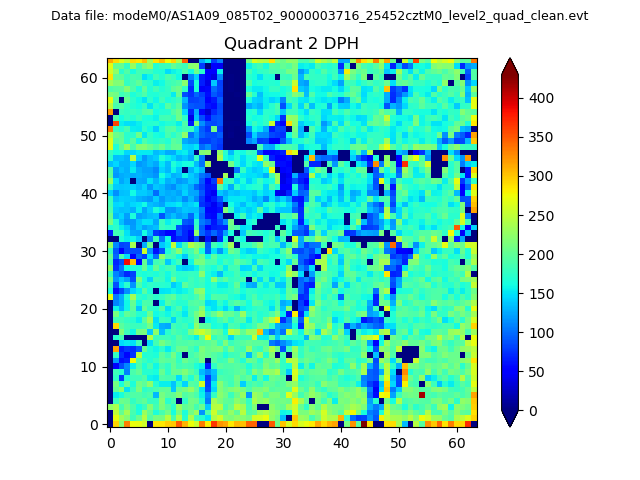
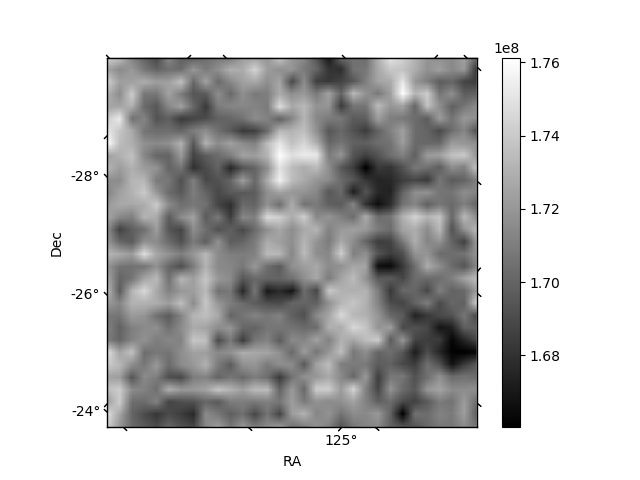
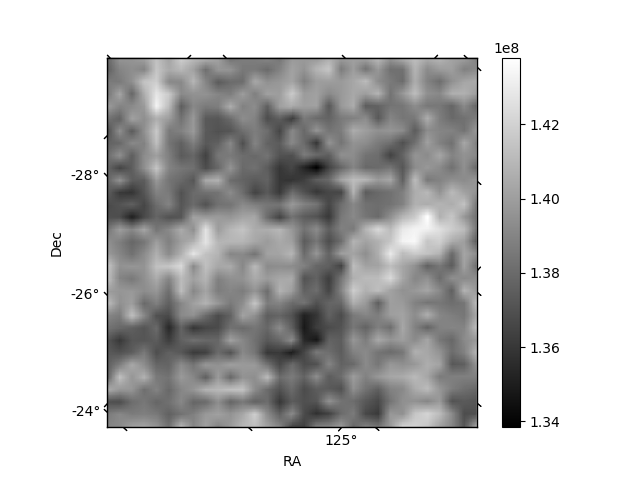
Histogram calculated using DETX and DETY for each event in the final _common_clean file
| Quadrant A | 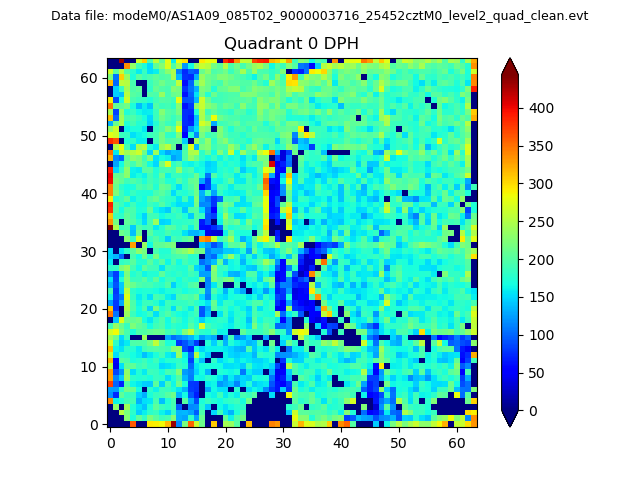 |
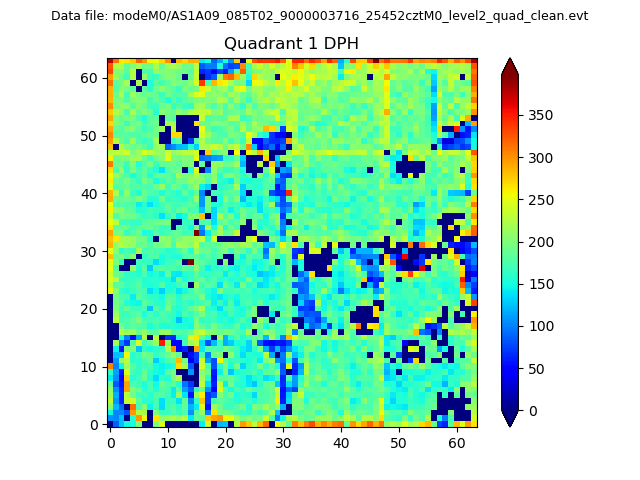 |
Quadrant B |
|---|---|---|---|
| Quadrant D | 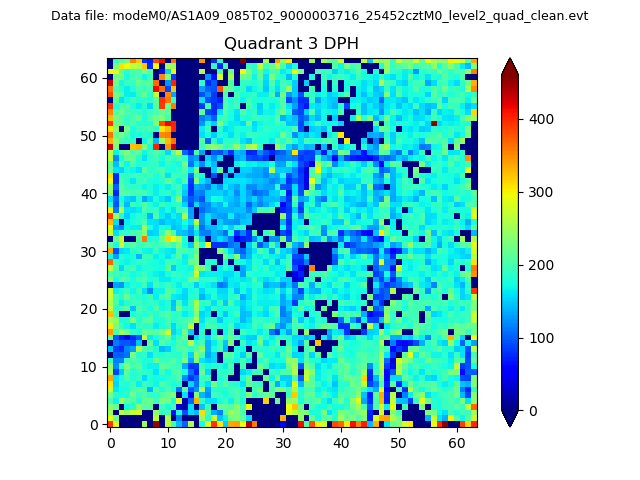 |
 |
Quadrant C |
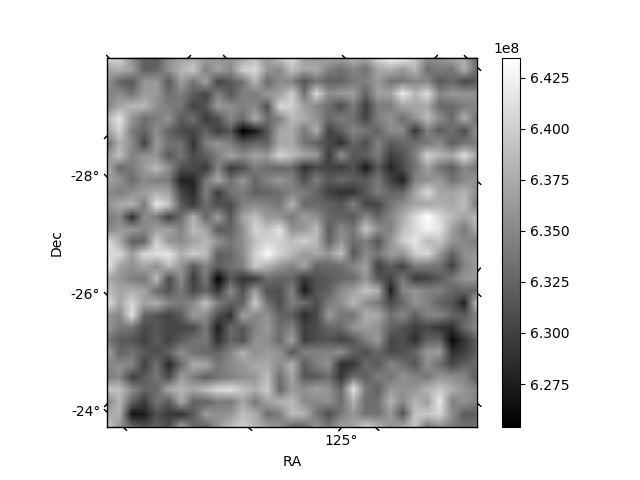
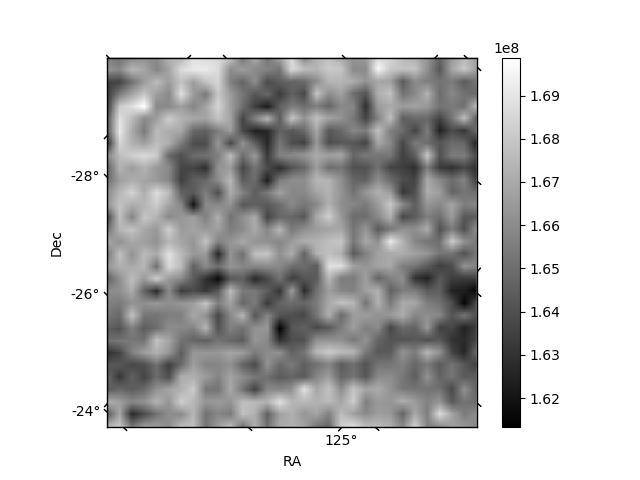
| Plot type | Count rate plots | Images |
|---|---|---|
| Comparison with Poisson distribution Blue bars denote a histogram of data divided into 1 sec bins. Red curve is a Poisson curve with rate = median count rate of data. |
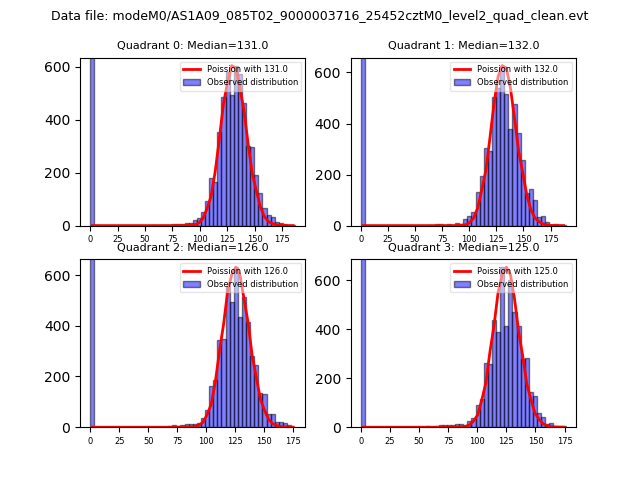 |
 |
| Quadrant-wise count rates Data is divided into 100 sec bins |
 |
|
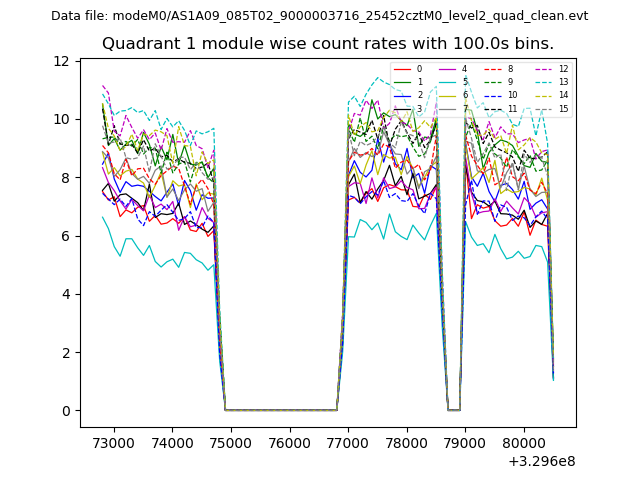
| Module-wise count rates for Quadrant A Data is divided into 100 sec bins |
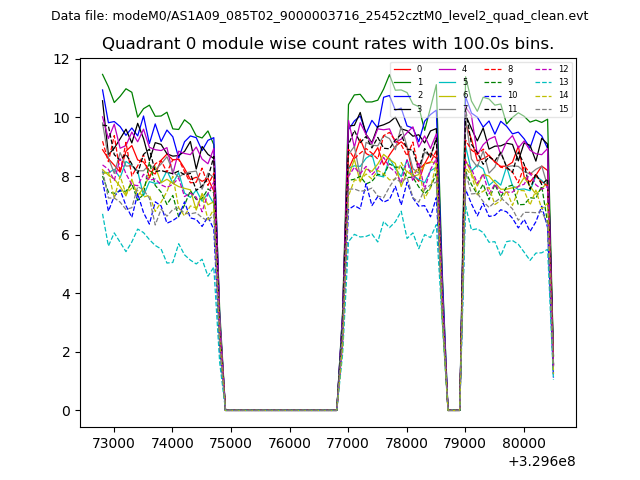 |
 |
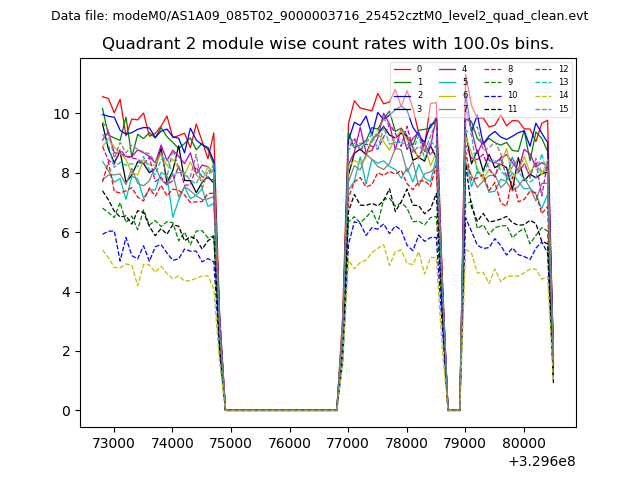
| Module-wise count rates for Quadrant B Data is divided into 100 sec bins |
 |
 |
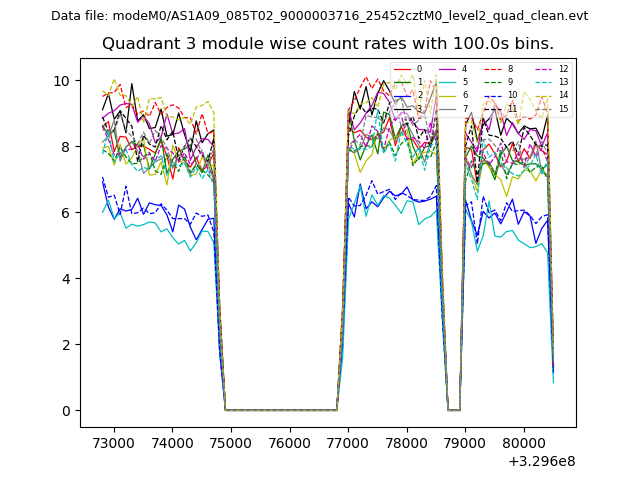
| Module-wise count rates for Quadrant C Data is divided into 100 sec bins |
 |
 |
| Module-wise count rates for Quadrant D Data is divided into 100 sec bins |
 |
 |
| Parameter | Plot |
|---|---|
| CZT HV Monitor | 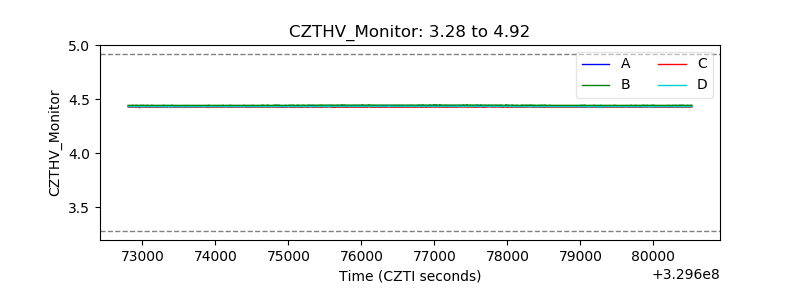 |
| D_VDD | 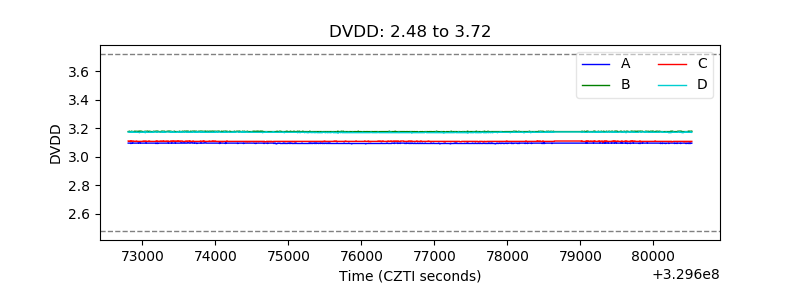 |
| Temperature 1 | 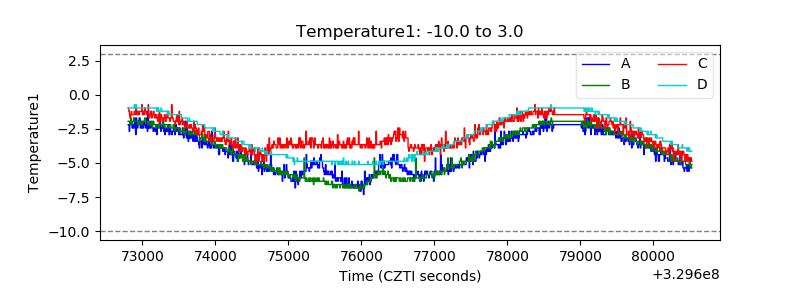 |
| Veto HV Monitor | 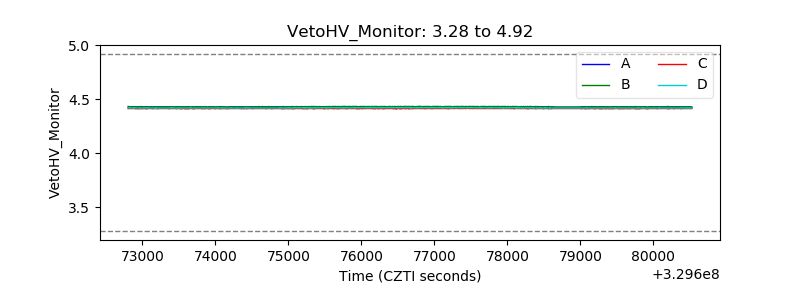 |
| Veto LLD | 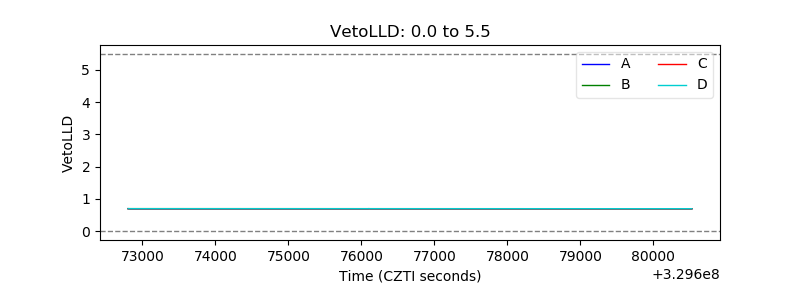 |
| Alpha Counter |  |
| _CPM_Rate | 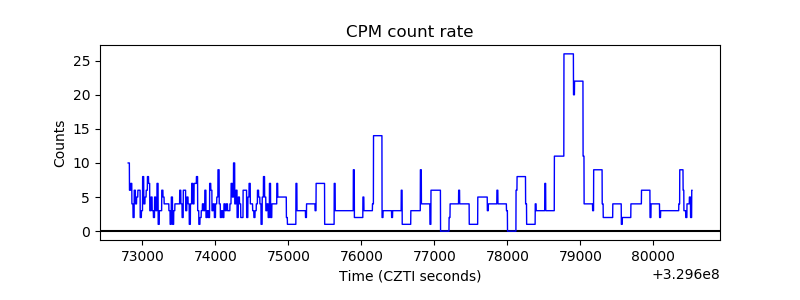 |
| CZT Counter | 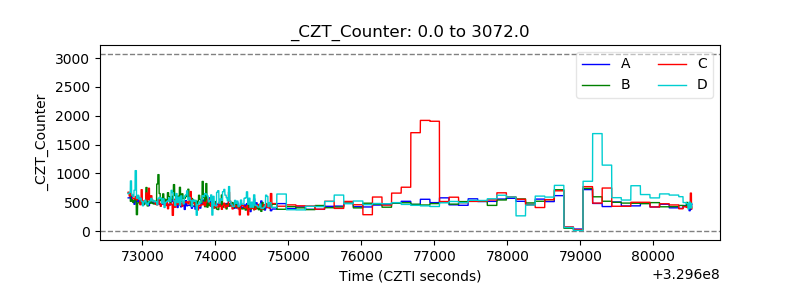 |
| +2.5 Volts monitor |  |
| +5 Volts monitor |  |
| _ROLL_ROT | 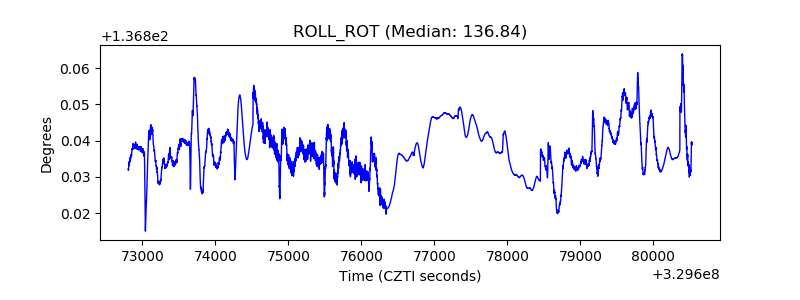 |
| _Roll_DEC | 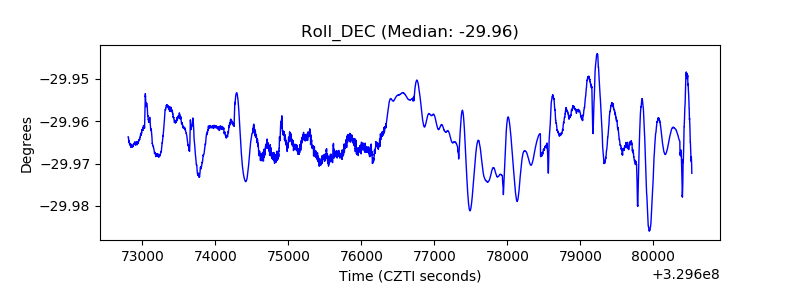 |
| _Roll_RA | 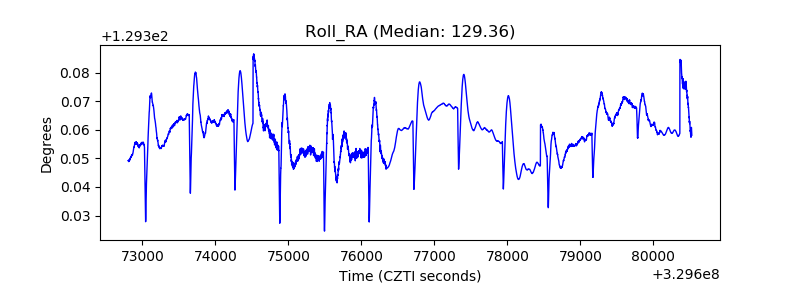 |
| Veto Counter |  |