| Param | Original file | Final file |
|---|---|---|
| Filename | modeM0/AS1A09_085T02_9000003716_25455cztM0_level2.evt | modeM0/AS1A09_085T02_9000003716_25455cztM0_level2_quad_clean.evt |
| Size (bytes) | 1,382,400,000 | 214,456,320 |
| Size | 1.3 GB | 204.5 MB |
| Events in quadrant A | 8,476,010 | 1,363,672 |
| Events in quadrant B | 8,440,010 | 1,373,208 |
| Events in quadrant C | 8,699,765 | 1,317,095 |
| Events in quadrant D | 15,042,437 | 1,208,893 |
| Mode M9 | |||
|---|---|---|---|
| Quadrant | BADHDUFLAG | Total packets | Discarded packets |
| A | 0 | 20 | 0 |
| B | 0 | 20 | 0 |
| C | 0 | 20 | 0 |
| D | 0 | 20 | 0 |
| Mode M0 | |||
|---|---|---|---|
| Quadrant | BADHDUFLAG | Total packets | Discarded packets |
| A | 0 | 36556 | 0 |
| B | 0 | 36393 | 0 |
| C | 0 | 37228 | 0 |
| D | 0 | 56970 | 0 |
| Quadrant | Total seconds | Saturated seconds | Saturation percentage |
|---|---|---|---|
| A | 17870 | 89 | 0.498041% |
| B | 17871 | 118 | 0.660288% |
| C | 17870 | 189 | 1.057639% |
| D | 17870 | 2562 | 14.336877% |
Noise dominated data is calculated using 1-second bins in cleaned event files. If a bin has >2000 counts, and if more than 50% of those come from <1% of pixels, then it is considered to be noise-dominated and hence unusable.
| Quadrant | # 1 sec bins | Bins with >0 counts | Bins with >2000 counts | High rate bins dominated by noise | Noise dominated (total time) | Noise dominated (detector-on time) | Marked lightcurve |
|---|---|---|---|---|---|---|---|
| A | 19855 | 17873 | 1 | 1 | 0.01% | 0.01% | 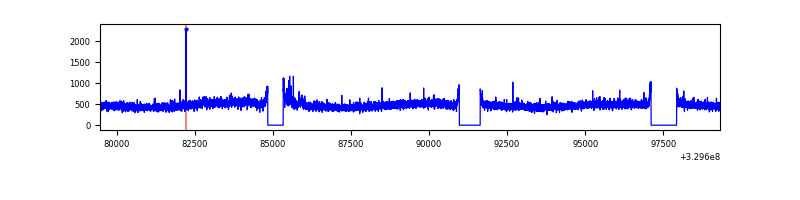 |
| B | 19856 | 17874 | 1 | 1 | 0.01% | 0.01% | 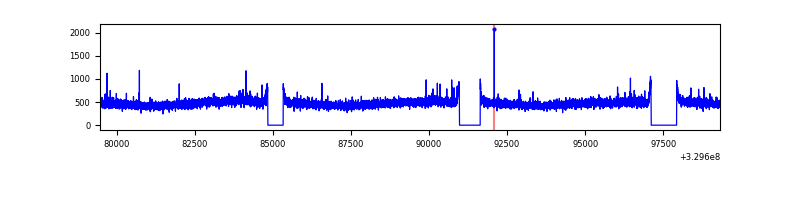 |
| C | 19855 | 17873 | 22 | 22 | 0.11% | 0.12% | 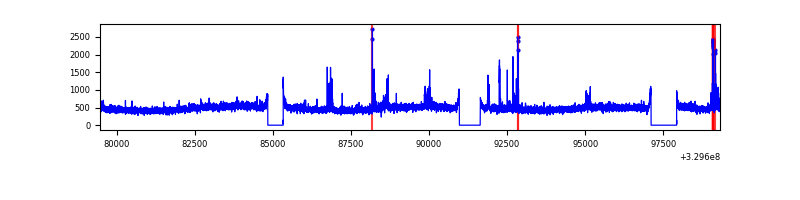 |
| D | 19855 | 17873 | 2021 | 2021 | 10.18% | 11.31% | 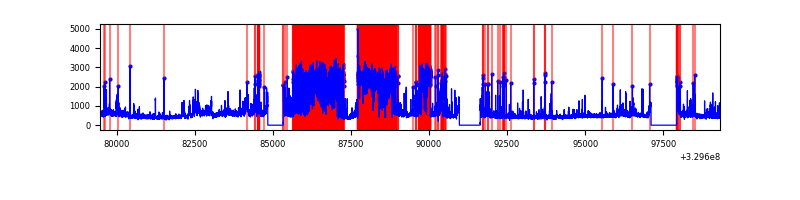 |
Top three noisy pixels from each quadrant. If the there are fewer than three noisy pixels in the level2.evt file, extra rows are filled as -1
| Pixel properties | Quadrant properties | ||||||
|---|---|---|---|---|---|---|---|
| Quadrant | DetID | PixID | Counts | Sigma | Mean | Median | Sigma |
| A | 6 | 16 | 128282 | 291.9 | 2162 | 2116 | 432.2 |
| A | 13 | 254 | 27497 | 58.72 | 2162 | 2116 | 432.2 |
| A | 3 | 137 | 20222 | 41.89 | 2162 | 2116 | 432.2 |
| B | 12 | 111 | 51114 | 120.76 | 2135 | 2080 | 406.0 |
| B | 11 | 111 | 46183 | 108.62 | 2135 | 2080 | 406.0 |
| B | 14 | 111 | 41614 | 97.36 | 2135 | 2080 | 406.0 |
| C | 14 | 238 | 329293 | 684.9 | 2051 | 2065 | 477.8 |
| C | 7 | 87 | 276684 | 574.79 | 2051 | 2065 | 477.8 |
| C | 9 | 54 | 94571 | 193.62 | 2051 | 2065 | 477.8 |
| D | 7 | 238 | 5968007 | 12923.92 | 1905 | 1851 | 461.6 |
| D | 1 | 52 | 1292913 | 2796.71 | 1905 | 1851 | 461.6 |
| D | 8 | 195 | 189505 | 406.5 | 1905 | 1851 | 461.6 |
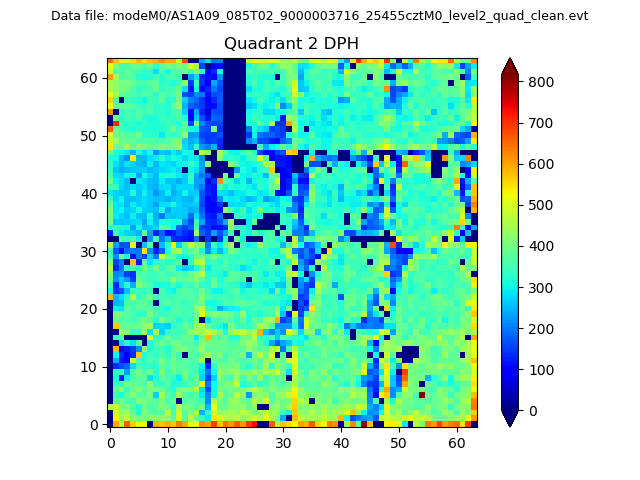
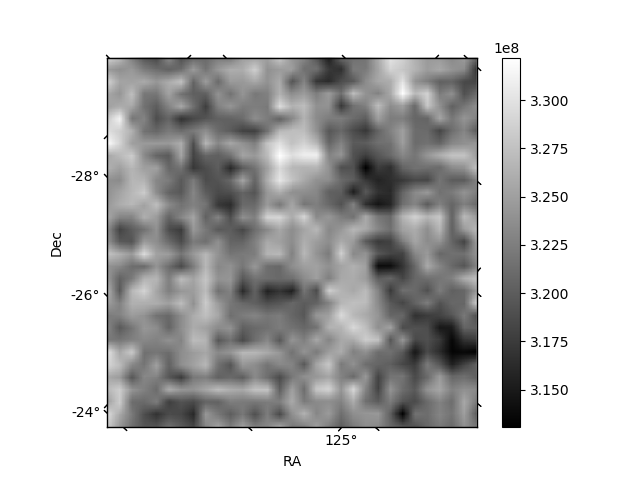
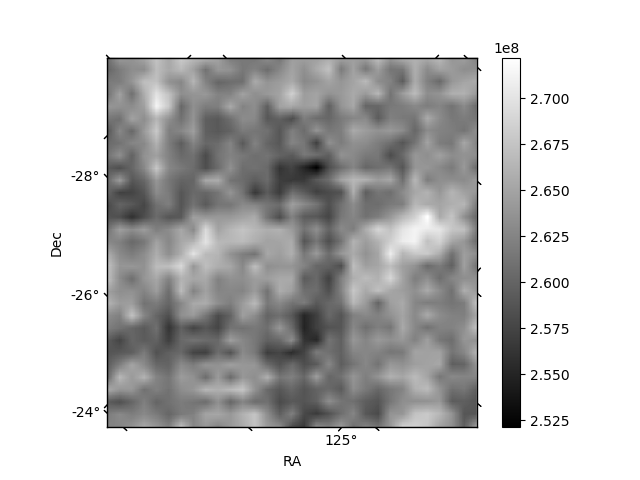
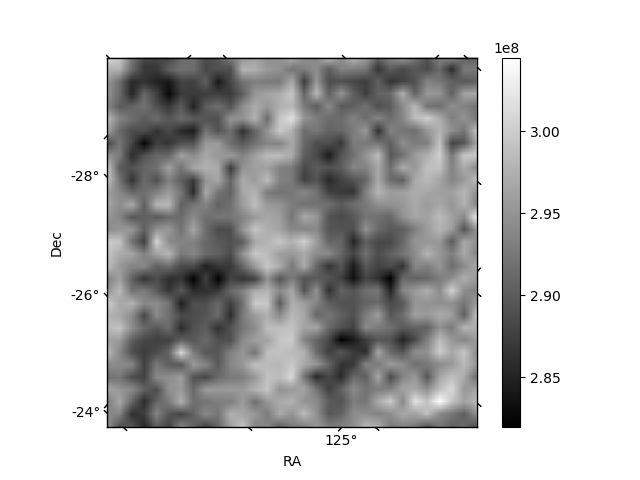
Histogram calculated using DETX and DETY for each event in the final _common_clean file
| Quadrant A | 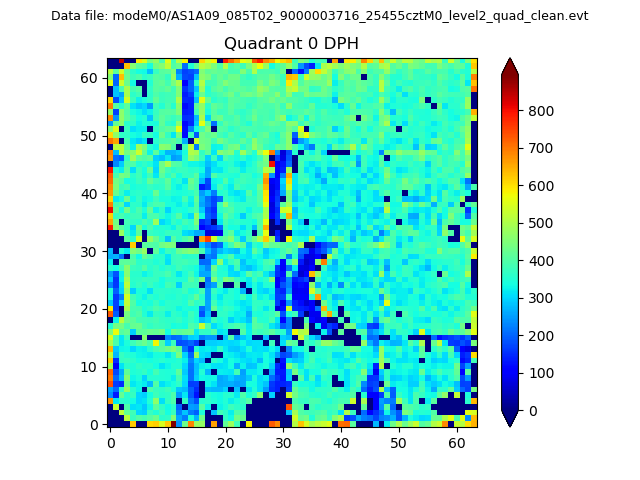 |
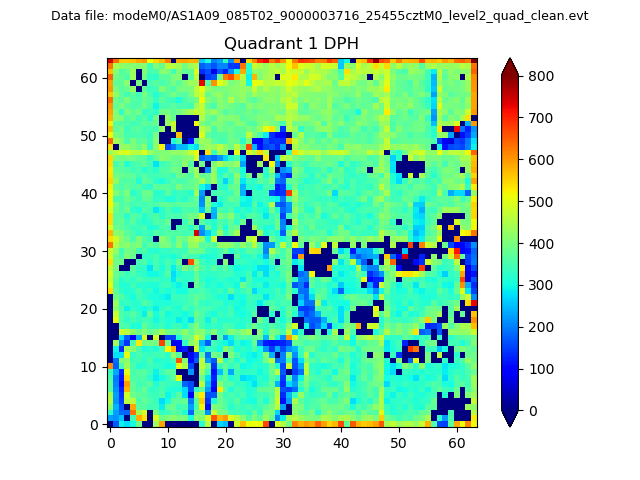 |
Quadrant B |
|---|---|---|---|
| Quadrant D | 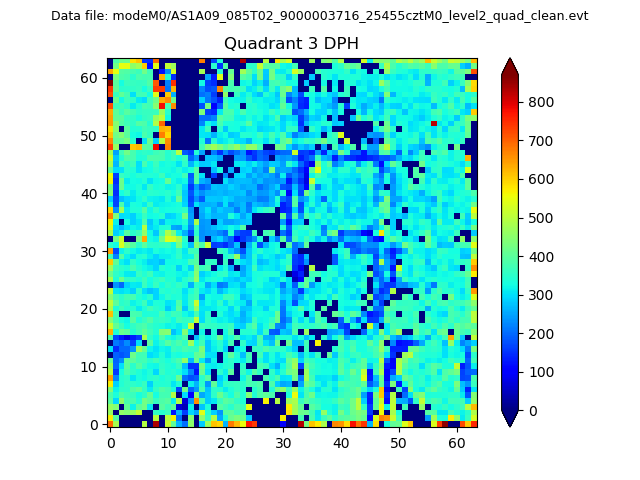 |
 |
Quadrant C |
| Plot type | Count rate plots | Images |
|---|---|---|
| Comparison with Poisson distribution Blue bars denote a histogram of data divided into 1 sec bins. Red curve is a Poisson curve with rate = median count rate of data. |
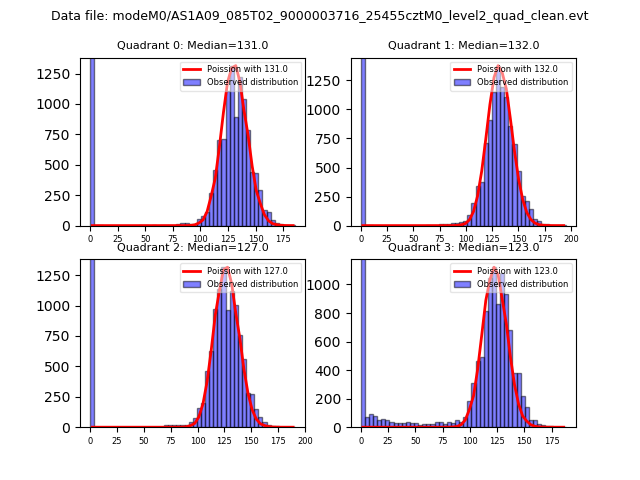 |
 |
| Quadrant-wise count rates Data is divided into 100 sec bins |
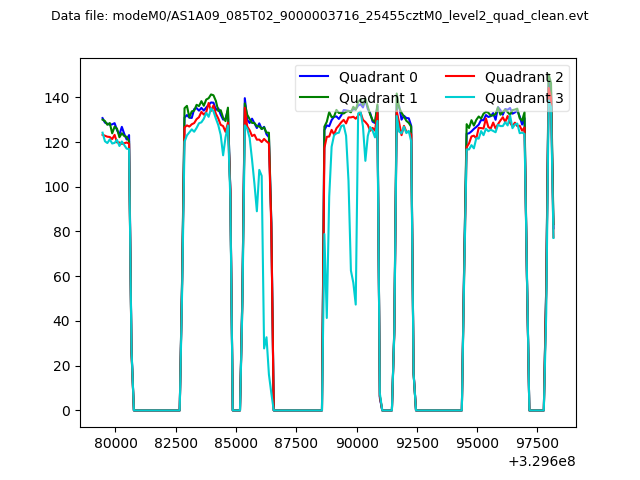 |
|
| Module-wise count rates for Quadrant A Data is divided into 100 sec bins |
 |
 |
| Module-wise count rates for Quadrant B Data is divided into 100 sec bins |
 |
 |
| Module-wise count rates for Quadrant C Data is divided into 100 sec bins |
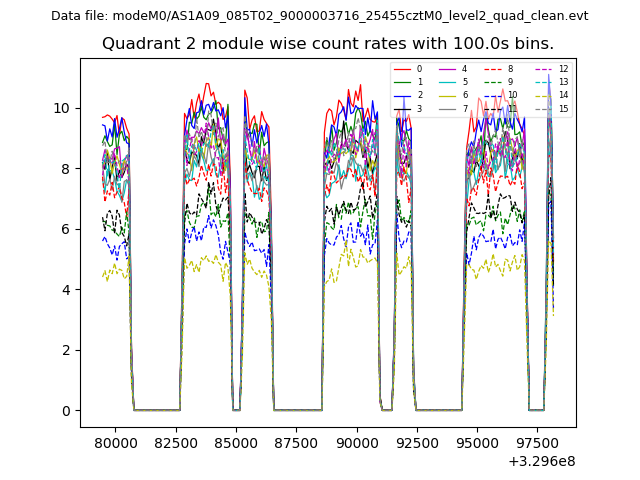 |
 |
| Module-wise count rates for Quadrant D Data is divided into 100 sec bins |
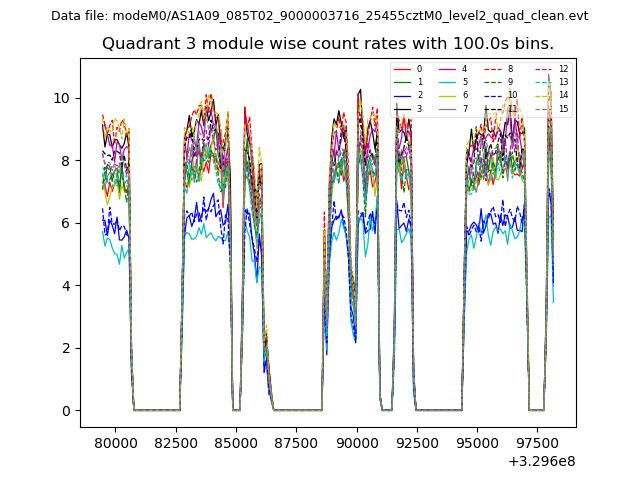 |
 |
| Parameter | Plot |
|---|---|
| CZT HV Monitor |  |
| D_VDD | 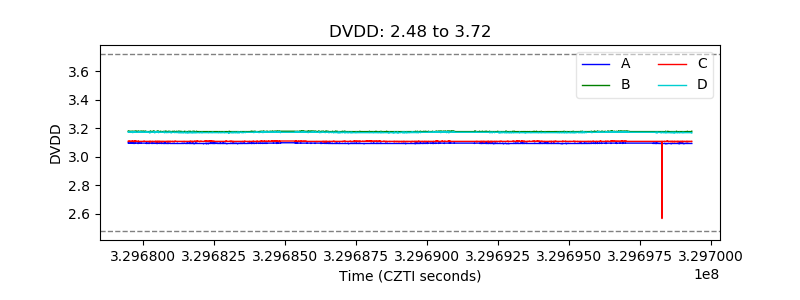 |
| Temperature 1 | 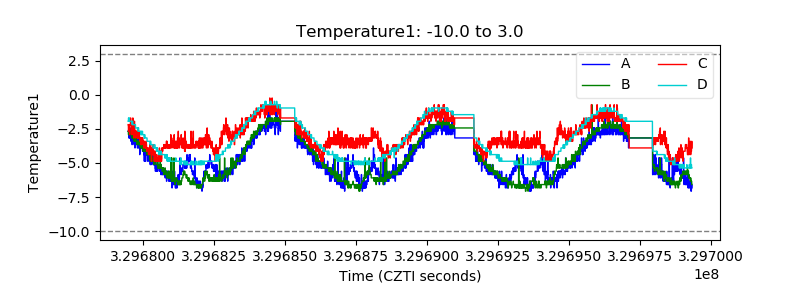 |
| Veto HV Monitor | 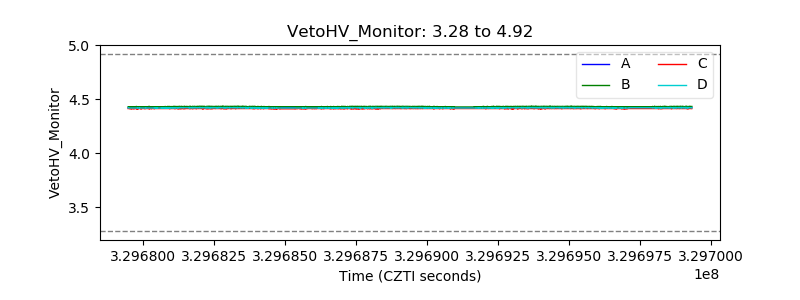 |
| Veto LLD | 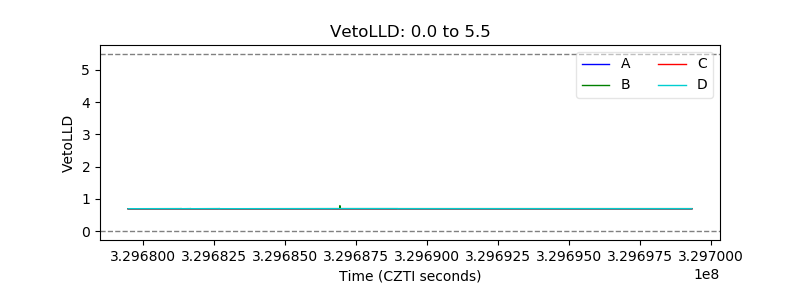 |
| Alpha Counter | 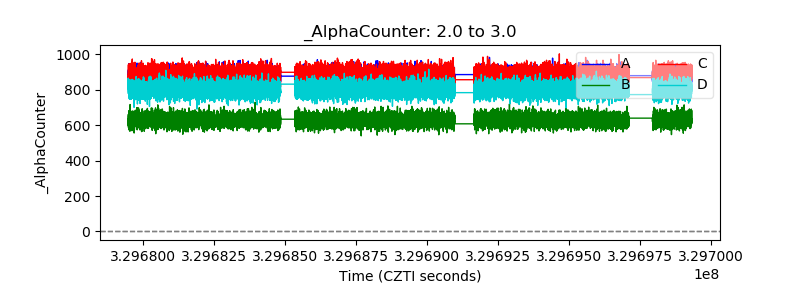 |
| _CPM_Rate | 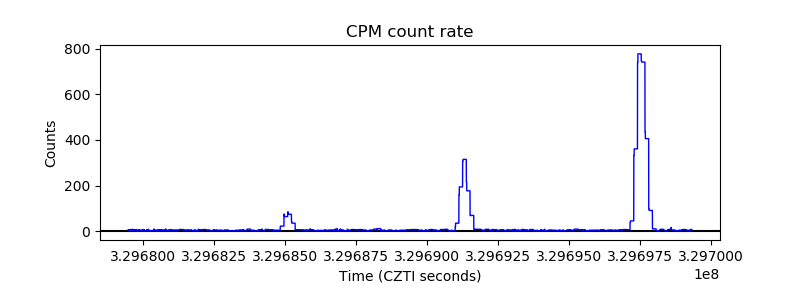 |
| CZT Counter | 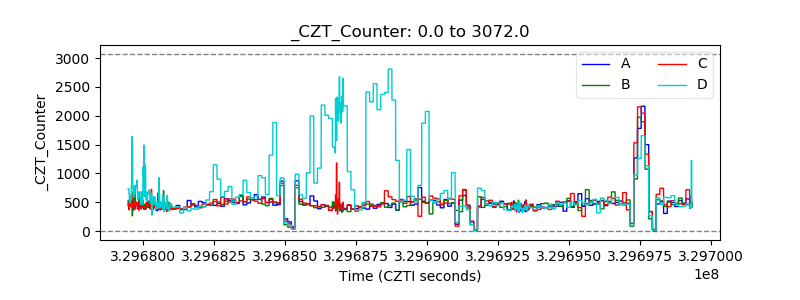 |
| +2.5 Volts monitor | 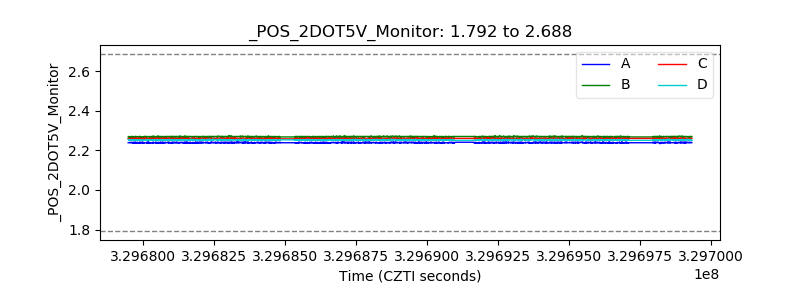 |
| +5 Volts monitor | 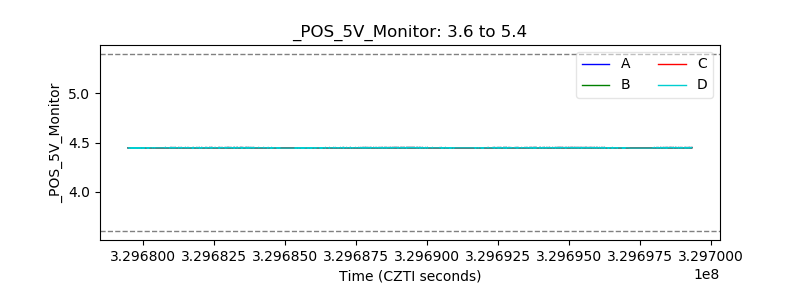 |
| _ROLL_ROT | 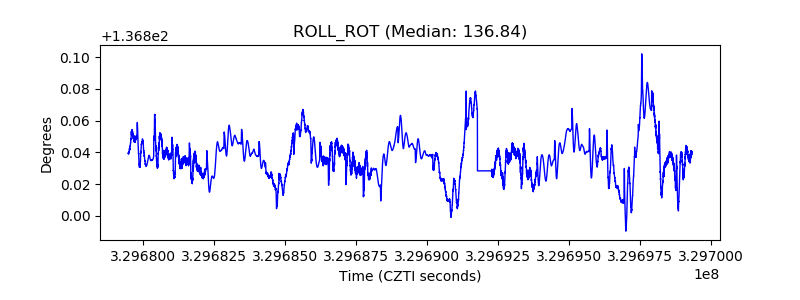 |
| _Roll_DEC | 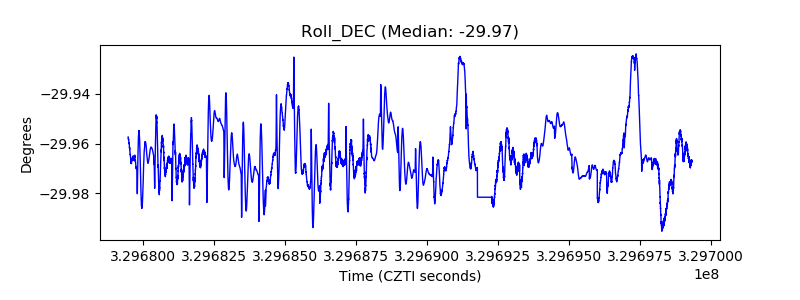 |
| _Roll_RA | 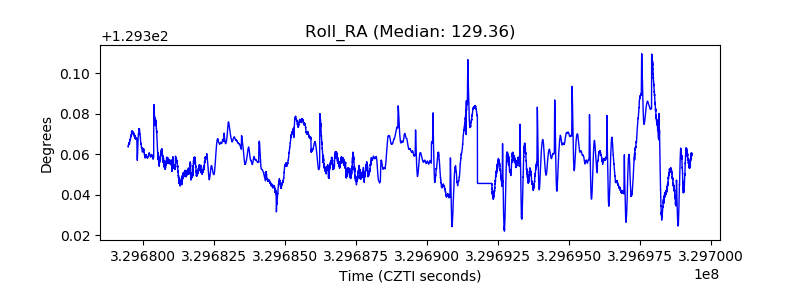 |
| Veto Counter |  |