| Param | Original file | Final file |
|---|---|---|
| Filename | modeM0/AS1A09_085T02_9000003716_25456cztM0_level2.evt | modeM0/AS1A09_085T02_9000003716_25456cztM0_level2_quad_clean.evt |
| Size (bytes) | 506,197,440 | 69,468,480 |
| Size | 482.7 MB | 66.3 MB |
| Events in quadrant A | 3,414,663 | 417,583 |
| Events in quadrant B | 3,251,588 | 422,317 |
| Events in quadrant C | 3,571,594 | 402,064 |
| Events in quadrant D | 4,637,330 | 394,105 |
| Mode M9 | |||
|---|---|---|---|
| Quadrant | BADHDUFLAG | Total packets | Discarded packets |
| A | 0 | 13 | 0 |
| B | 0 | 14 | 0 |
| C | 0 | 14 | 0 |
| D | 0 | 14 | 0 |
| Mode M0 | |||
|---|---|---|---|
| Quadrant | BADHDUFLAG | Total packets | Discarded packets |
| A | 0 | 14471 | 0 |
| B | 0 | 13746 | 0 |
| C | 0 | 14710 | 0 |
| D | 0 | 18161 | 0 |
| Quadrant | Total seconds | Saturated seconds | Saturation percentage |
|---|---|---|---|
| A | 6704 | 29 | 0.432578% |
| B | 6704 | 31 | 0.462411% |
| C | 6704 | 138 | 2.058473% |
| D | 6704 | 299 | 4.460024% |
Noise dominated data is calculated using 1-second bins in cleaned event files. If a bin has >2000 counts, and if more than 50% of those come from <1% of pixels, then it is considered to be noise-dominated and hence unusable.
| Quadrant | # 1 sec bins | Bins with >0 counts | Bins with >2000 counts | High rate bins dominated by noise | Noise dominated (total time) | Noise dominated (detector-on time) | Marked lightcurve |
|---|---|---|---|---|---|---|---|
| A | 7694 | 6705 | 0 | 0 | 0.00% | 0.00% | 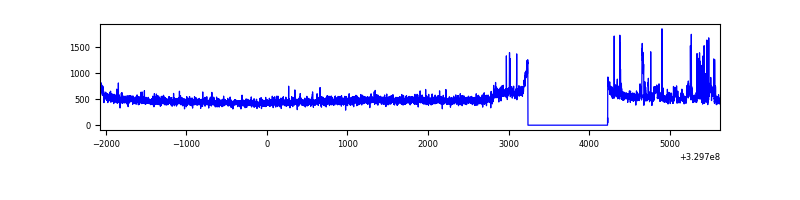 |
| B | 7694 | 6705 | 0 | 0 | 0.00% | 0.00% | 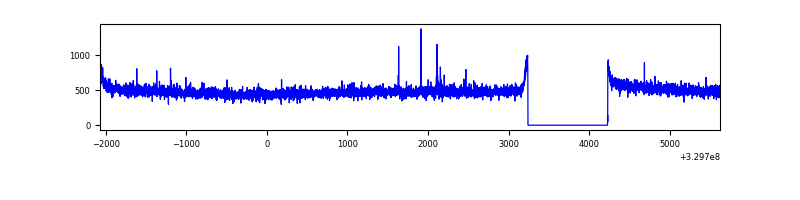 |
| C | 7694 | 6705 | 46 | 46 | 0.60% | 0.69% | 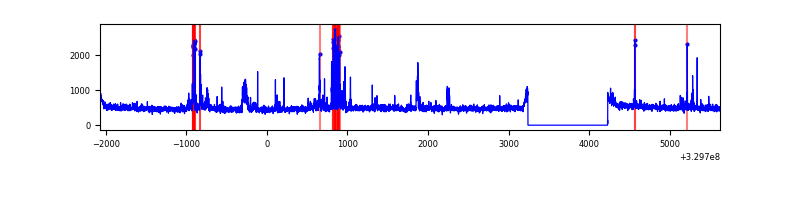 |
| D | 7694 | 6705 | 319 | 319 | 4.15% | 4.76% | 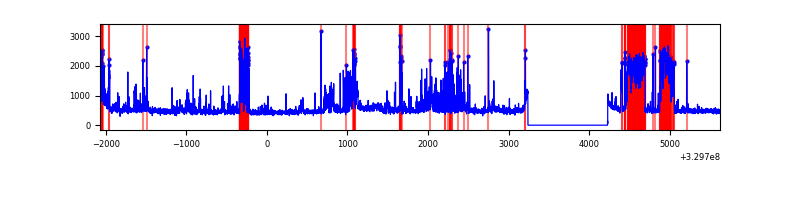 |
Top three noisy pixels from each quadrant. If the there are fewer than three noisy pixels in the level2.evt file, extra rows are filled as -1
| Pixel properties | Quadrant properties | ||||||
|---|---|---|---|---|---|---|---|
| Quadrant | DetID | PixID | Counts | Sigma | Mean | Median | Sigma |
| A | 6 | 16 | 203608 | 1211.91 | 833 | 815 | 167.3 |
| A | 13 | 254 | 10721 | 59.2 | 833 | 815 | 167.3 |
| A | 3 | 137 | 7664 | 40.93 | 833 | 815 | 167.3 |
| B | 12 | 111 | 19610 | 119.49 | 826 | 803 | 157.4 |
| B | 11 | 111 | 17509 | 106.14 | 826 | 803 | 157.4 |
| B | 14 | 111 | 15984 | 96.45 | 826 | 803 | 157.4 |
| C | 9 | 54 | 353681 | 1917.27 | 790 | 795 | 184.1 |
| C | 14 | 238 | 127313 | 687.39 | 790 | 795 | 184.1 |
| C | 2 | 16 | 11203 | 56.55 | 790 | 795 | 184.1 |
| D | 1 | 52 | 1448910 | 7473.11 | 795 | 770 | 193.8 |
| D | 8 | 195 | 93300 | 477.5 | 795 | 770 | 193.8 |
| D | 7 | 238 | 47013 | 238.64 | 795 | 770 | 193.8 |
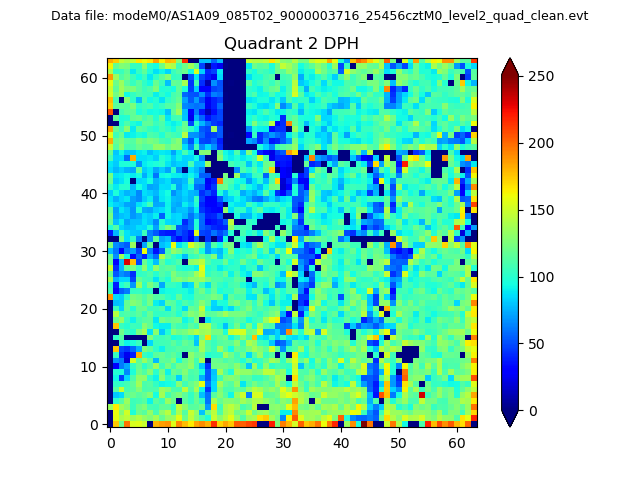
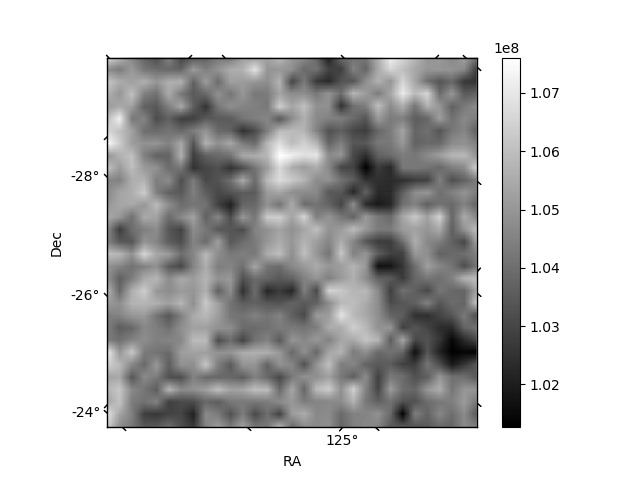
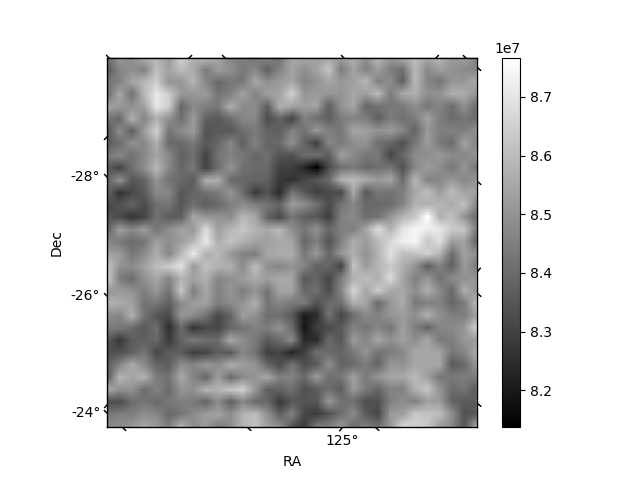
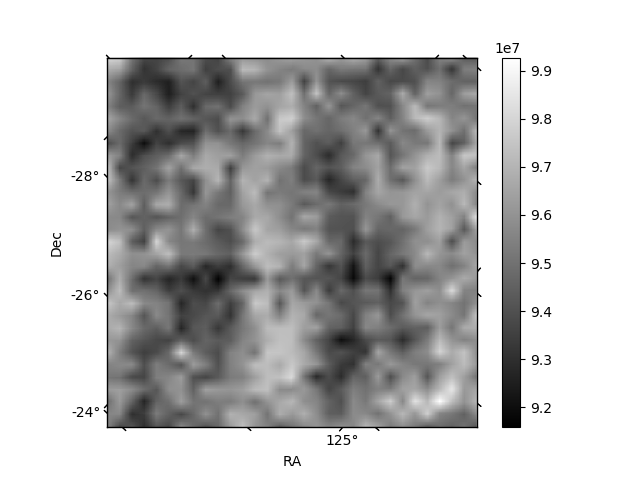
Histogram calculated using DETX and DETY for each event in the final _common_clean file
| Quadrant A | 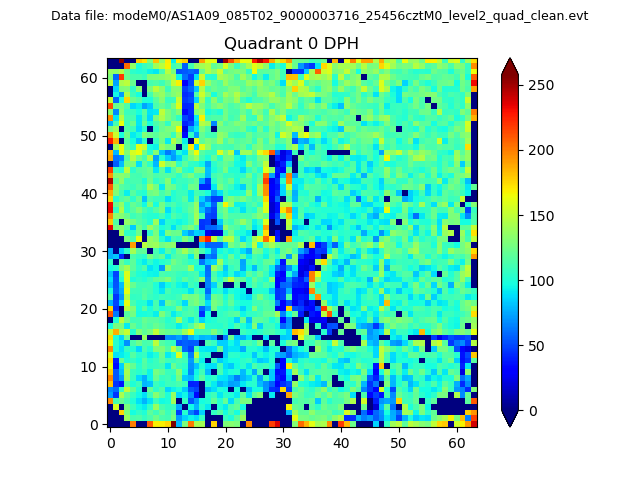 |
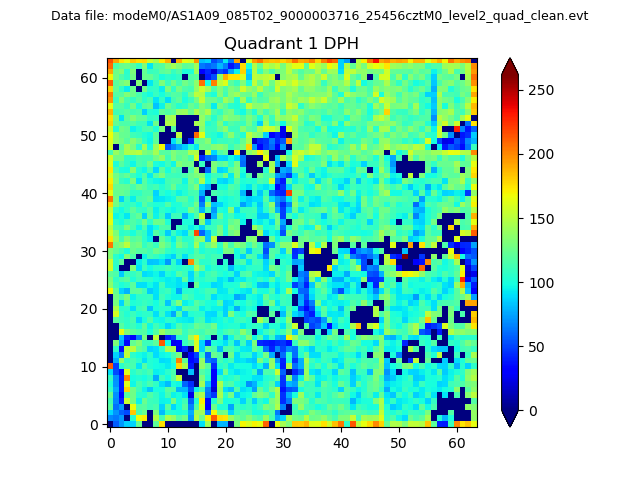 |
Quadrant B |
|---|---|---|---|
| Quadrant D | 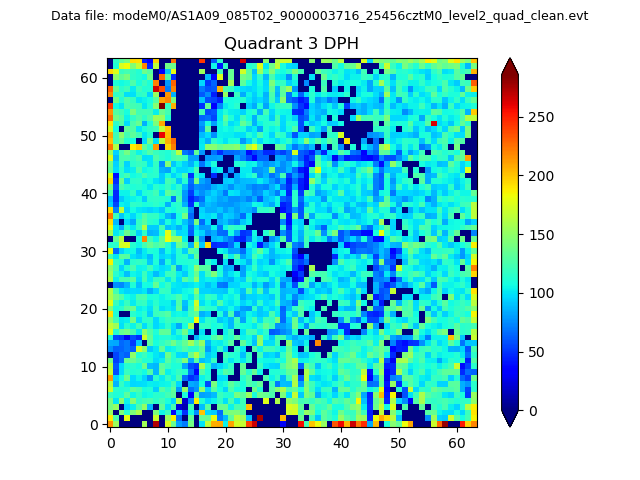 |
 |
Quadrant C |
| Plot type | Count rate plots | Images |
|---|---|---|
| Comparison with Poisson distribution Blue bars denote a histogram of data divided into 1 sec bins. Red curve is a Poisson curve with rate = median count rate of data. |
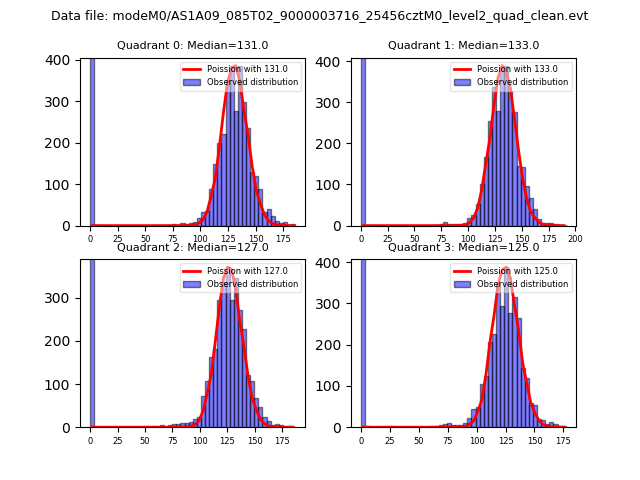 |
 |
| Quadrant-wise count rates Data is divided into 100 sec bins |
 |
|
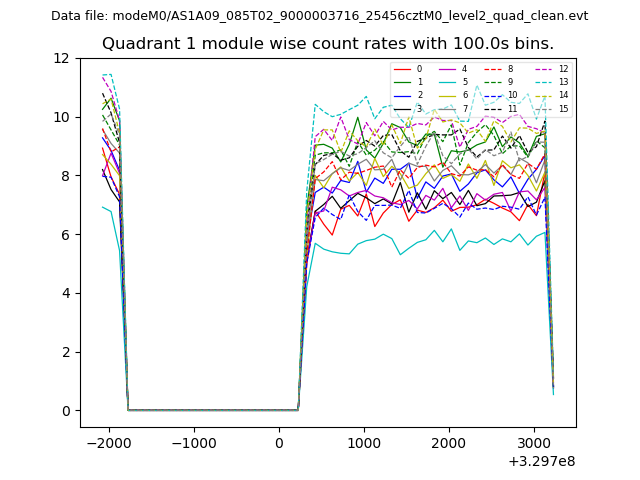
| Module-wise count rates for Quadrant A Data is divided into 100 sec bins |
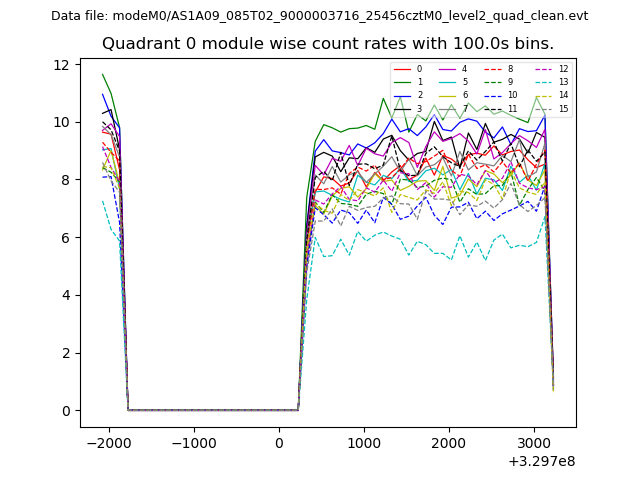 |
 |
| Module-wise count rates for Quadrant B Data is divided into 100 sec bins |
 |
 |
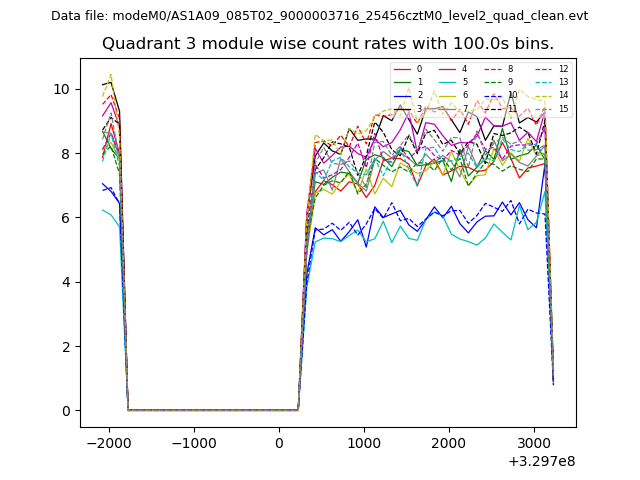
| Module-wise count rates for Quadrant C Data is divided into 100 sec bins |
 |
 |
| Module-wise count rates for Quadrant D Data is divided into 100 sec bins |
 |
 |
| Parameter | Plot |
|---|---|
| CZT HV Monitor | 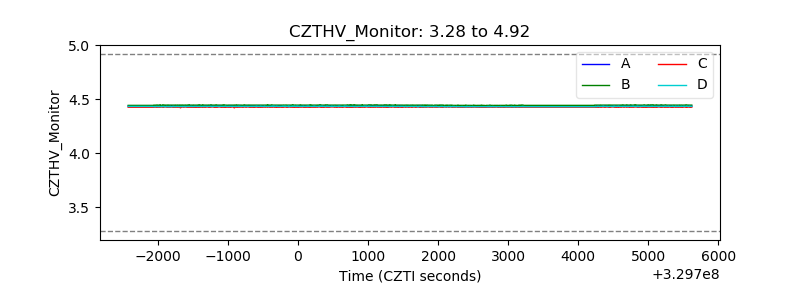 |
| D_VDD | 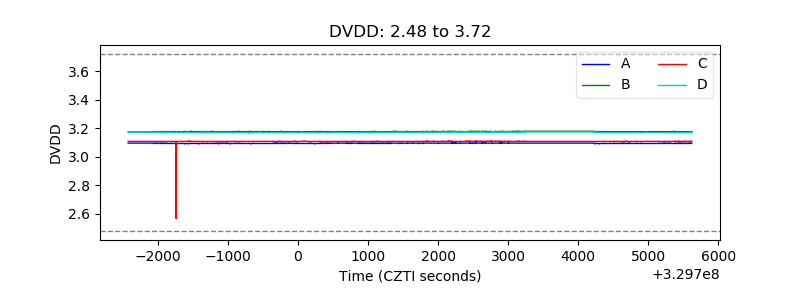 |
| Temperature 1 | 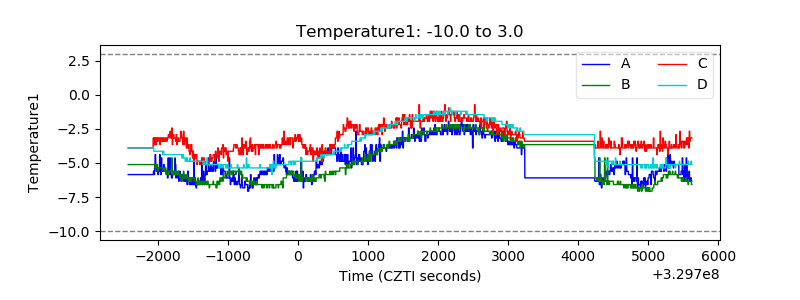 |
| Veto HV Monitor | 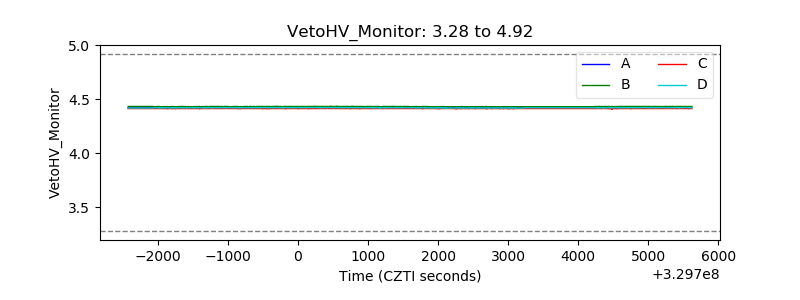 |
| Veto LLD | 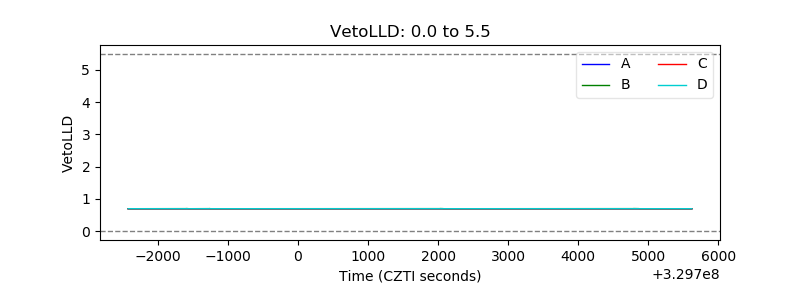 |
| Alpha Counter | 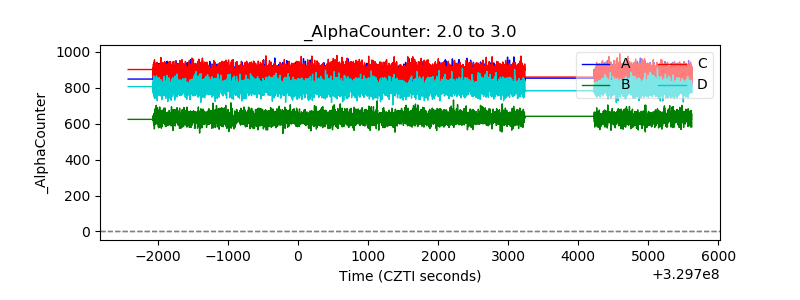 |
| _CPM_Rate | 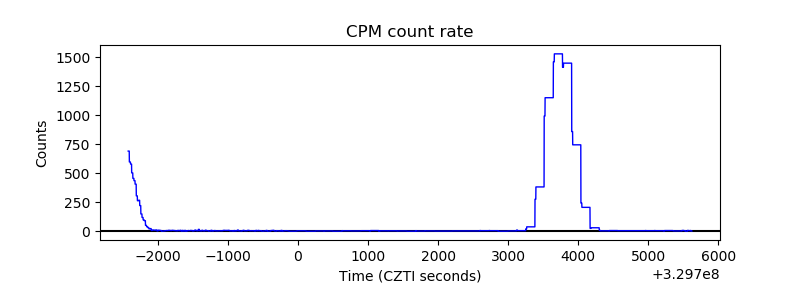 |
| CZT Counter | 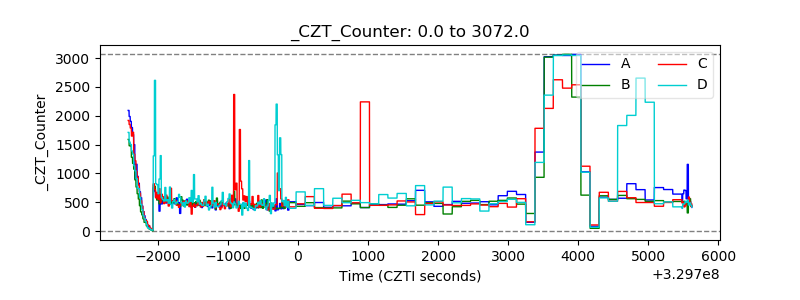 |
| +2.5 Volts monitor |  |
| +5 Volts monitor |  |
| _ROLL_ROT | 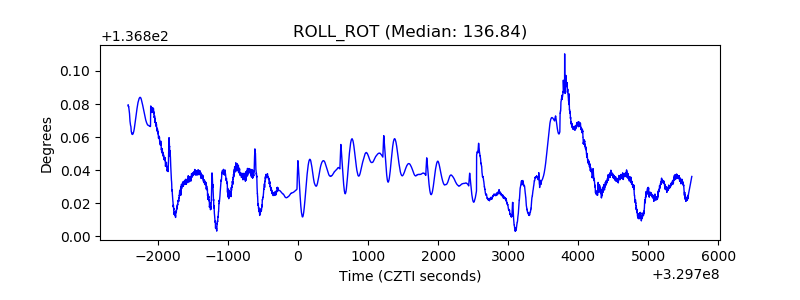 |
| _Roll_DEC | 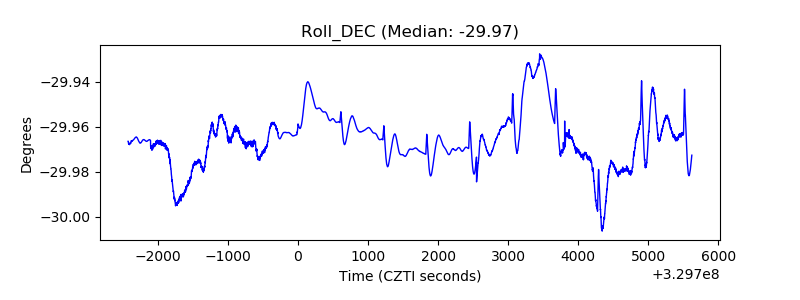 |
| _Roll_RA | 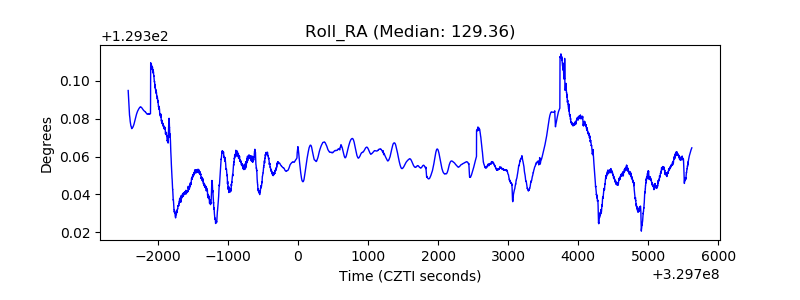 |
| Veto Counter | 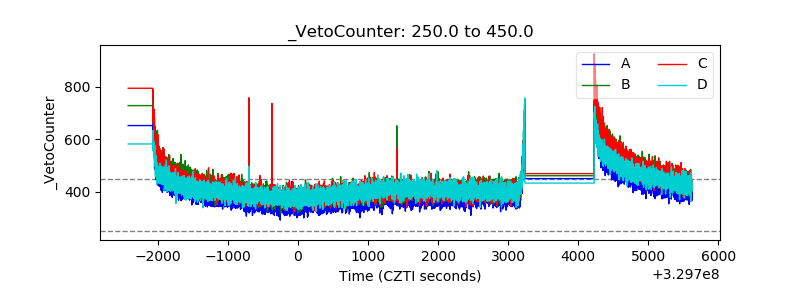 |