| Param | Original file | Final file |
|---|---|---|
| Filename | modeM0/AS1A09_085T02_9000003716_25458cztM0_level2.evt | modeM0/AS1A09_085T02_9000003716_25458cztM0_level2_quad_clean.evt |
| Size (bytes) | 539,582,400 | 68,964,480 |
| Size | 514.6 MB | 65.8 MB |
| Events in quadrant A | 3,820,808 | 421,529 |
| Events in quadrant B | 3,240,665 | 426,654 |
| Events in quadrant C | 4,280,876 | 399,342 |
| Events in quadrant D | 4,576,058 | 404,700 |
| Mode M9 | |||
|---|---|---|---|
| Quadrant | BADHDUFLAG | Total packets | Discarded packets |
| A | 0 | 11 | 0 |
| B | 0 | 11 | 0 |
| C | 0 | 11 | 0 |
| D | 0 | 11 | 0 |
| Mode M0 | |||
|---|---|---|---|
| Quadrant | BADHDUFLAG | Total packets | Discarded packets |
| A | 0 | 15570 | 0 |
| B | 0 | 13405 | 0 |
| C | 0 | 16720 | 0 |
| D | 0 | 17494 | 0 |
| Quadrant | Total seconds | Saturated seconds | Saturation percentage |
|---|---|---|---|
| A | 6237 | 46 | 0.737534% |
| B | 6238 | 37 | 0.593139% |
| C | 6238 | 267 | 4.280218% |
| D | 6238 | 302 | 4.841295% |
Noise dominated data is calculated using 1-second bins in cleaned event files. If a bin has >2000 counts, and if more than 50% of those come from <1% of pixels, then it is considered to be noise-dominated and hence unusable.
| Quadrant | # 1 sec bins | Bins with >0 counts | Bins with >2000 counts | High rate bins dominated by noise | Noise dominated (total time) | Noise dominated (detector-on time) | Marked lightcurve |
|---|---|---|---|---|---|---|---|
| A | 7367 | 6238 | 8 | 8 | 0.11% | 0.13% | 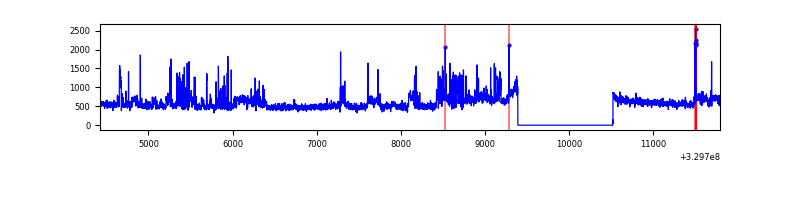 |
| B | 7368 | 6239 | 0 | 0 | 0.00% | 0.00% | 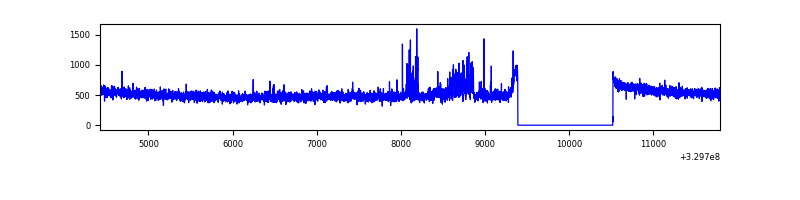 |
| C | 7368 | 6239 | 132 | 132 | 1.79% | 2.12% | 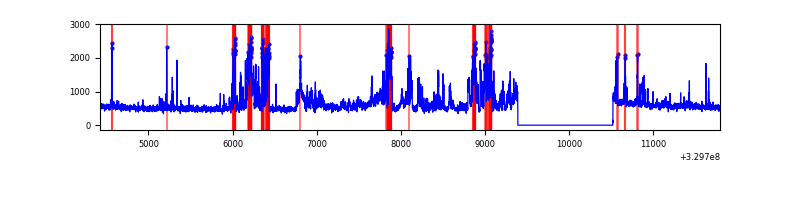 |
| D | 7368 | 6239 | 293 | 293 | 3.98% | 4.70% | 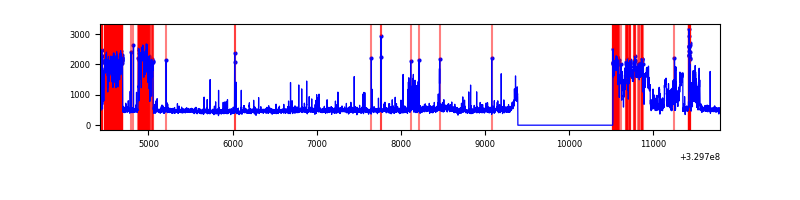 |
Top three noisy pixels from each quadrant. If the there are fewer than three noisy pixels in the level2.evt file, extra rows are filled as -1
| Pixel properties | Quadrant properties | ||||||
|---|---|---|---|---|---|---|---|
| Quadrant | DetID | PixID | Counts | Sigma | Mean | Median | Sigma |
| A | 6 | 16 | 723122 | 4496.72 | 803 | 790 | 160.6 |
| A | 13 | 254 | 10144 | 58.23 | 803 | 790 | 160.6 |
| A | 3 | 137 | 7261 | 40.28 | 803 | 790 | 160.6 |
| B | 15 | 32 | 93599 | 616.54 | 797 | 779 | 150.5 |
| B | 12 | 111 | 18526 | 117.88 | 797 | 779 | 150.5 |
| B | 0 | 190 | 18510 | 117.78 | 797 | 779 | 150.5 |
| C | 9 | 54 | 1176669 | 6705.93 | 760 | 767 | 175.4 |
| C | 14 | 238 | 123485 | 699.84 | 760 | 767 | 175.4 |
| C | 2 | 16 | 13603 | 73.2 | 760 | 767 | 175.4 |
| D | 1 | 52 | 1480222 | 7955.3 | 771 | 749 | 186.0 |
| D | 8 | 195 | 112697 | 601.96 | 771 | 749 | 186.0 |
| D | 2 | 82 | 42611 | 225.09 | 771 | 749 | 186.0 |
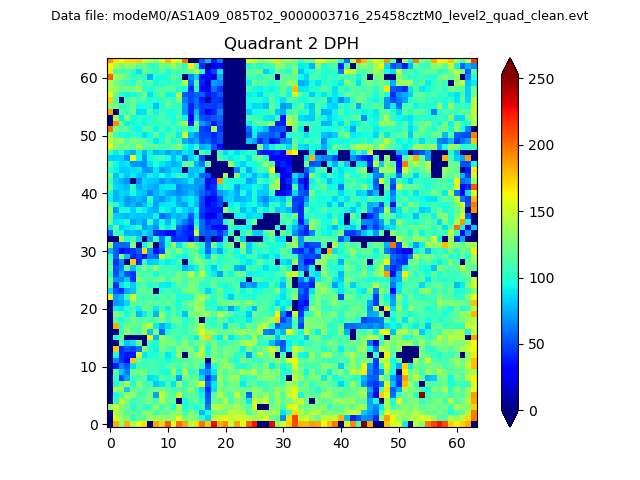
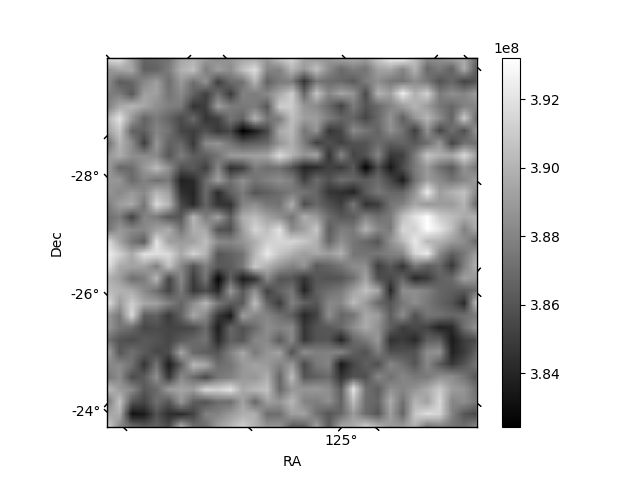
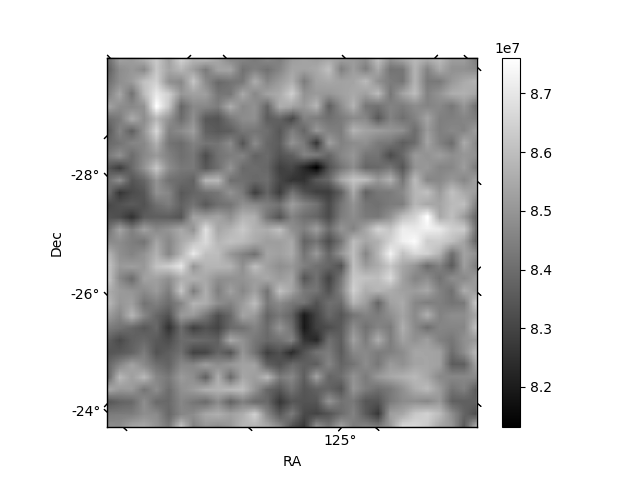
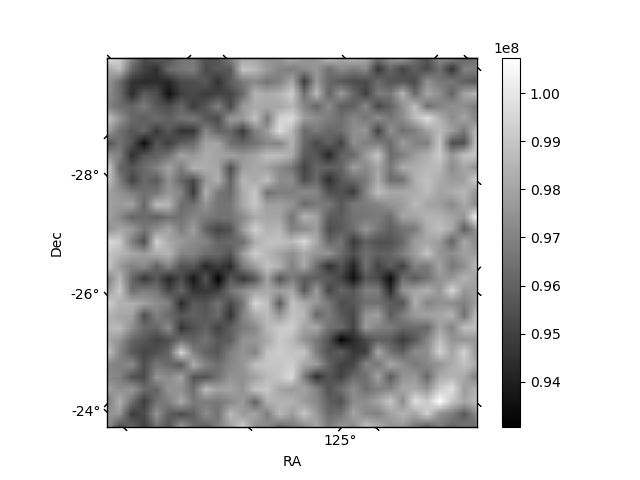
Histogram calculated using DETX and DETY for each event in the final _common_clean file
| Quadrant A | 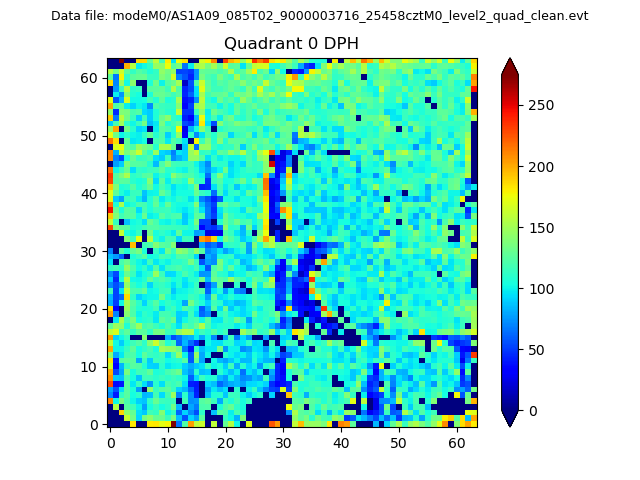 |
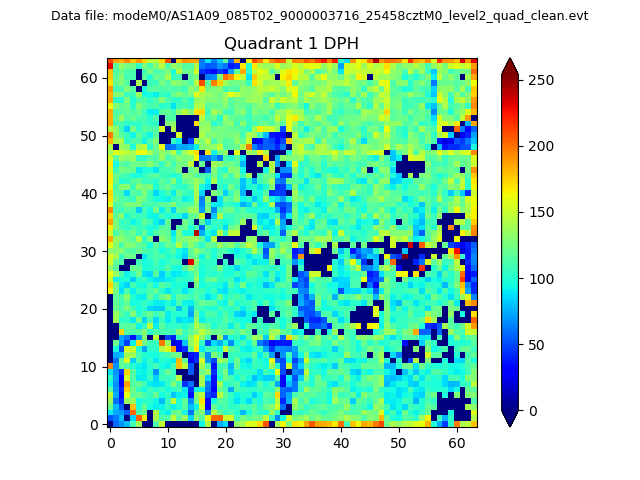 |
Quadrant B |
|---|---|---|---|
| Quadrant D | 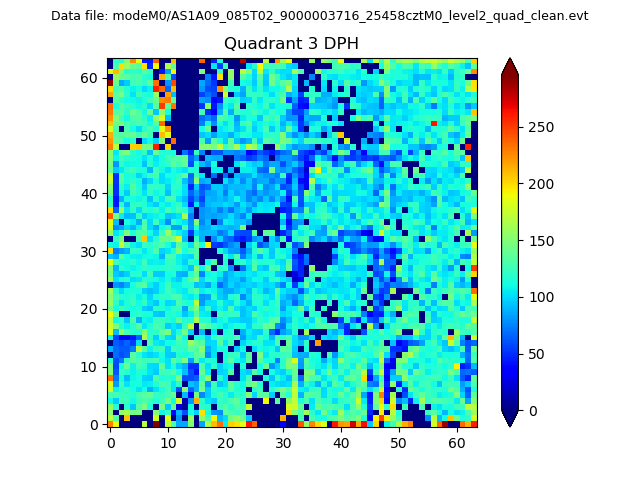 |
 |
Quadrant C |
| Plot type | Count rate plots | Images |
|---|---|---|
| Comparison with Poisson distribution Blue bars denote a histogram of data divided into 1 sec bins. Red curve is a Poisson curve with rate = median count rate of data. |
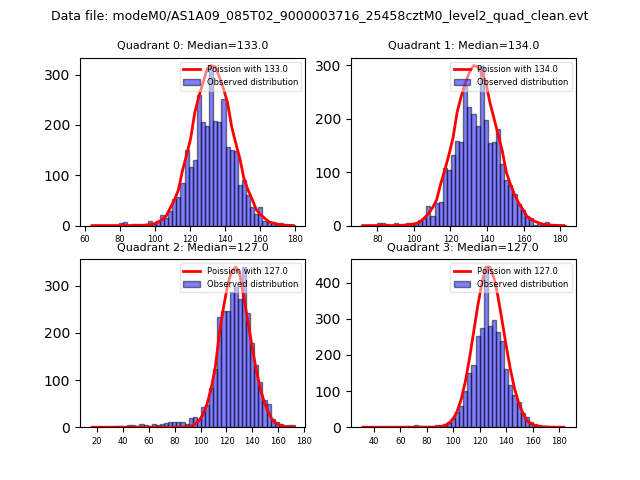 |
 |
| Quadrant-wise count rates Data is divided into 100 sec bins |
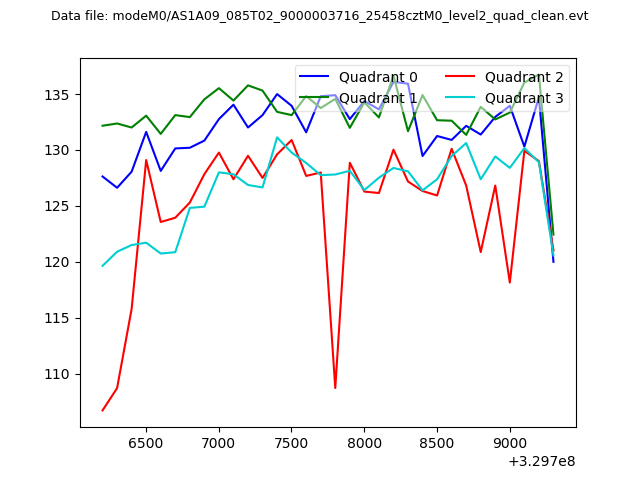 |
|
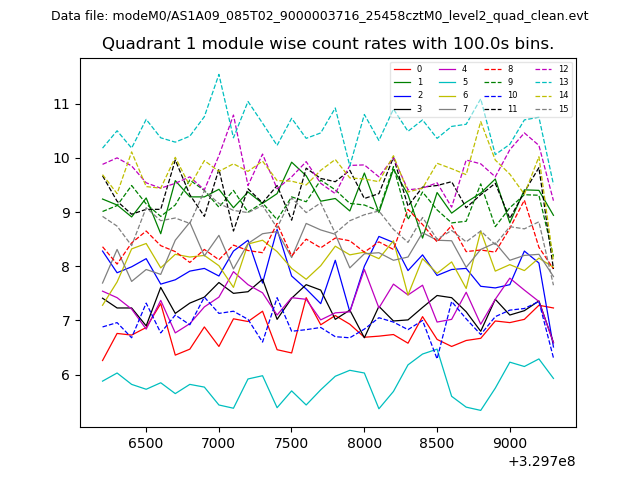
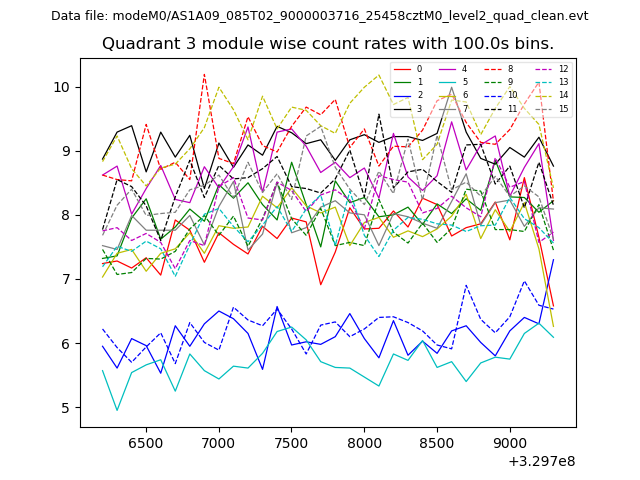
| Module-wise count rates for Quadrant A Data is divided into 100 sec bins |
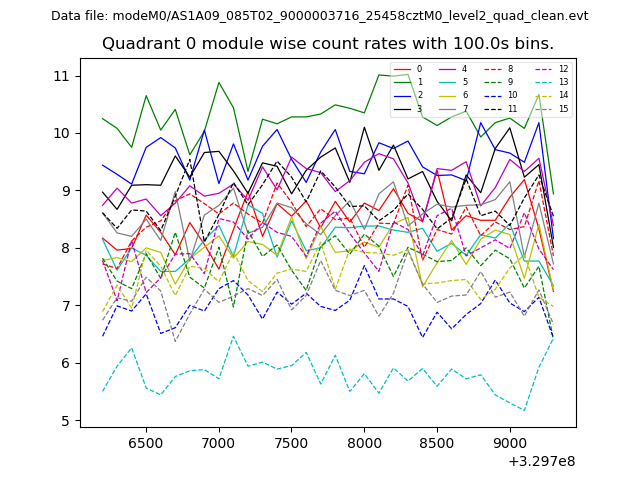 |
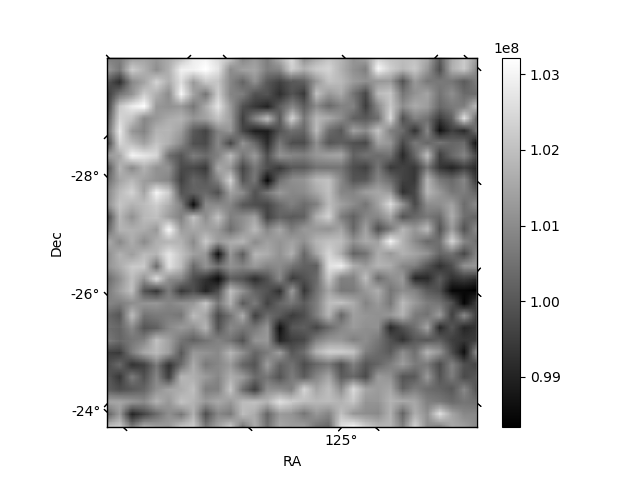 |
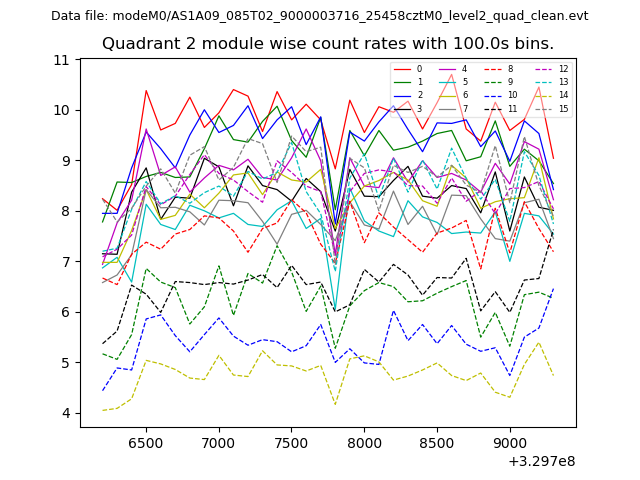
| Module-wise count rates for Quadrant B Data is divided into 100 sec bins |
 |
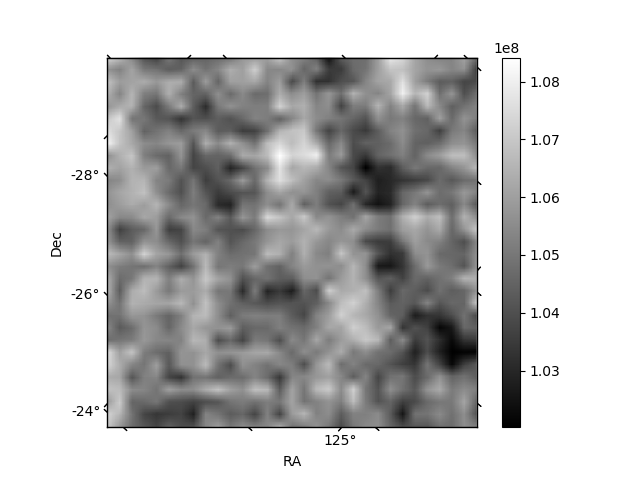 |
| Module-wise count rates for Quadrant C Data is divided into 100 sec bins |
 |
 |
| Module-wise count rates for Quadrant D Data is divided into 100 sec bins |
 |
 |
| Parameter | Plot |
|---|---|
| CZT HV Monitor | 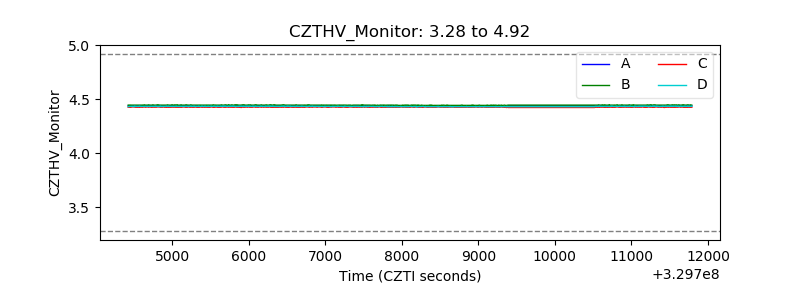 |
| D_VDD | 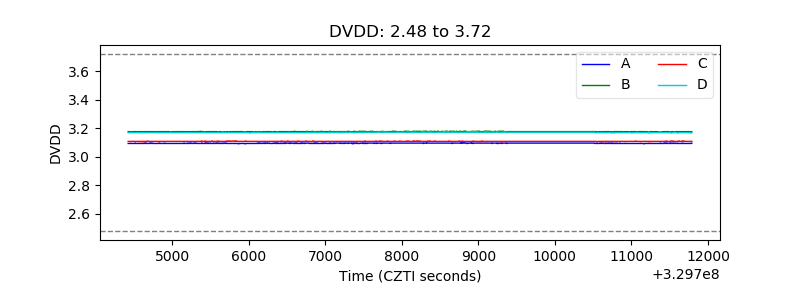 |
| Temperature 1 | 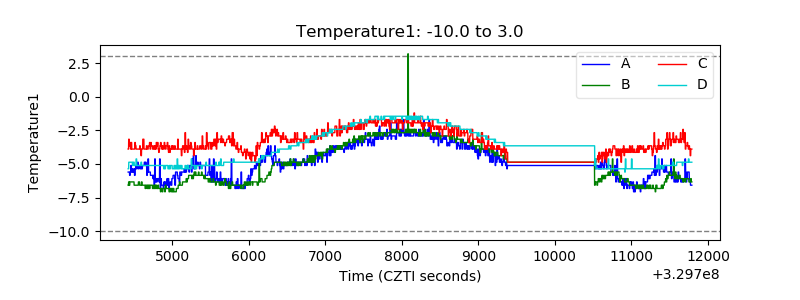 |
| Veto HV Monitor | 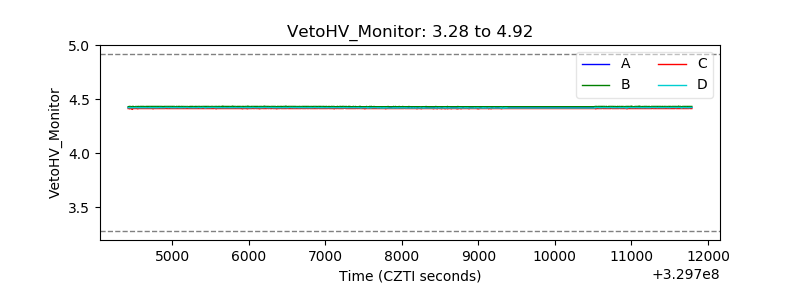 |
| Veto LLD | 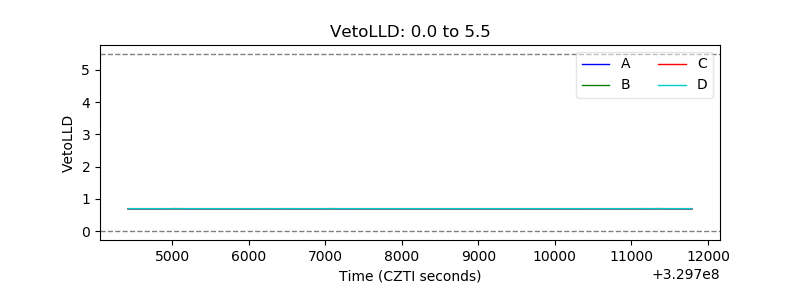 |
| Alpha Counter | 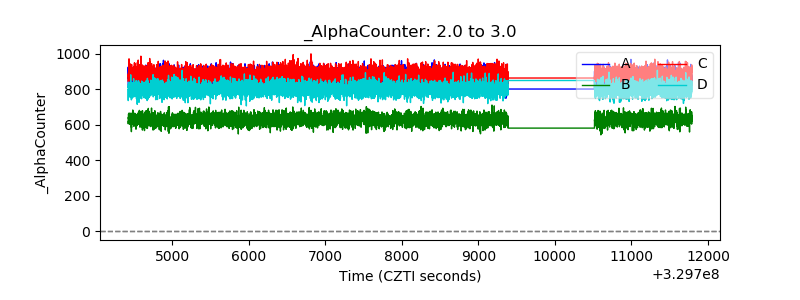 |
| _CPM_Rate | 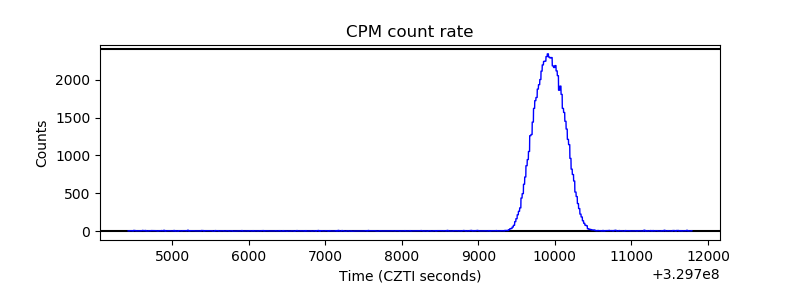 |
| CZT Counter | 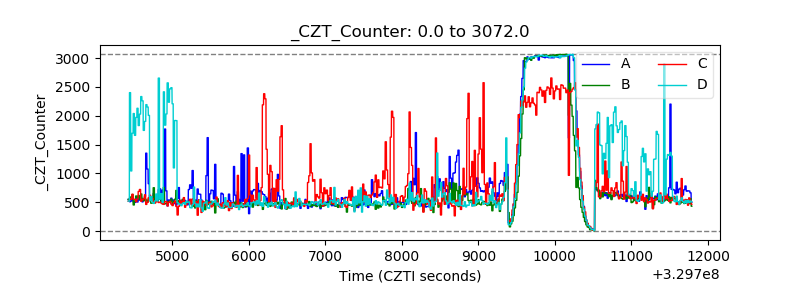 |
| +2.5 Volts monitor | 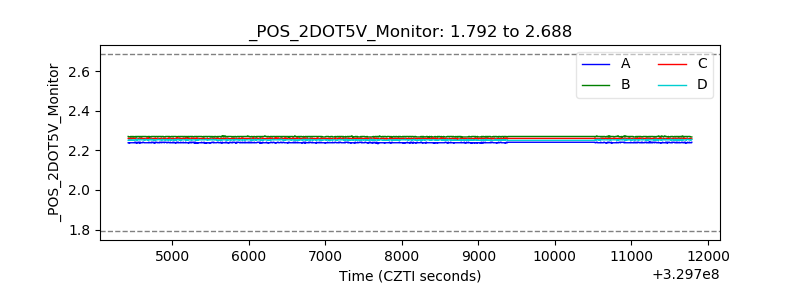 |
| +5 Volts monitor | 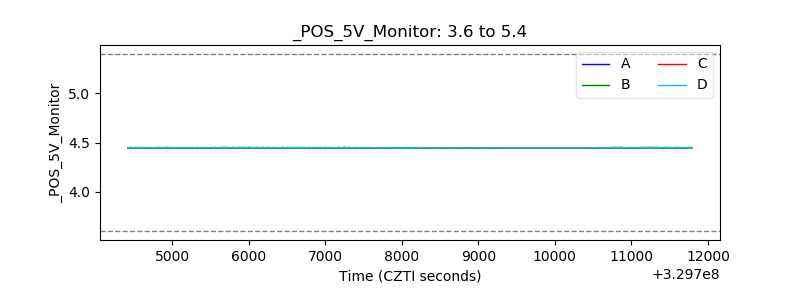 |
| _ROLL_ROT | 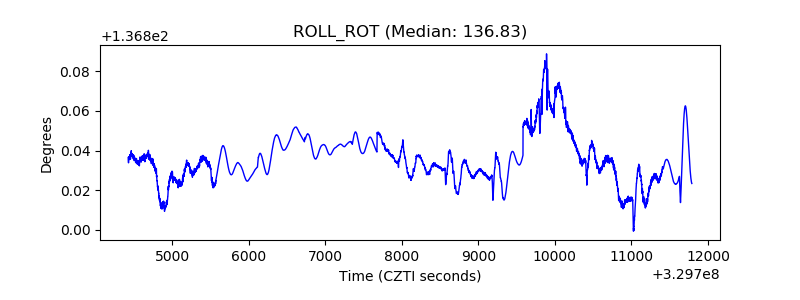 |
| _Roll_DEC | 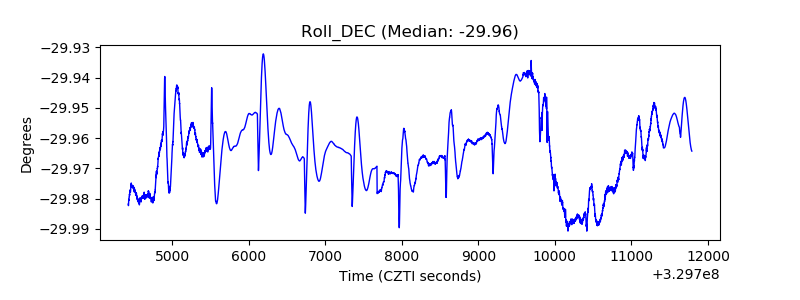 |
| _Roll_RA | 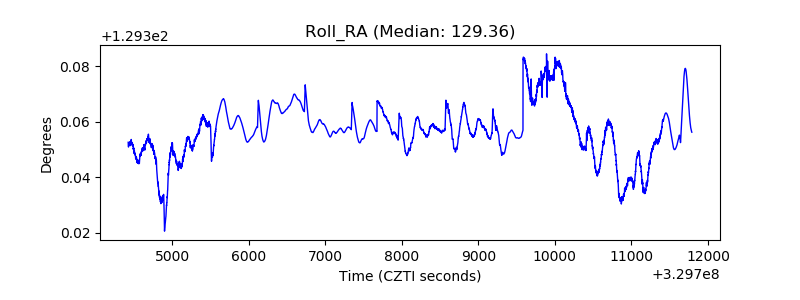 |
| Veto Counter | 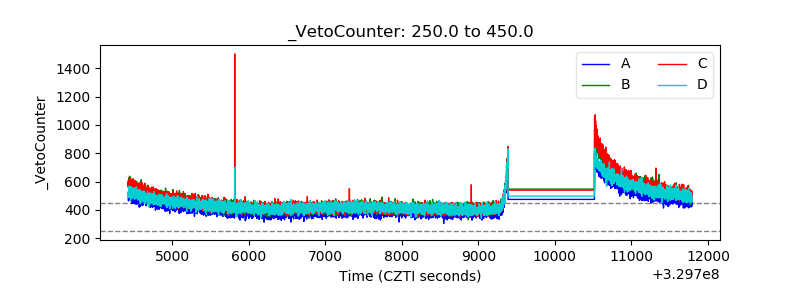 |