| Param | Original file | Final file |
|---|---|---|
| Filename | modeM0/AS1A09_085T02_9000003716_25459cztM0_level2.evt | modeM0/AS1A09_085T02_9000003716_25459cztM0_level2_quad_clean.evt |
| Size (bytes) | 535,415,040 | 80,876,160 |
| Size | 510.6 MB | 77.1 MB |
| Events in quadrant A | 3,802,611 | 511,972 |
| Events in quadrant B | 3,348,354 | 518,973 |
| Events in quadrant C | 3,753,684 | 494,957 |
| Events in quadrant D | 4,885,521 | 485,267 |
| Mode M9 | |||
|---|---|---|---|
| Quadrant | BADHDUFLAG | Total packets | Discarded packets |
| A | 0 | 21 | 0 |
| B | 0 | 22 | 0 |
| C | 0 | 22 | 0 |
| D | 0 | 22 | 0 |
| Mode M0 | |||
|---|---|---|---|
| Quadrant | BADHDUFLAG | Total packets | Discarded packets |
| A | 0 | 15543 | 0 |
| B | 0 | 13839 | 0 |
| C | 0 | 15169 | 0 |
| D | 0 | 18559 | 0 |
| Quadrant | Total seconds | Saturated seconds | Saturation percentage |
|---|---|---|---|
| A | 6279 | 86 | 1.369645% |
| B | 6279 | 47 | 0.748527% |
| C | 6279 | 133 | 2.118172% |
| D | 6279 | 314 | 5.000796% |
Noise dominated data is calculated using 1-second bins in cleaned event files. If a bin has >2000 counts, and if more than 50% of those come from <1% of pixels, then it is considered to be noise-dominated and hence unusable.
| Quadrant | # 1 sec bins | Bins with >0 counts | Bins with >2000 counts | High rate bins dominated by noise | Noise dominated (total time) | Noise dominated (detector-on time) | Marked lightcurve |
|---|---|---|---|---|---|---|---|
| A | 7519 | 6280 | 33 | 33 | 0.44% | 0.53% | 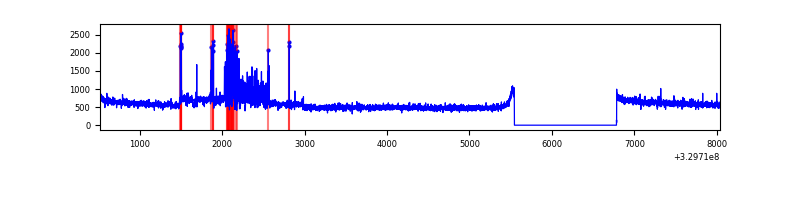 |
| B | 7519 | 6280 | 1 | 1 | 0.01% | 0.02% | 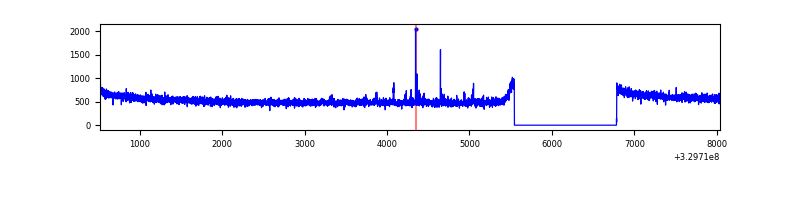 |
| C | 7519 | 6280 | 23 | 23 | 0.31% | 0.37% | 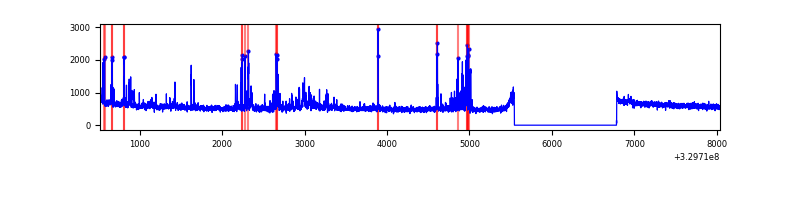 |
| D | 7519 | 6280 | 236 | 236 | 3.14% | 3.76% | 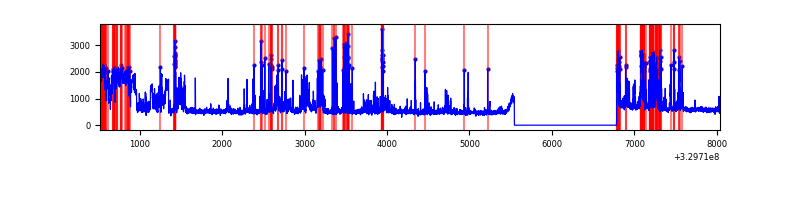 |
Top three noisy pixels from each quadrant. If the there are fewer than three noisy pixels in the level2.evt file, extra rows are filled as -1
| Pixel properties | Quadrant properties | ||||||
|---|---|---|---|---|---|---|---|
| Quadrant | DetID | PixID | Counts | Sigma | Mean | Median | Sigma |
| A | 6 | 16 | 475125 | 2773.21 | 863 | 849 | 171.0 |
| A | 13 | 254 | 10500 | 56.43 | 863 | 849 | 171.0 |
| A | 0 | 226 | 7399 | 38.3 | 863 | 849 | 171.0 |
| B | 0 | 190 | 22272 | 136.51 | 850 | 830 | 157.1 |
| B | 12 | 111 | 19151 | 116.64 | 850 | 830 | 157.1 |
| B | 11 | 111 | 16967 | 102.74 | 850 | 830 | 157.1 |
| C | 9 | 54 | 402515 | 2118.6 | 825 | 831 | 189.6 |
| C | 14 | 238 | 134478 | 704.89 | 825 | 831 | 189.6 |
| C | 13 | 61 | 5672 | 25.53 | 825 | 831 | 189.6 |
| D | 1 | 52 | 1453266 | 7346.04 | 823 | 801 | 197.7 |
| D | 8 | 195 | 148082 | 744.89 | 823 | 801 | 197.7 |
| D | 12 | 233 | 125228 | 629.31 | 823 | 801 | 197.7 |
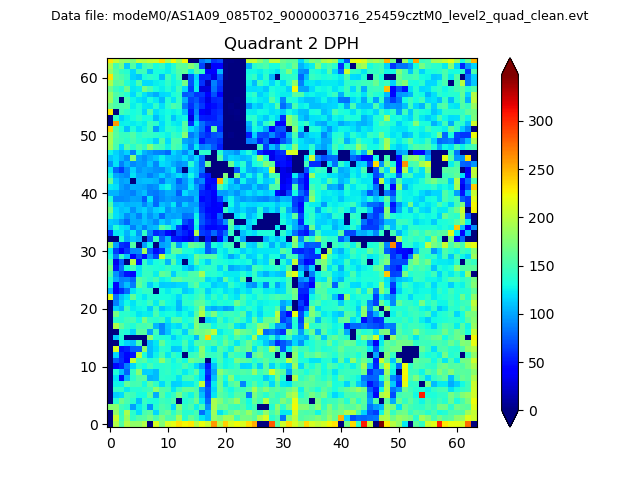
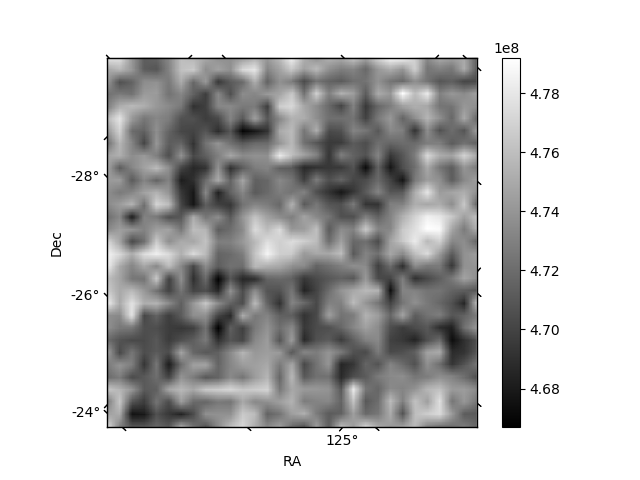
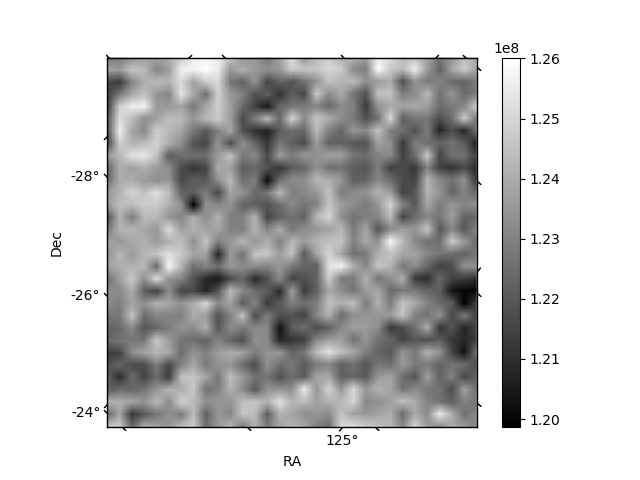
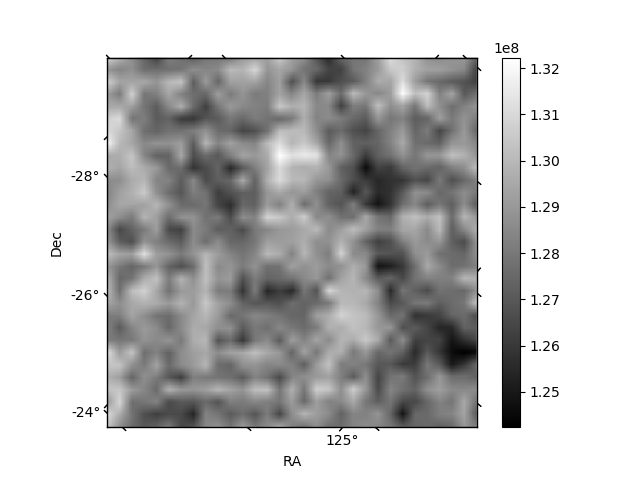
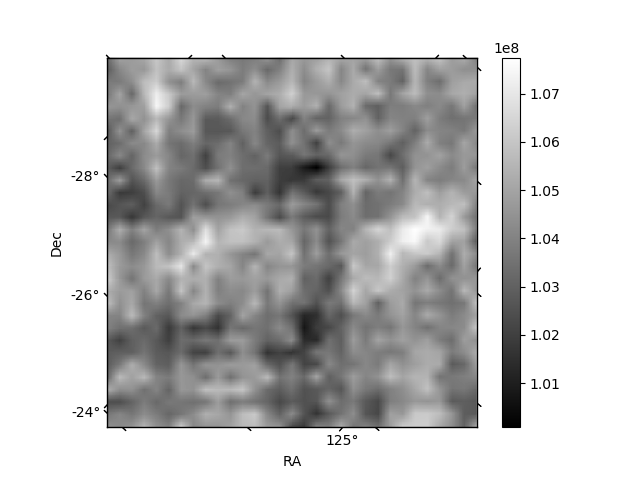
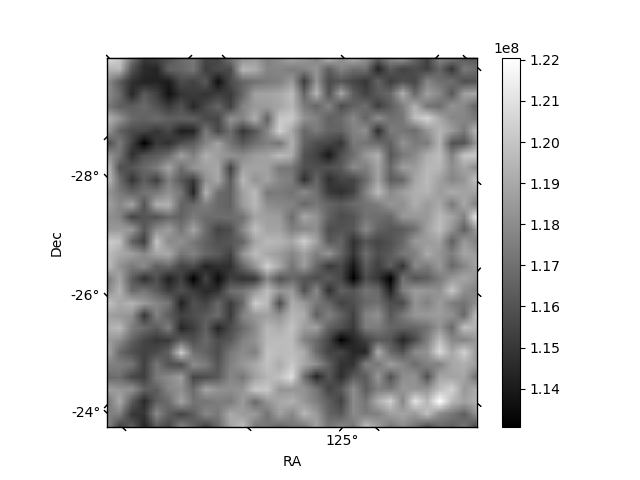
Histogram calculated using DETX and DETY for each event in the final _common_clean file
| Quadrant A | 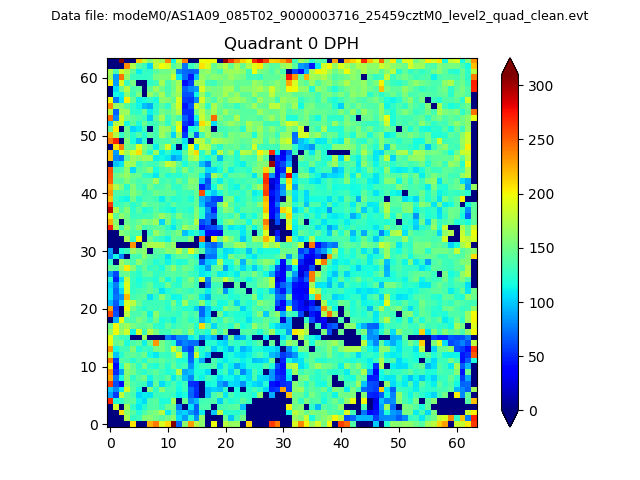 |
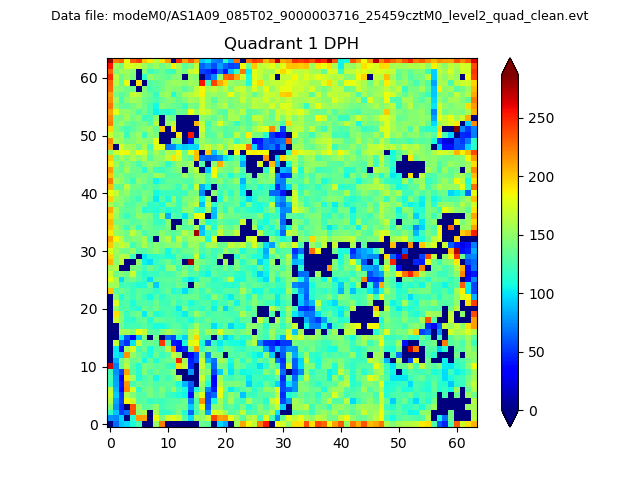 |
Quadrant B |
|---|---|---|---|
| Quadrant D | 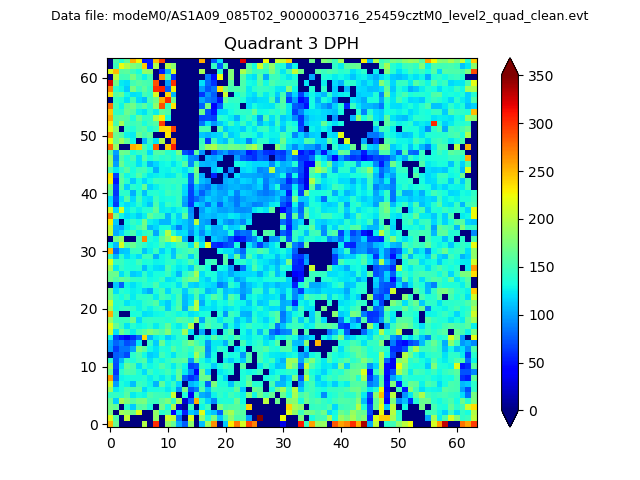 |
 |
Quadrant C |
| Plot type | Count rate plots | Images |
|---|---|---|
| Comparison with Poisson distribution Blue bars denote a histogram of data divided into 1 sec bins. Red curve is a Poisson curve with rate = median count rate of data. |
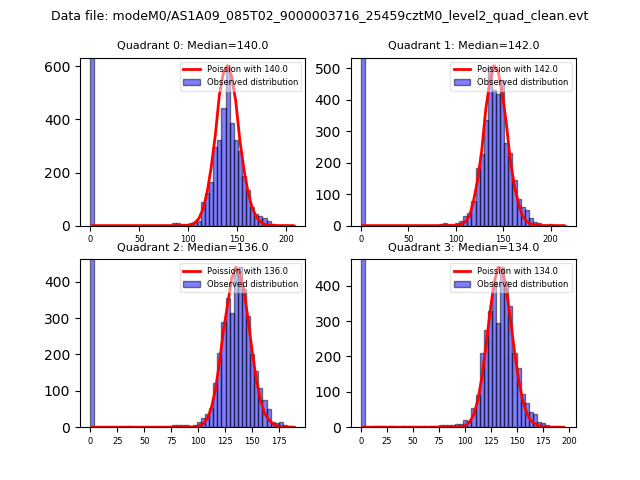 |
 |
| Quadrant-wise count rates Data is divided into 100 sec bins |
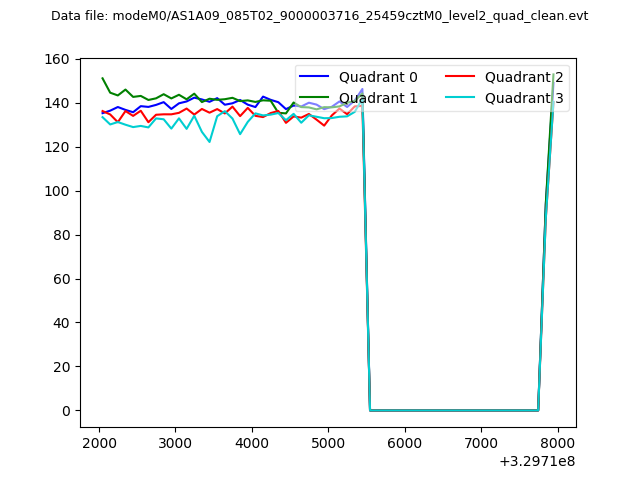 |
|
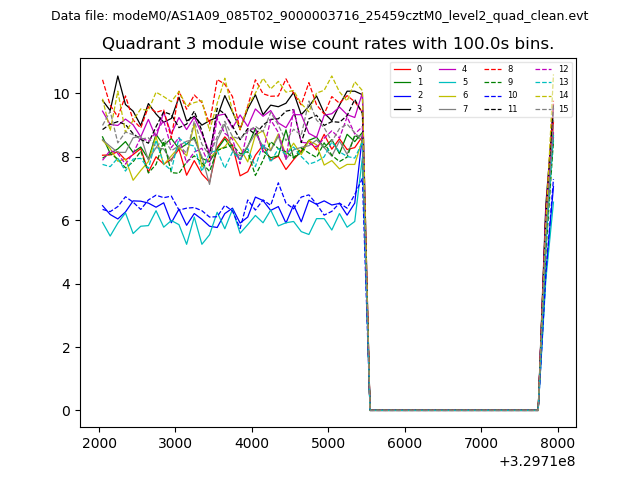
| Module-wise count rates for Quadrant A Data is divided into 100 sec bins |
 |
 |
| Module-wise count rates for Quadrant B Data is divided into 100 sec bins |
 |
 |
| Module-wise count rates for Quadrant C Data is divided into 100 sec bins |
 |
 |
| Module-wise count rates for Quadrant D Data is divided into 100 sec bins |
 |
 |
| Parameter | Plot |
|---|---|
| CZT HV Monitor |  |
| D_VDD | 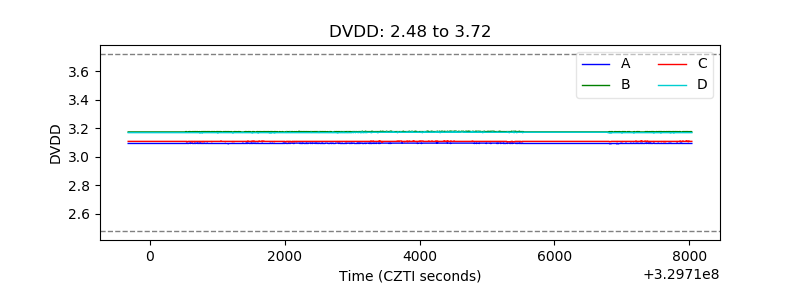 |
| Temperature 1 | 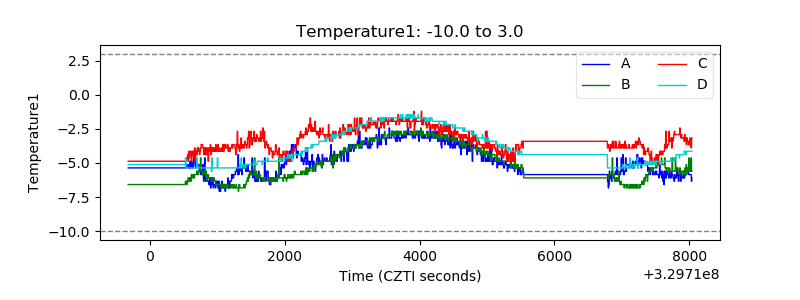 |
| Veto HV Monitor | 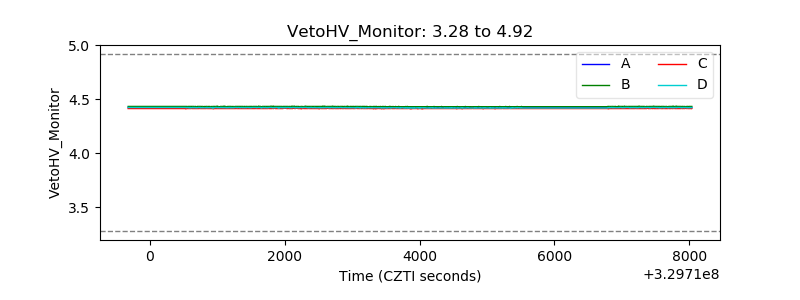 |
| Veto LLD | 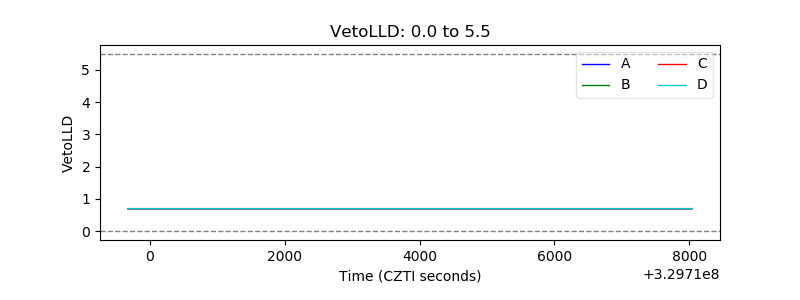 |
| Alpha Counter | 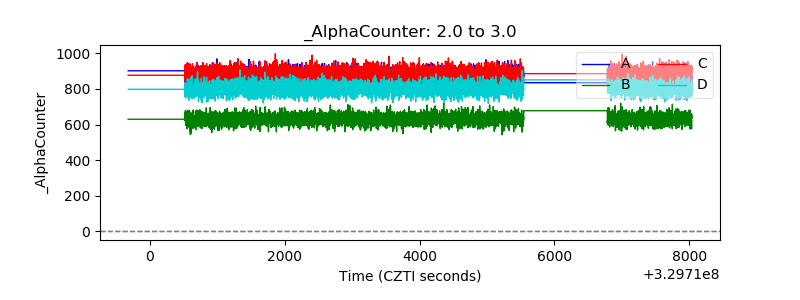 |
| _CPM_Rate | 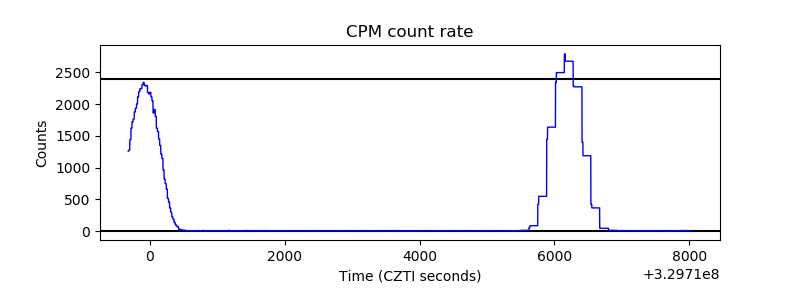 |
| CZT Counter | 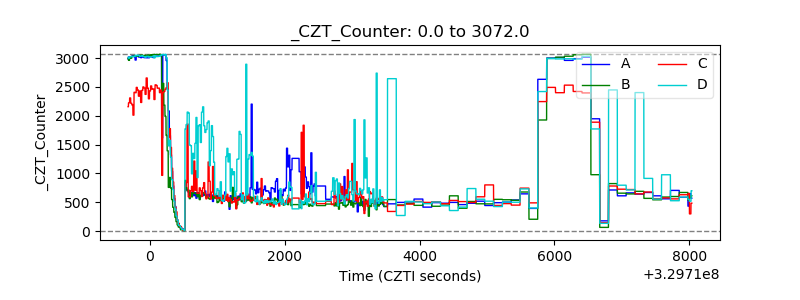 |
| +2.5 Volts monitor |  |
| +5 Volts monitor |  |
| _ROLL_ROT | 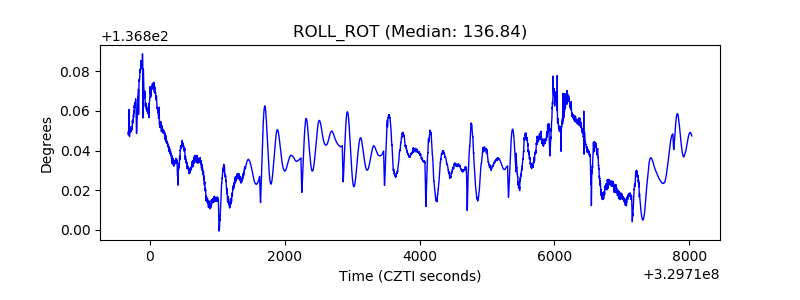 |
| _Roll_DEC | 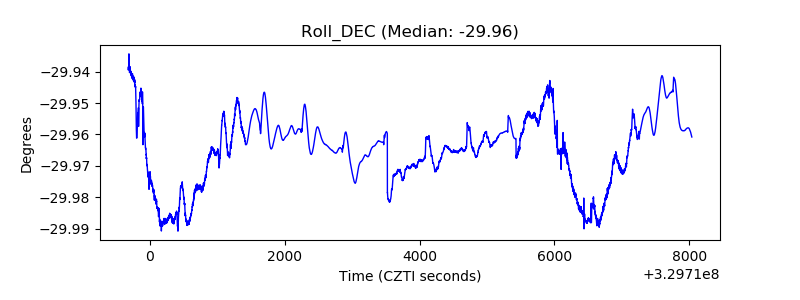 |
| _Roll_RA | 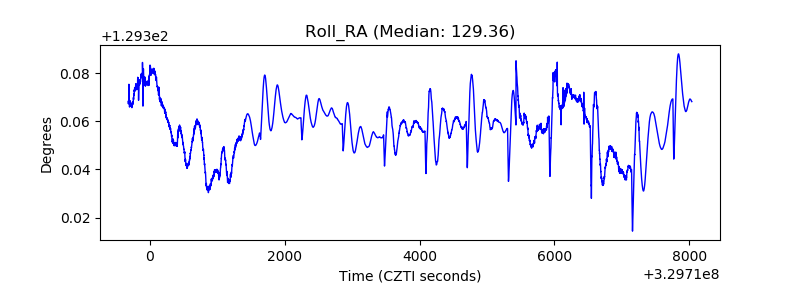 |
| Veto Counter | 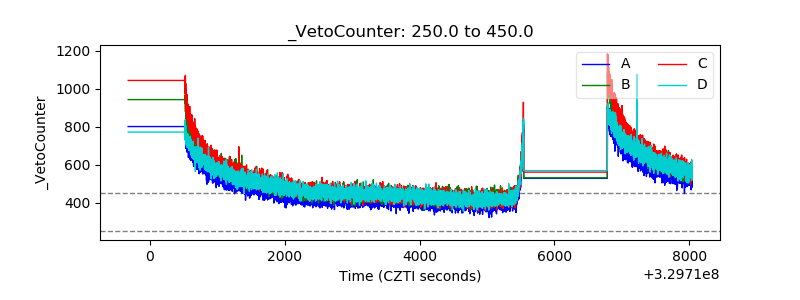 |