| Param | Original file | Final file |
|---|---|---|
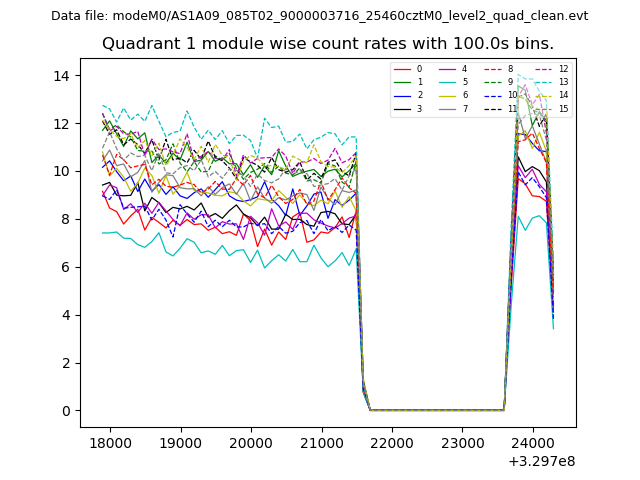
| Filename | modeM0/AS1A09_085T02_9000003716_25460cztM0_level2.evt | modeM0/AS1A09_085T02_9000003716_25460cztM0_level2_quad_clean.evt |
| Size (bytes) | 507,087,360 | 100,045,440 |
| Size | 483.6 MB | 95.4 MB |
| Events in quadrant A | 3,772,223 | 660,601 |
| Events in quadrant B | 3,430,496 | 666,757 |
| Events in quadrant C | 3,485,854 | 642,542 |
| Events in quadrant D | 4,247,456 | 626,425 |
| Mode M9 | |||
|---|---|---|---|
| Quadrant | BADHDUFLAG | Total packets | Discarded packets |
| A | 0 | 20 | 0 |
| B | 0 | 21 | 0 |
| C | 0 | 21 | 0 |
| D | 0 | 21 | 0 |
| Mode M0 | |||
|---|---|---|---|
| Quadrant | BADHDUFLAG | Total packets | Discarded packets |
| A | 0 | 15090 | 0 |
| B | 0 | 14128 | 0 |
| C | 0 | 14430 | 0 |
| D | 0 | 16698 | 0 |
| Quadrant | Total seconds | Saturated seconds | Saturation percentage |
|---|---|---|---|
| A | 6215 | 55 | 0.884956% |
| B | 6215 | 53 | 0.852776% |
| C | 6214 | 116 | 1.866752% |
| D | 6214 | 199 | 3.202446% |
Noise dominated data is calculated using 1-second bins in cleaned event files. If a bin has >2000 counts, and if more than 50% of those come from <1% of pixels, then it is considered to be noise-dominated and hence unusable.
| Quadrant | # 1 sec bins | Bins with >0 counts | Bins with >2000 counts | High rate bins dominated by noise | Noise dominated (total time) | Noise dominated (detector-on time) | Marked lightcurve |
|---|---|---|---|---|---|---|---|
| A | 7555 | 6216 | 5 | 5 | 0.07% | 0.08% | 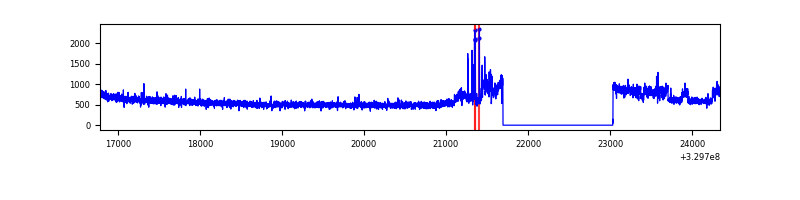 |
| B | 7555 | 6216 | 0 | 0 | 0.00% | 0.00% | 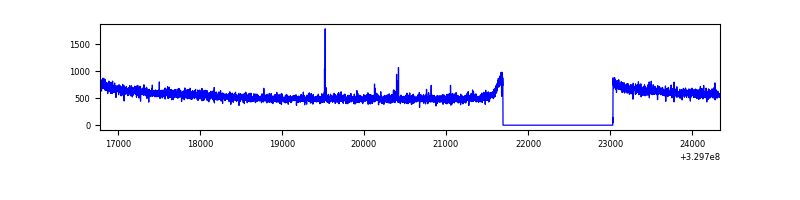 |
| C | 7554 | 6215 | 0 | 0 | 0.00% | 0.00% | 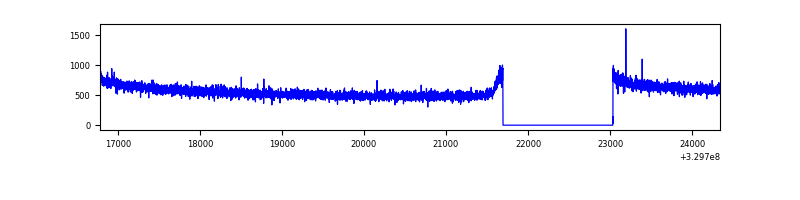 |
| D | 7554 | 6215 | 161 | 161 | 2.13% | 2.59% | 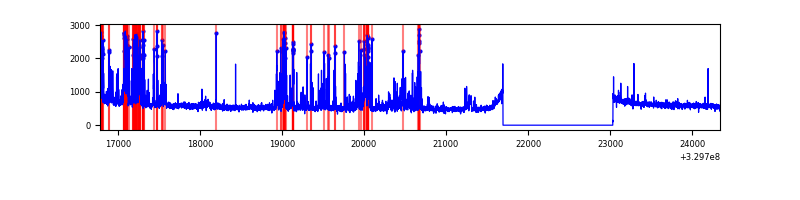 |
Top three noisy pixels from each quadrant. If the there are fewer than three noisy pixels in the level2.evt file, extra rows are filled as -1
| Pixel properties | Quadrant properties | ||||||
|---|---|---|---|---|---|---|---|
| Quadrant | DetID | PixID | Counts | Sigma | Mean | Median | Sigma |
| A | 6 | 16 | 330965 | 1882.9 | 892 | 880 | 175.3 |
| A | 13 | 254 | 10251 | 53.45 | 892 | 880 | 175.3 |
| A | 0 | 226 | 7632 | 38.52 | 892 | 880 | 175.3 |
| B | 12 | 111 | 18832 | 111.82 | 874 | 857 | 160.7 |
| B | 11 | 111 | 17344 | 102.57 | 874 | 857 | 160.7 |
| B | 14 | 111 | 15964 | 93.98 | 874 | 857 | 160.7 |
| C | 14 | 238 | 140781 | 717.05 | 856 | 867 | 195.1 |
| C | 13 | 61 | 5832 | 25.45 | 856 | 867 | 195.1 |
| C | 9 | 54 | 4395 | 18.08 | 856 | 867 | 195.1 |
| D | 1 | 52 | 620217 | 3018.92 | 862 | 839 | 205.2 |
| D | 7 | 238 | 151261 | 733.17 | 862 | 839 | 205.2 |
| D | 8 | 195 | 120121 | 581.39 | 862 | 839 | 205.2 |
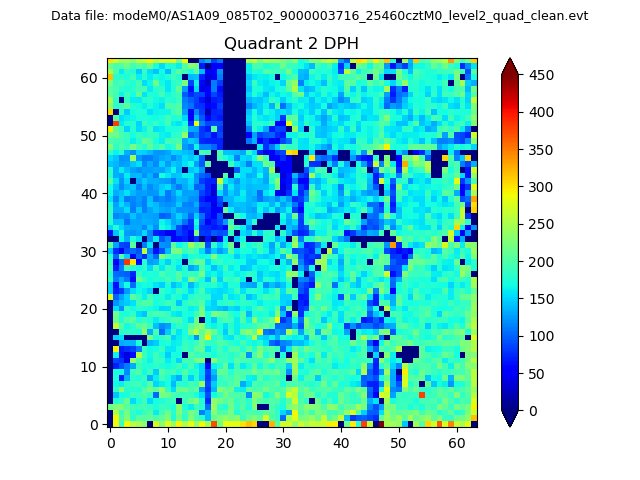
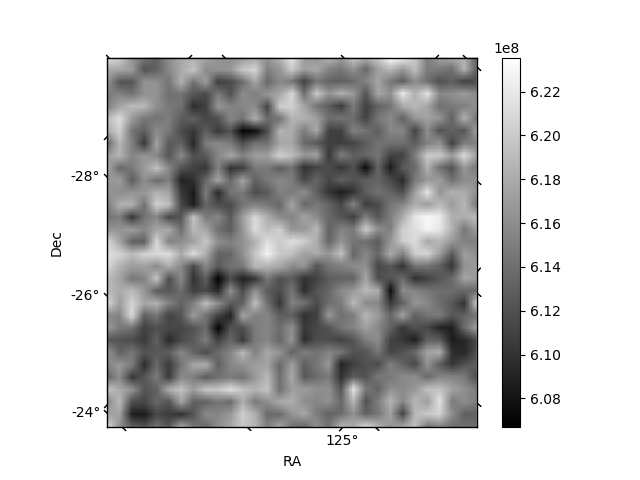
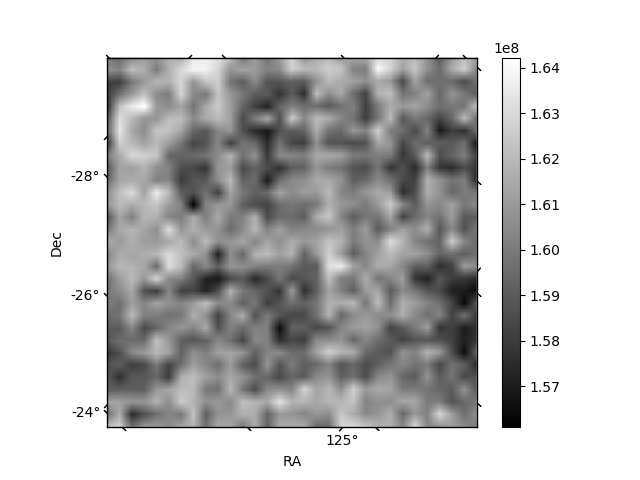
Histogram calculated using DETX and DETY for each event in the final _common_clean file
| Quadrant A | 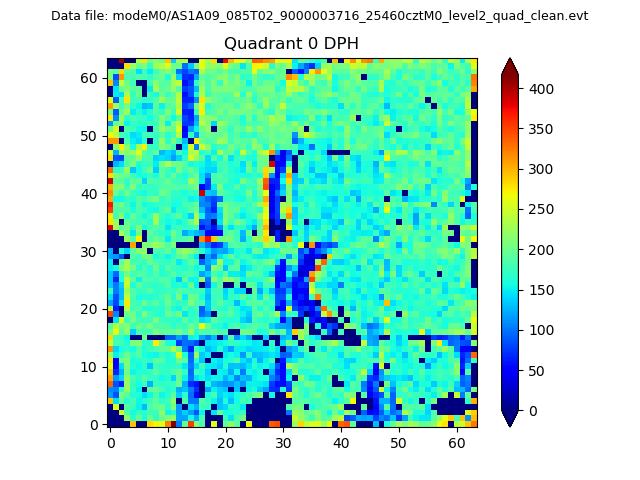 |
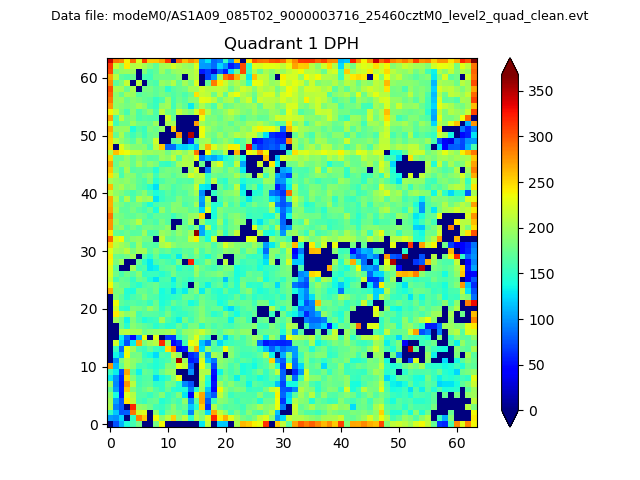 |
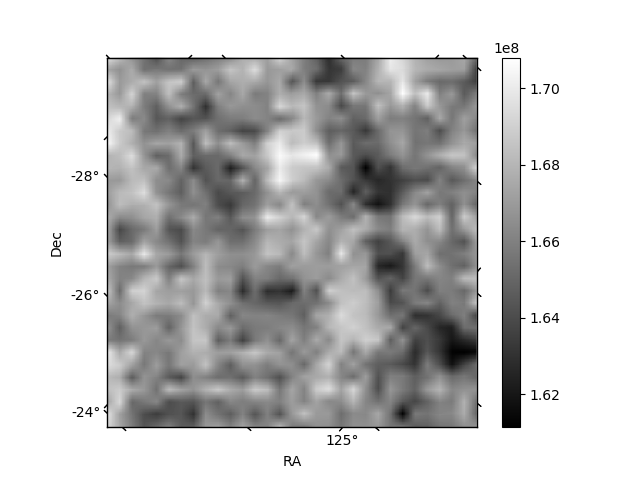
Quadrant B |
|---|---|---|---|
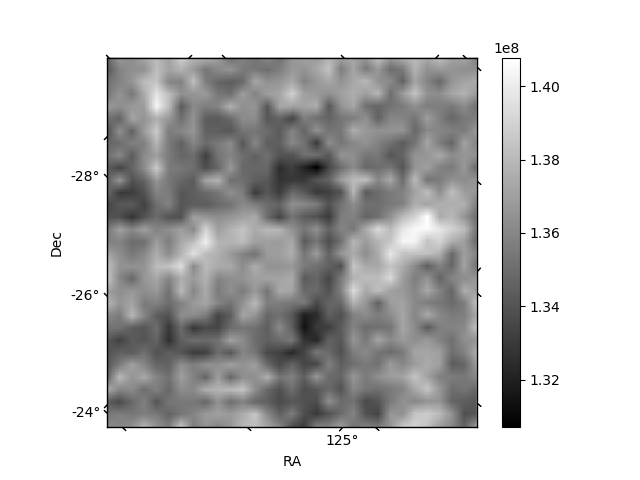
| Quadrant D | 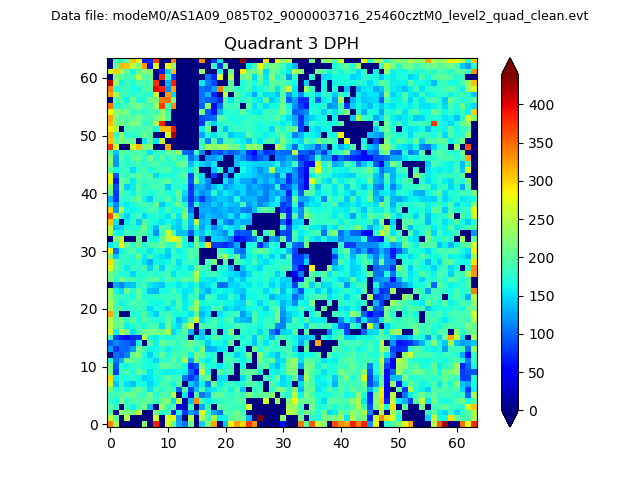 |
 |
Quadrant C |
| Plot type | Count rate plots | Images |
|---|---|---|
| Comparison with Poisson distribution Blue bars denote a histogram of data divided into 1 sec bins. Red curve is a Poisson curve with rate = median count rate of data. |
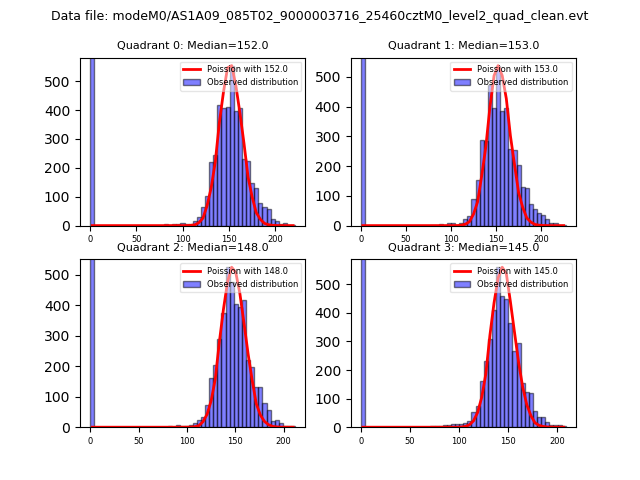 |
 |
| Quadrant-wise count rates Data is divided into 100 sec bins |
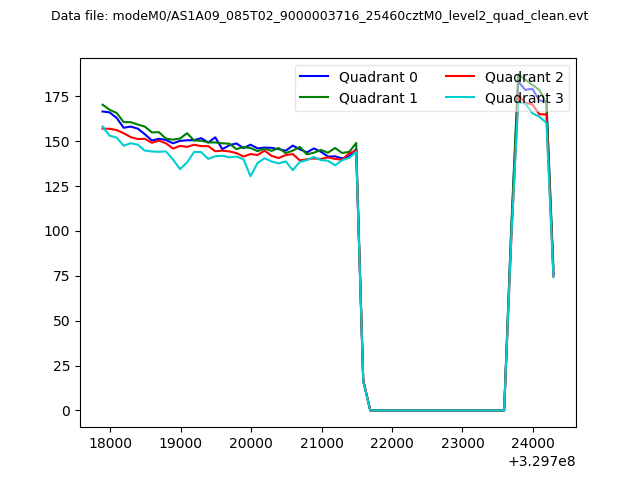 |
|
| Module-wise count rates for Quadrant A Data is divided into 100 sec bins |
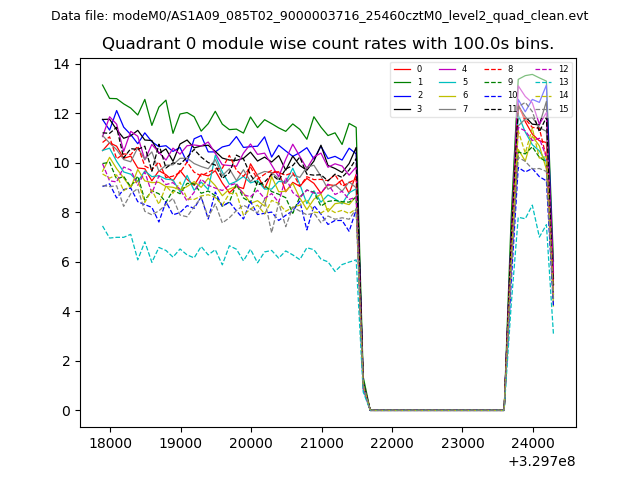 |
 |
| Module-wise count rates for Quadrant B Data is divided into 100 sec bins |
 |
 |
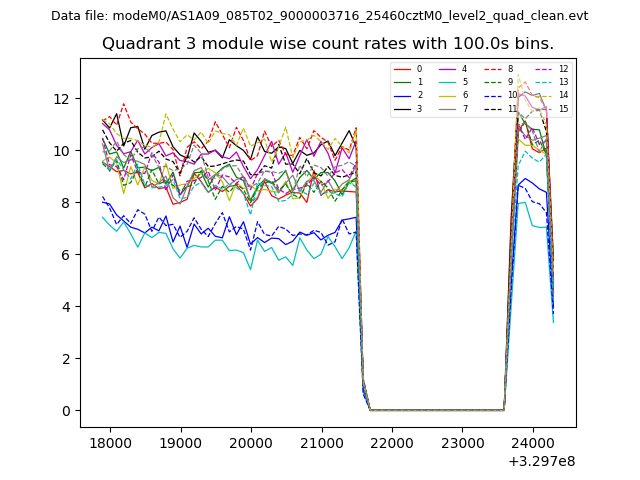
| Module-wise count rates for Quadrant C Data is divided into 100 sec bins |
 |
 |
| Module-wise count rates for Quadrant D Data is divided into 100 sec bins |
 |
 |
| Parameter | Plot |
|---|---|
| CZT HV Monitor |  |
| D_VDD | 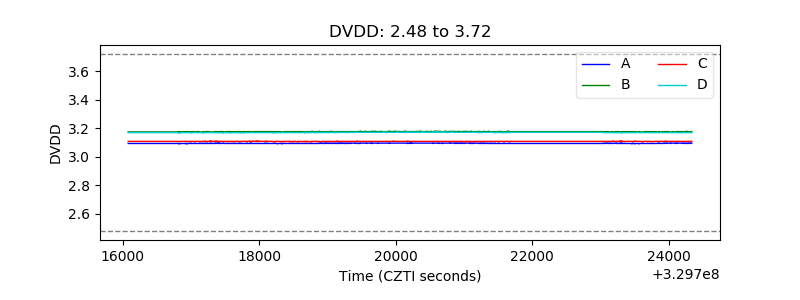 |
| Temperature 1 | 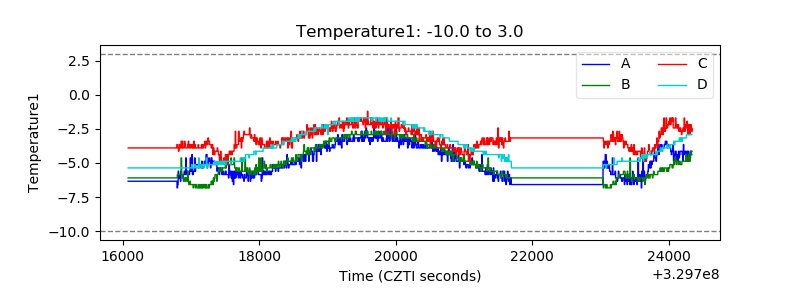 |
| Veto HV Monitor | 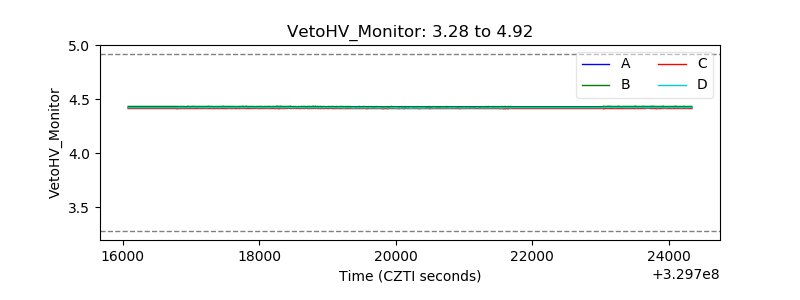 |
| Veto LLD | 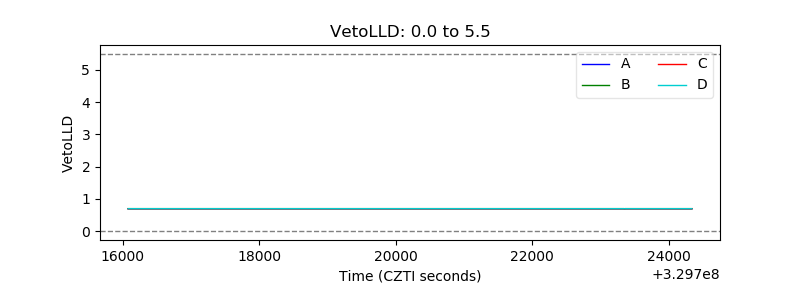 |
| Alpha Counter | 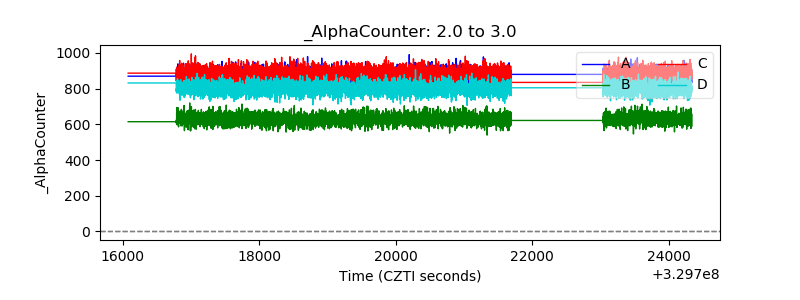 |
| _CPM_Rate | 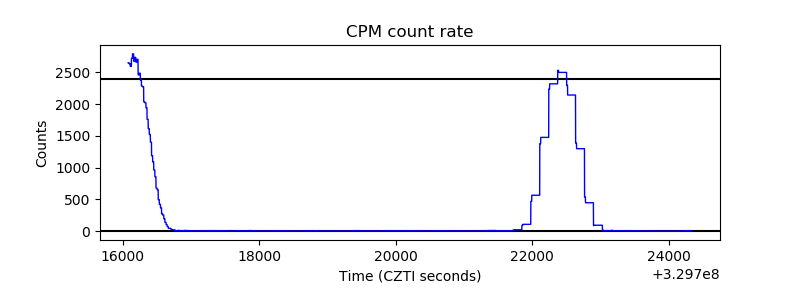 |
| CZT Counter | 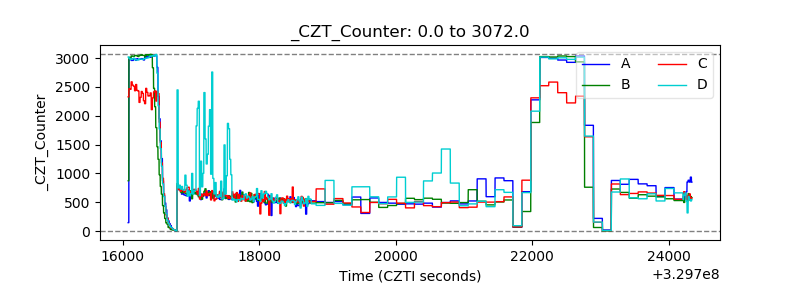 |
| +2.5 Volts monitor |  |
| +5 Volts monitor |  |
| _ROLL_ROT | 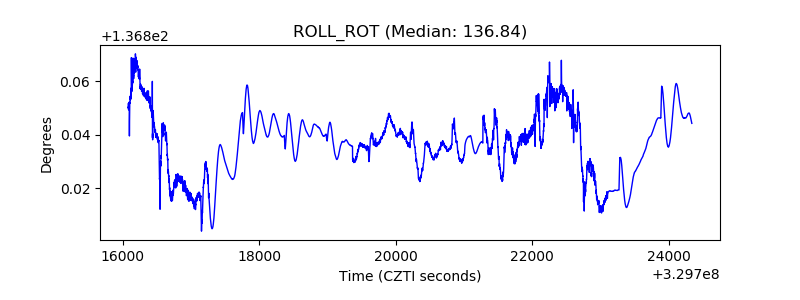 |
| _Roll_DEC | 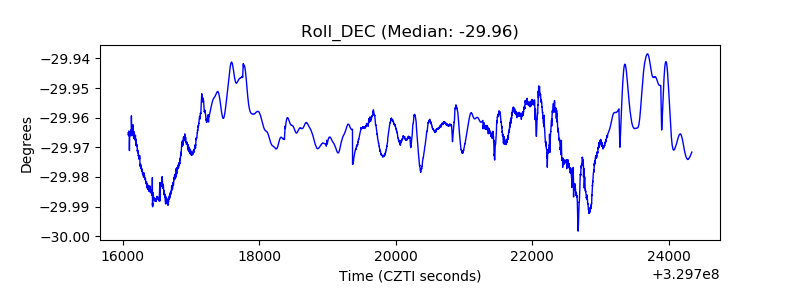 |
| _Roll_RA | 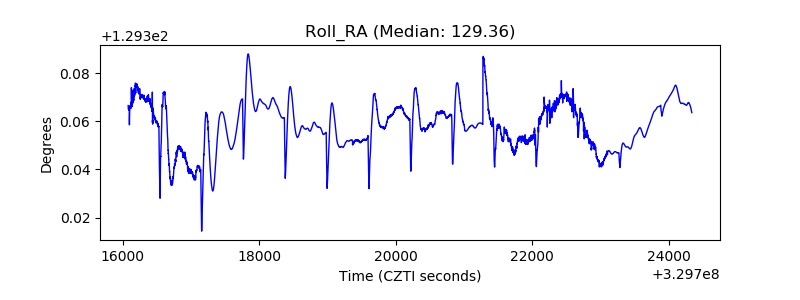 |
| Veto Counter | 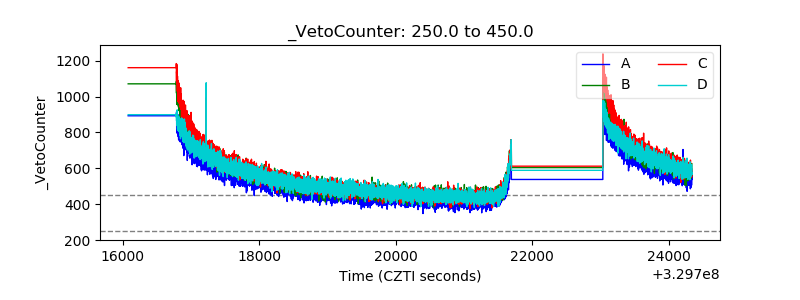 |