| Param | Original file | Final file |
|---|---|---|
| Filename | modeM0/AS1A09_085T02_9000003716_25461cztM0_level2.evt | modeM0/AS1A09_085T02_9000003716_25461cztM0_level2_quad_clean.evt |
| Size (bytes) | 530,544,960 | 112,648,320 |
| Size | 506.0 MB | 107.4 MB |
| Events in quadrant A | 4,303,199 | 756,085 |
| Events in quadrant B | 3,540,361 | 765,051 |
| Events in quadrant C | 3,548,155 | 736,905 |
| Events in quadrant D | 4,253,639 | 718,627 |
| Mode M9 | |||
|---|---|---|---|
| Quadrant | BADHDUFLAG | Total packets | Discarded packets |
| A | 0 | 15 | 0 |
| B | 0 | 16 | 0 |
| C | 0 | 16 | 0 |
| D | 0 | 16 | 0 |
| Mode M0 | |||
|---|---|---|---|
| Quadrant | BADHDUFLAG | Total packets | Discarded packets |
| A | 0 | 17170 | 0 |
| B | 0 | 14529 | 0 |
| C | 0 | 14684 | 0 |
| D | 0 | 16771 | 0 |
| Quadrant | Total seconds | Saturated seconds | Saturation percentage |
|---|---|---|---|
| A | 6229 | 109 | 1.749880% |
| B | 6229 | 115 | 1.846203% |
| C | 6229 | 172 | 2.761278% |
| D | 6229 | 241 | 3.869000% |
Noise dominated data is calculated using 1-second bins in cleaned event files. If a bin has >2000 counts, and if more than 50% of those come from <1% of pixels, then it is considered to be noise-dominated and hence unusable.
| Quadrant | # 1 sec bins | Bins with >0 counts | Bins with >2000 counts | High rate bins dominated by noise | Noise dominated (total time) | Noise dominated (detector-on time) | Marked lightcurve |
|---|---|---|---|---|---|---|---|
| A | 7570 | 6231 | 26 | 26 | 0.34% | 0.42% | 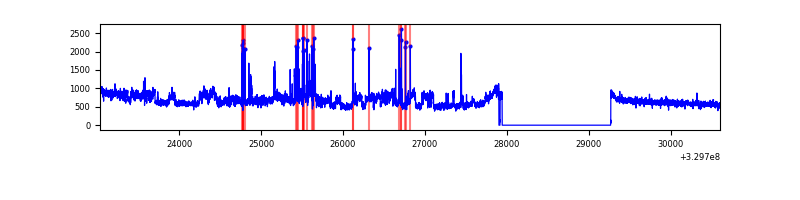 |
| B | 7570 | 6231 | 15 | 15 | 0.20% | 0.24% | 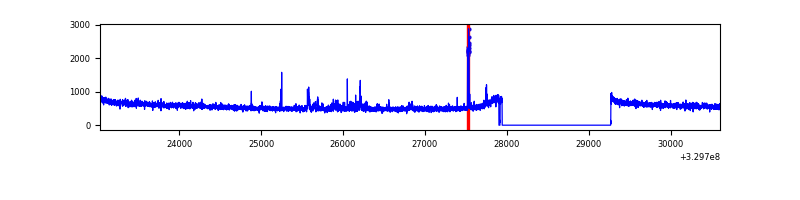 |
| C | 7570 | 6231 | 5 | 5 | 0.07% | 0.08% | 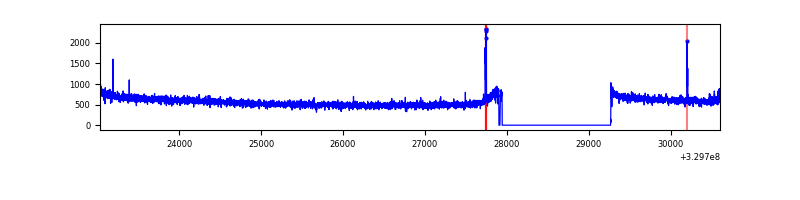 |
| D | 7570 | 6231 | 171 | 171 | 2.26% | 2.74% | 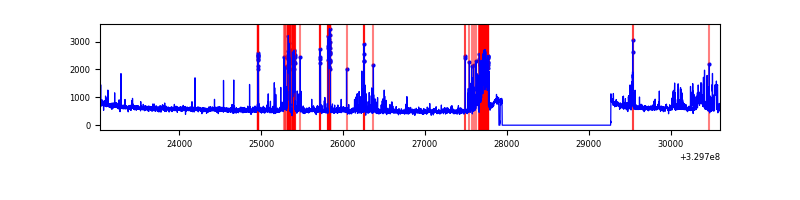 |
Top three noisy pixels from each quadrant. If the there are fewer than three noisy pixels in the level2.evt file, extra rows are filled as -1
| Pixel properties | Quadrant properties | ||||||
|---|---|---|---|---|---|---|---|
| Quadrant | DetID | PixID | Counts | Sigma | Mean | Median | Sigma |
| A | 6 | 16 | 811589 | 4532.34 | 905 | 892 | 178.9 |
| A | 13 | 254 | 10219 | 52.14 | 905 | 892 | 178.9 |
| A | 0 | 226 | 7972 | 39.58 | 905 | 892 | 178.9 |
| B | 0 | 245 | 48396 | 292.85 | 881 | 865 | 162.3 |
| B | 15 | 32 | 31330 | 187.7 | 881 | 865 | 162.3 |
| B | 0 | 190 | 23655 | 140.41 | 881 | 865 | 162.3 |
| C | 14 | 238 | 140190 | 709.79 | 864 | 872 | 196.3 |
| C | 9 | 54 | 37764 | 187.95 | 864 | 872 | 196.3 |
| C | 13 | 61 | 5971 | 25.98 | 864 | 872 | 196.3 |
| D | 1 | 52 | 758328 | 3643.95 | 878 | 857 | 207.9 |
| D | 12 | 233 | 83260 | 396.41 | 878 | 857 | 207.9 |
| D | 8 | 195 | 80801 | 384.59 | 878 | 857 | 207.9 |
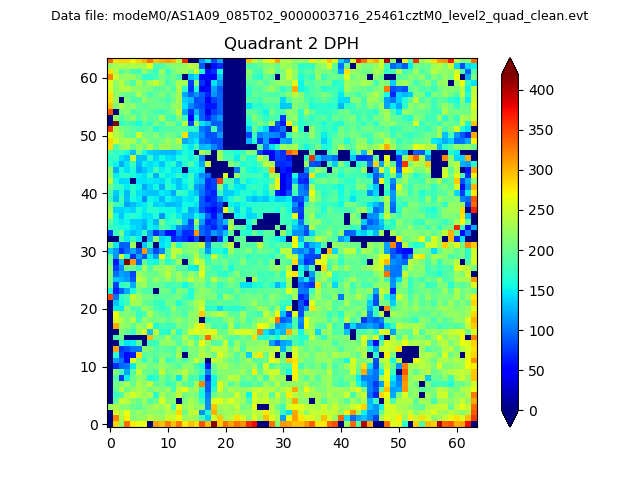
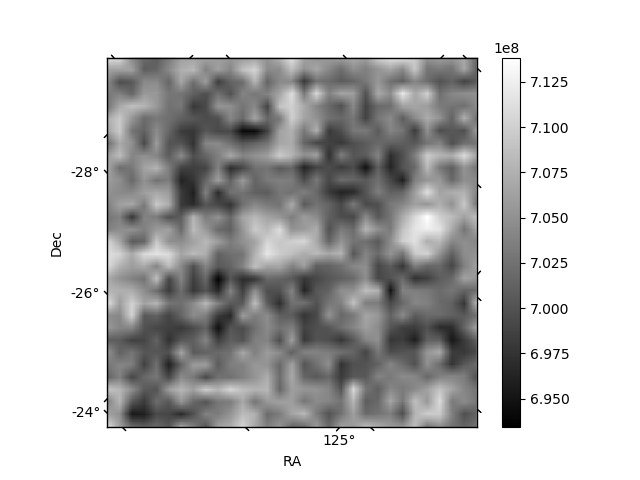
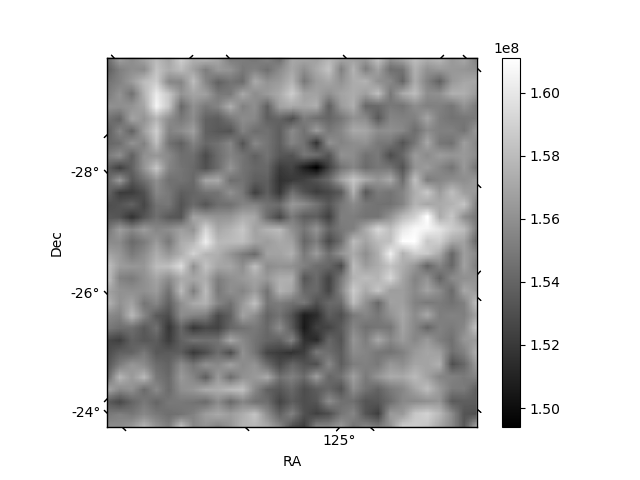
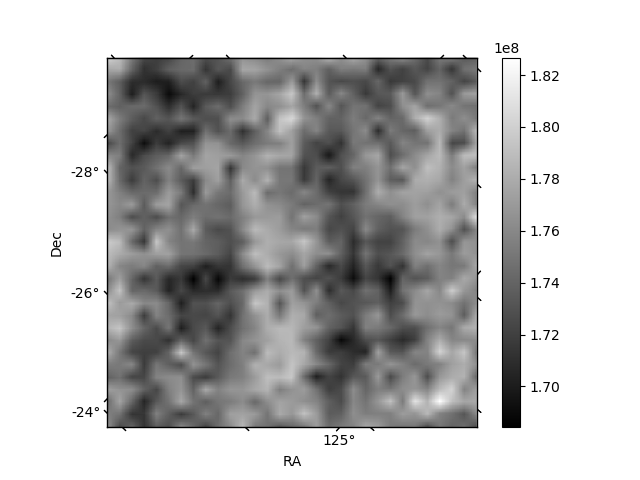
Histogram calculated using DETX and DETY for each event in the final _common_clean file
| Quadrant A | 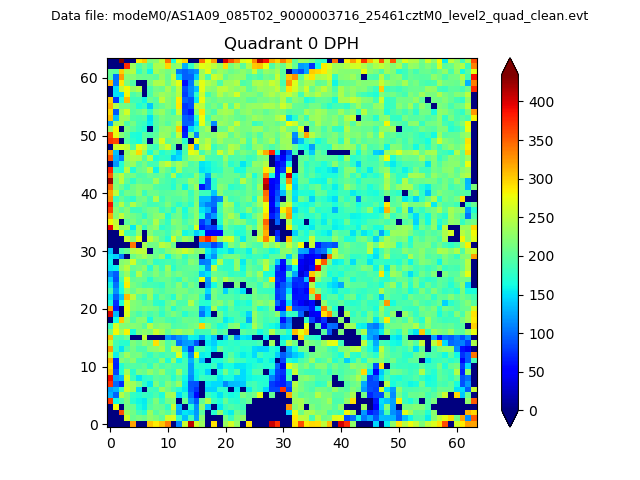 |
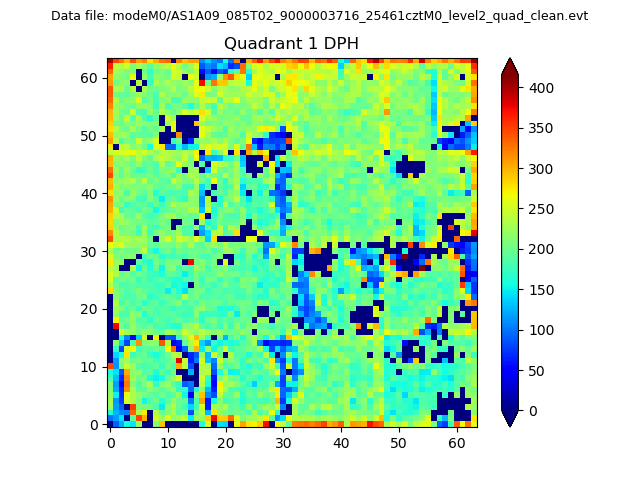 |
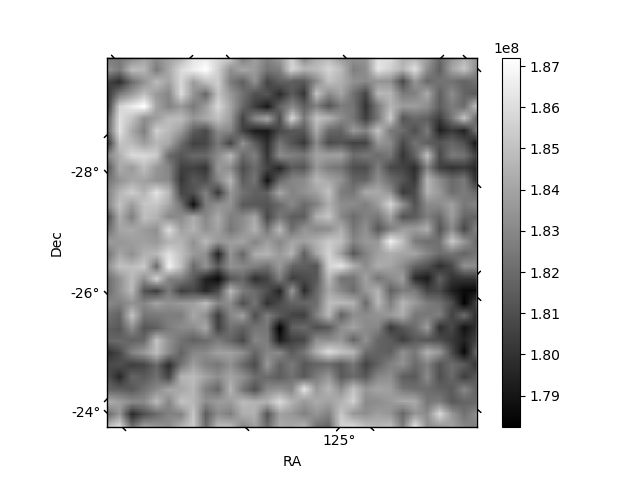
Quadrant B |
|---|---|---|---|
| Quadrant D | 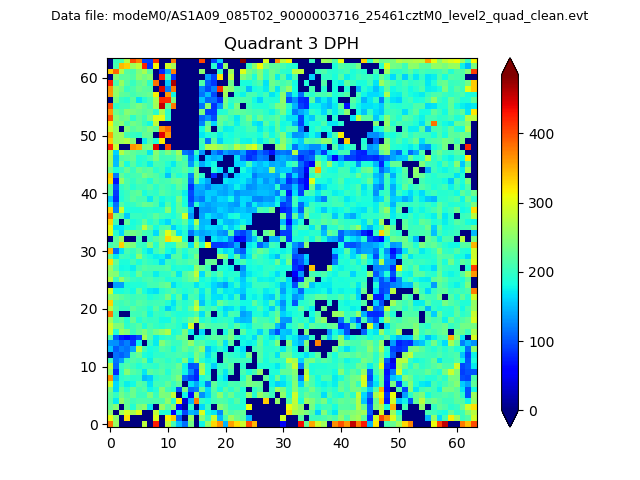 |
 |
Quadrant C |
| Plot type | Count rate plots | Images |
|---|---|---|
| Comparison with Poisson distribution Blue bars denote a histogram of data divided into 1 sec bins. Red curve is a Poisson curve with rate = median count rate of data. |
 |
 |
| Quadrant-wise count rates Data is divided into 100 sec bins |
 |
|
| Module-wise count rates for Quadrant A Data is divided into 100 sec bins |
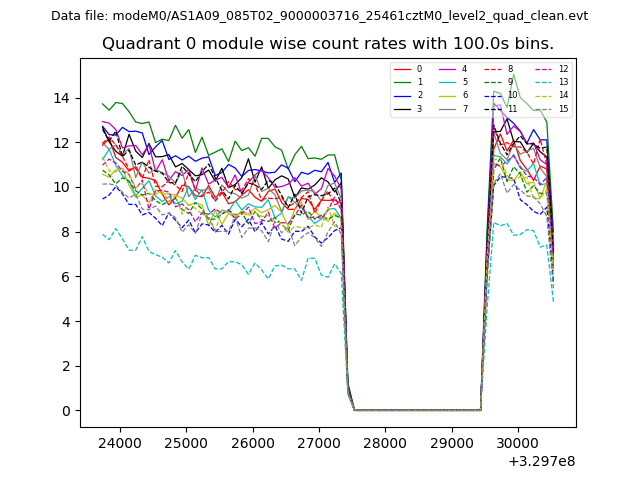 |
 |
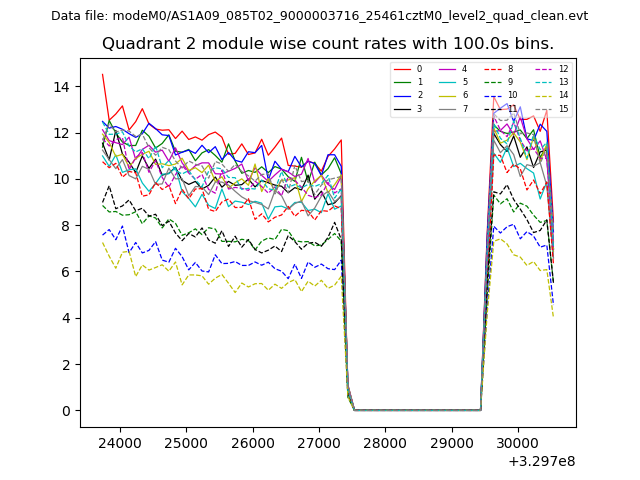
| Module-wise count rates for Quadrant B Data is divided into 100 sec bins |
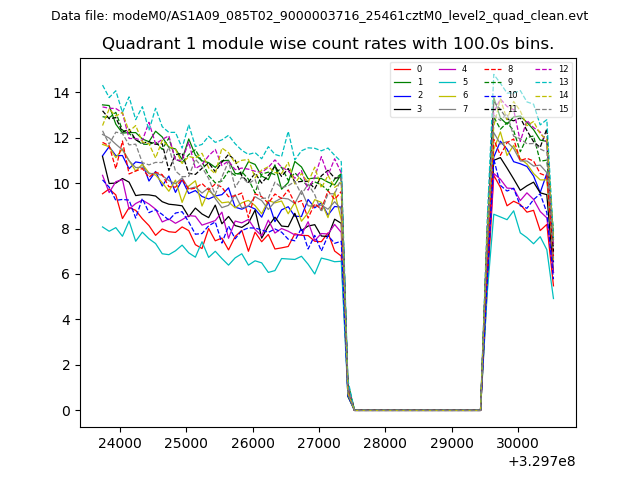 |
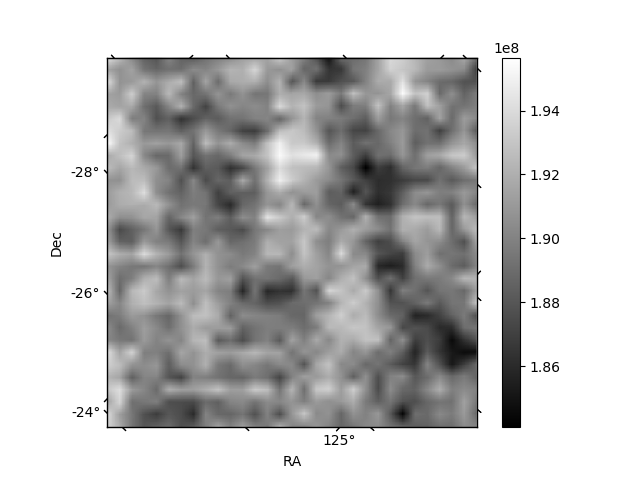 |
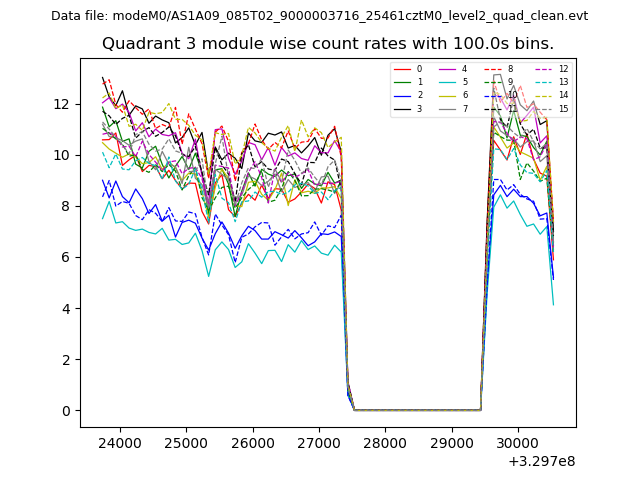
| Module-wise count rates for Quadrant C Data is divided into 100 sec bins |
 |
 |
| Module-wise count rates for Quadrant D Data is divided into 100 sec bins |
 |
 |
| Parameter | Plot |
|---|---|
| CZT HV Monitor | 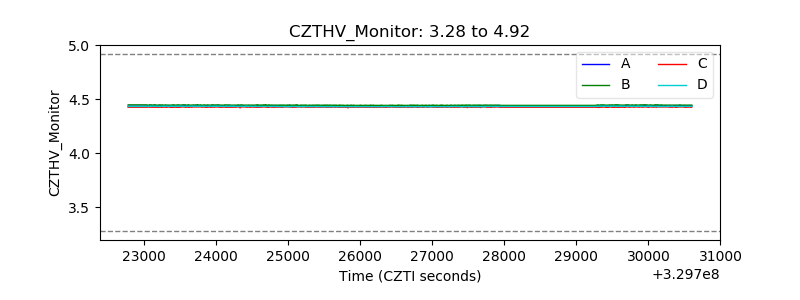 |
| D_VDD | 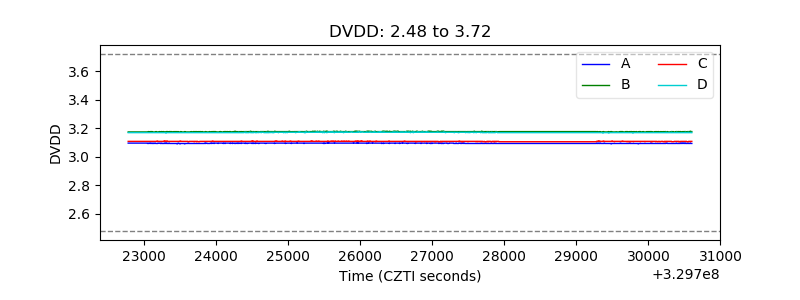 |
| Temperature 1 | 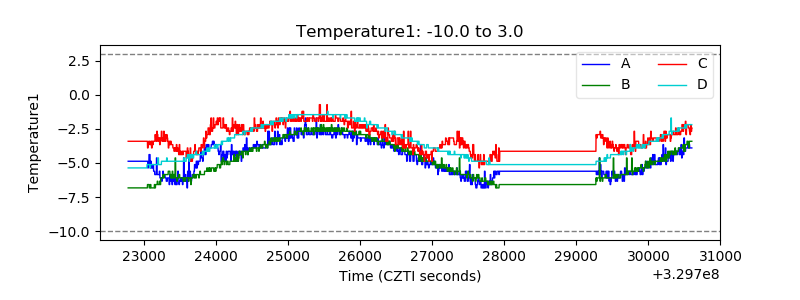 |
| Veto HV Monitor | 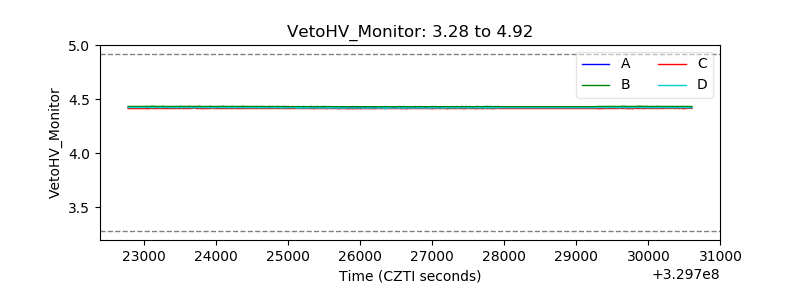 |
| Veto LLD | 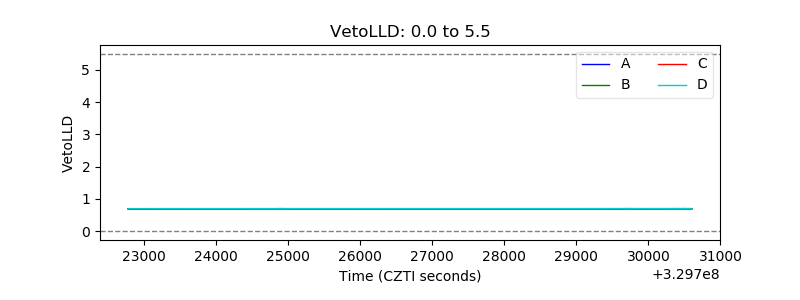 |
| Alpha Counter | 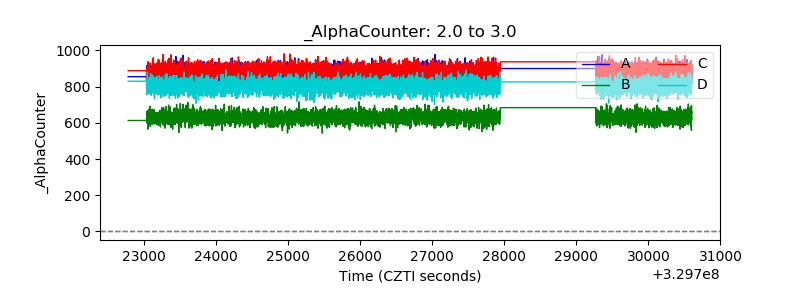 |
| _CPM_Rate | 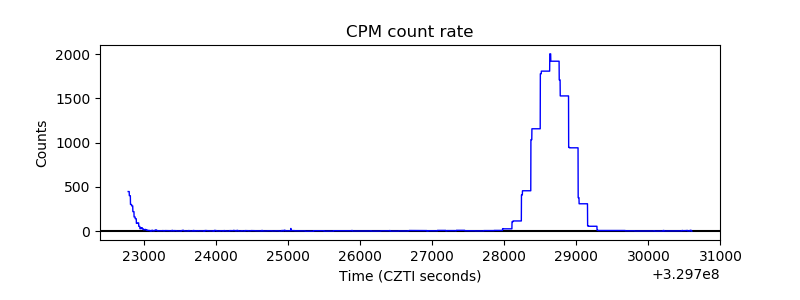 |
| CZT Counter | 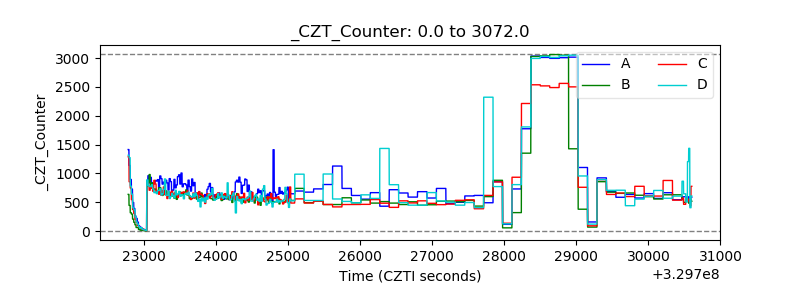 |
| +2.5 Volts monitor | 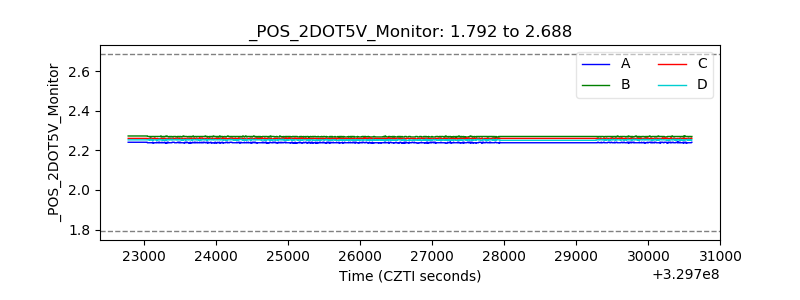 |
| +5 Volts monitor |  |
| _ROLL_ROT |  |
| _Roll_DEC | 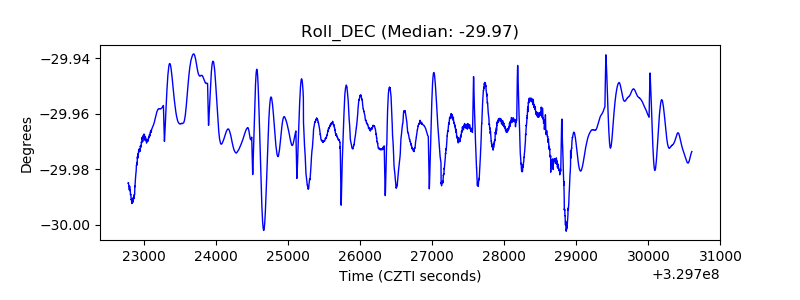 |
| _Roll_RA | 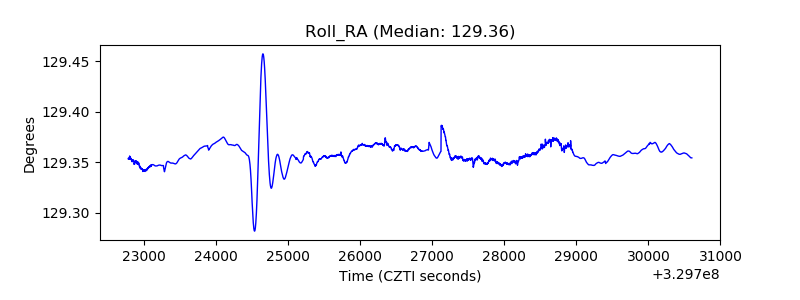 |
| Veto Counter | 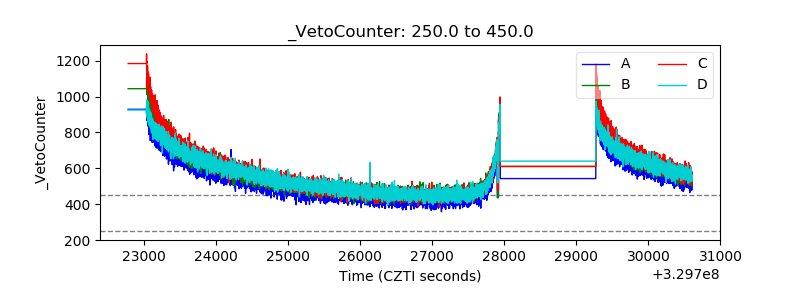 |