| Param | Original file | Final file |
|---|---|---|
| Filename | modeM0/AS1A09_085T02_9000003716_25462cztM0_level2.evt | modeM0/AS1A09_085T02_9000003716_25462cztM0_level2_quad_clean.evt |
| Size (bytes) | 564,238,080 | 123,848,640 |
| Size | 538.1 MB | 118.1 MB |
| Events in quadrant A | 3,782,809 | 847,859 |
| Events in quadrant B | 3,538,555 | 847,666 |
| Events in quadrant C | 3,772,972 | 813,011 |
| Events in quadrant D | 5,547,483 | 783,152 |
| Mode M9 | |||
|---|---|---|---|
| Quadrant | BADHDUFLAG | Total packets | Discarded packets |
| A | 0 | 13 | 0 |
| B | 0 | 13 | 0 |
| C | 0 | 13 | 0 |
| D | 0 | 13 | 0 |
| Mode M0 | |||
|---|---|---|---|
| Quadrant | BADHDUFLAG | Total packets | Discarded packets |
| A | 0 | 15653 | 0 |
| B | 0 | 14604 | 0 |
| C | 0 | 15413 | 0 |
| D | 0 | 21002 | 0 |
| Quadrant | Total seconds | Saturated seconds | Saturation percentage |
|---|---|---|---|
| A | 6588 | 129 | 1.958106% |
| B | 6589 | 144 | 2.185461% |
| C | 6589 | 209 | 3.171953% |
| D | 6589 | 298 | 4.522689% |
Noise dominated data is calculated using 1-second bins in cleaned event files. If a bin has >2000 counts, and if more than 50% of those come from <1% of pixels, then it is considered to be noise-dominated and hence unusable.
| Quadrant | # 1 sec bins | Bins with >0 counts | Bins with >2000 counts | High rate bins dominated by noise | Noise dominated (total time) | Noise dominated (detector-on time) | Marked lightcurve |
|---|---|---|---|---|---|---|---|
| A | 7853 | 6589 | 0 | 0 | 0.00% | 0.00% | 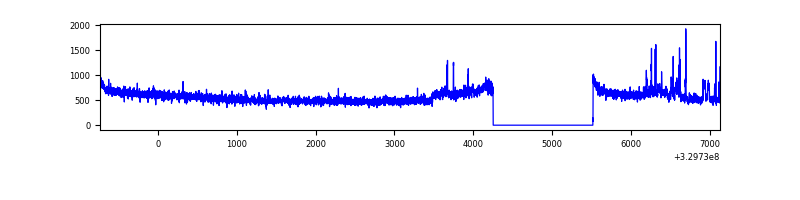 |
| B | 7854 | 6590 | 0 | 0 | 0.00% | 0.00% | 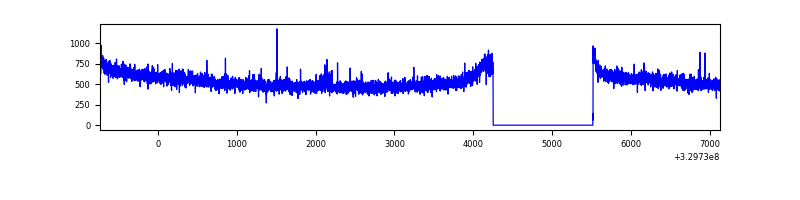 |
| C | 7854 | 6590 | 12 | 12 | 0.15% | 0.18% | 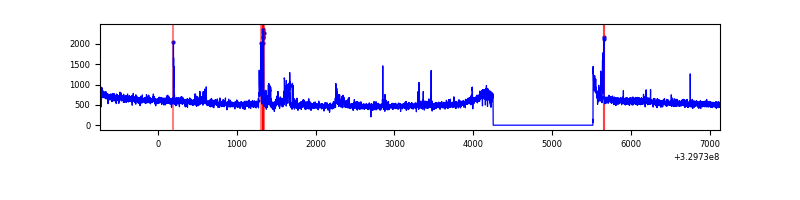 |
| D | 7854 | 6590 | 169 | 169 | 2.15% | 2.56% | 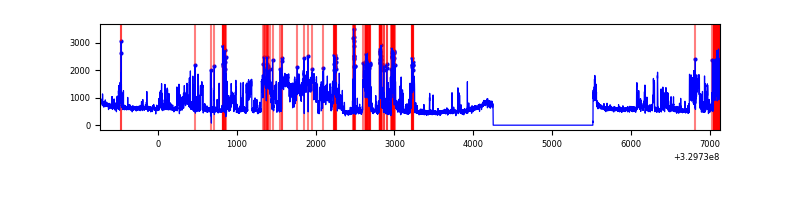 |
Top three noisy pixels from each quadrant. If the there are fewer than three noisy pixels in the level2.evt file, extra rows are filled as -1
| Pixel properties | Quadrant properties | ||||||
|---|---|---|---|---|---|---|---|
| Quadrant | DetID | PixID | Counts | Sigma | Mean | Median | Sigma |
| A | 6 | 16 | 193296 | 1060.64 | 928 | 911 | 181.4 |
| A | 13 | 254 | 11322 | 57.4 | 928 | 911 | 181.4 |
| A | 4 | 2 | 10544 | 53.11 | 928 | 911 | 181.4 |
| B | 12 | 111 | 19670 | 112.1 | 902 | 882 | 167.6 |
| B | 11 | 111 | 18024 | 102.27 | 902 | 882 | 167.6 |
| B | 0 | 190 | 17884 | 101.44 | 902 | 882 | 167.6 |
| C | 9 | 54 | 187068 | 915.73 | 881 | 889 | 203.3 |
| C | 14 | 238 | 143457 | 701.23 | 881 | 889 | 203.3 |
| C | 13 | 61 | 5932 | 24.8 | 881 | 889 | 203.3 |
| D | 1 | 52 | 1703621 | 7885.92 | 900 | 877 | 215.9 |
| D | 7 | 238 | 239263 | 1104.04 | 900 | 877 | 215.9 |
| D | 12 | 233 | 119566 | 549.68 | 900 | 877 | 215.9 |
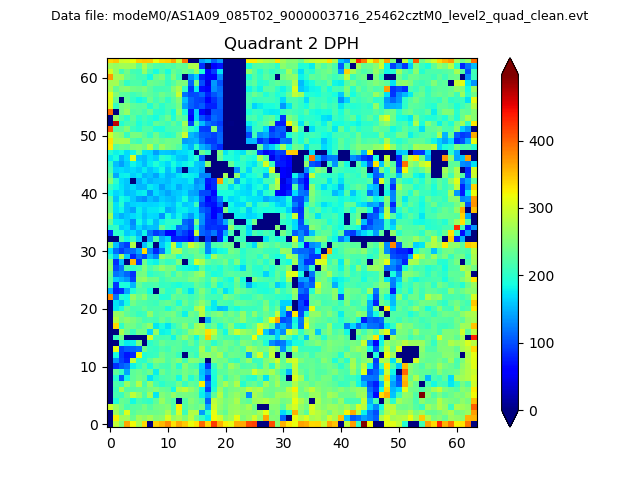
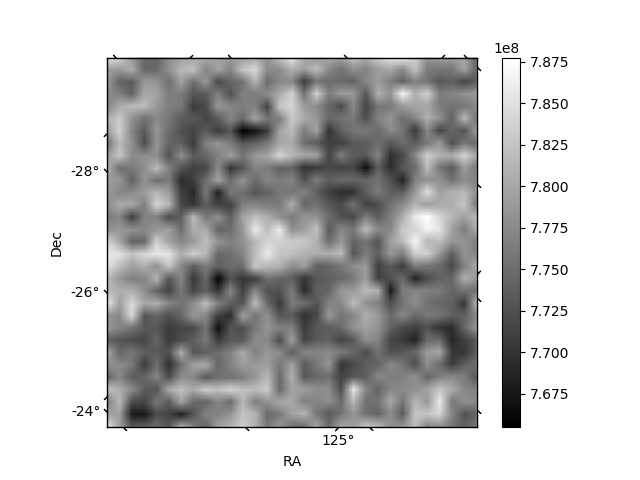
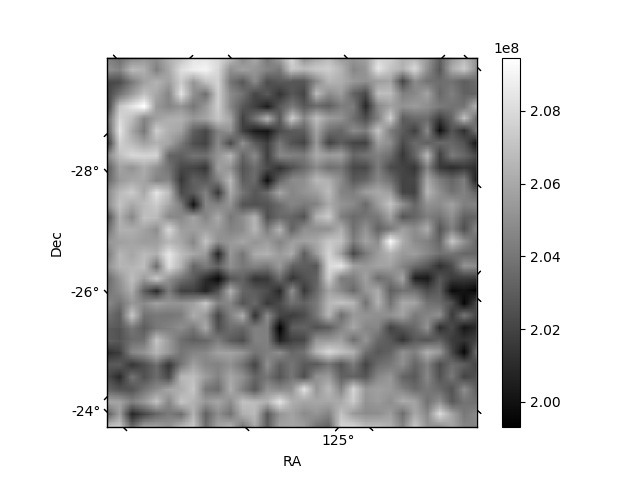
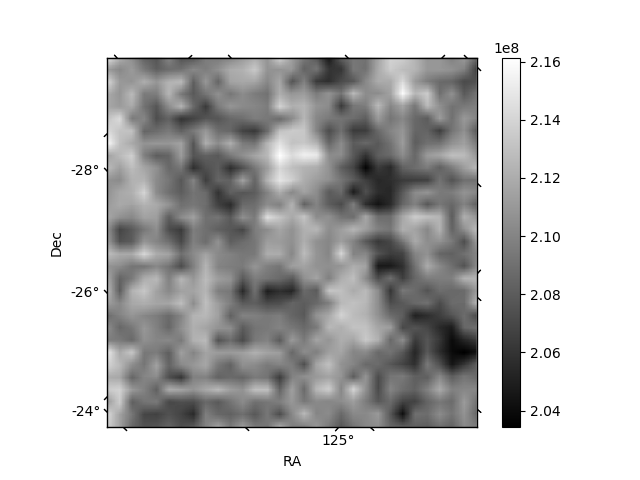
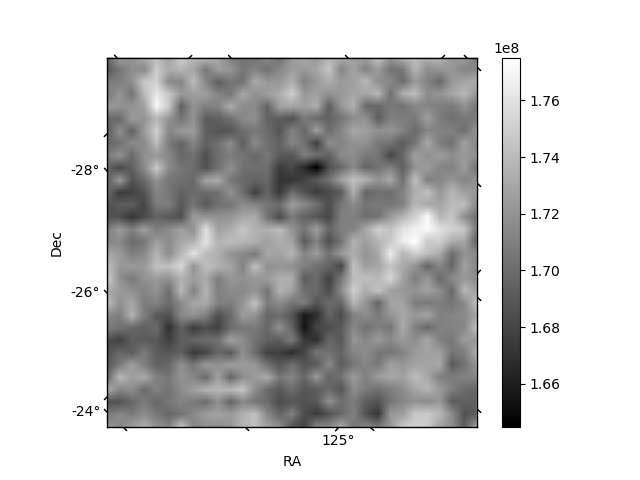
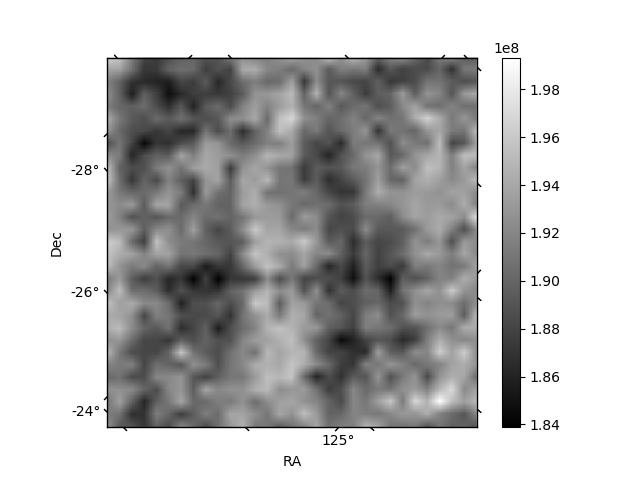
Histogram calculated using DETX and DETY for each event in the final _common_clean file
| Quadrant A | 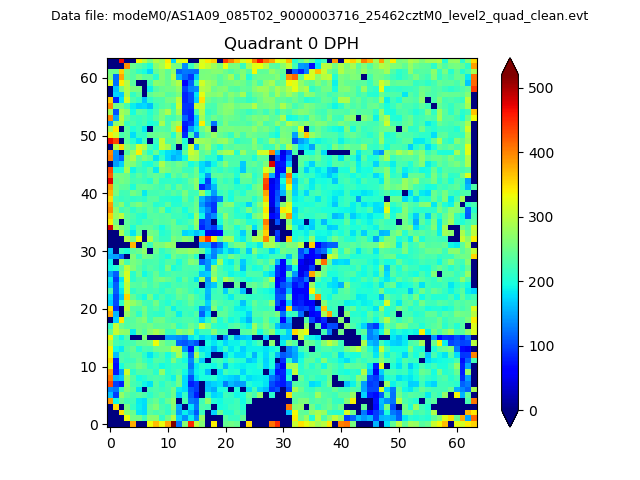 |
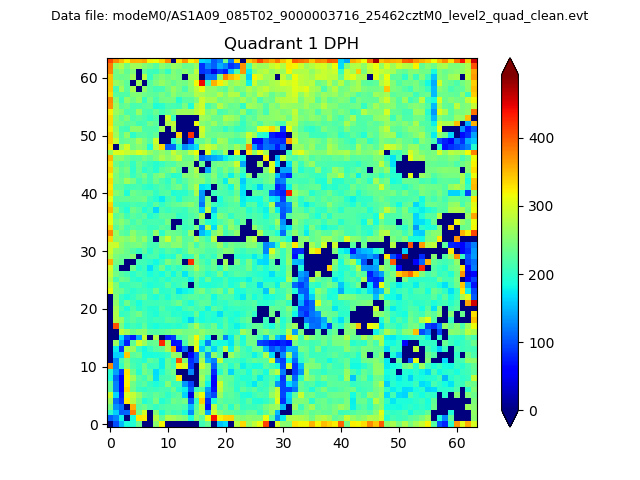 |
Quadrant B |
|---|---|---|---|
| Quadrant D | 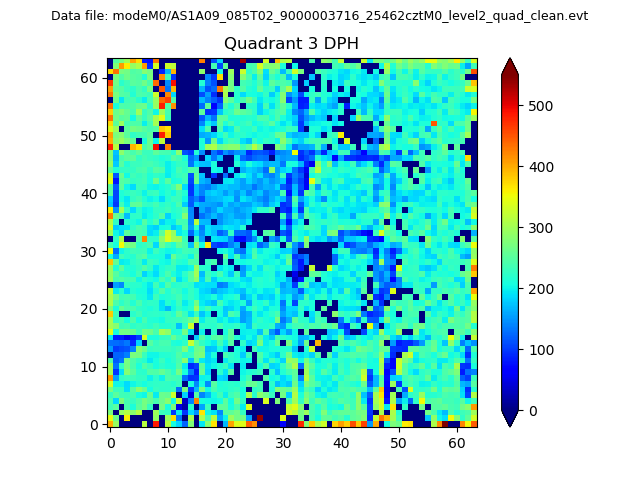 |
 |
Quadrant C |
| Plot type | Count rate plots | Images |
|---|---|---|
| Comparison with Poisson distribution Blue bars denote a histogram of data divided into 1 sec bins. Red curve is a Poisson curve with rate = median count rate of data. |
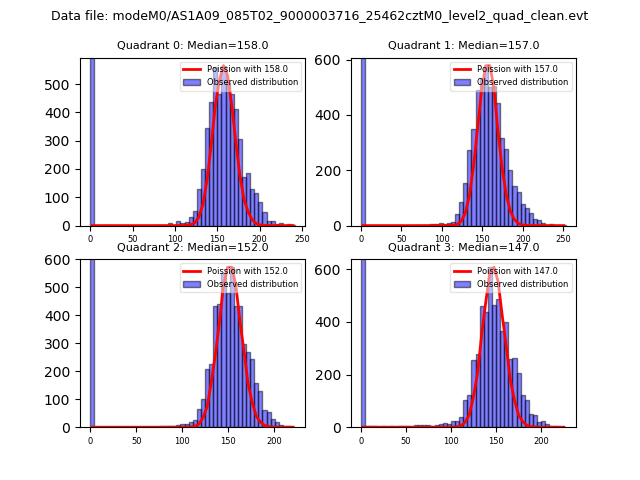 |
 |
| Quadrant-wise count rates Data is divided into 100 sec bins |
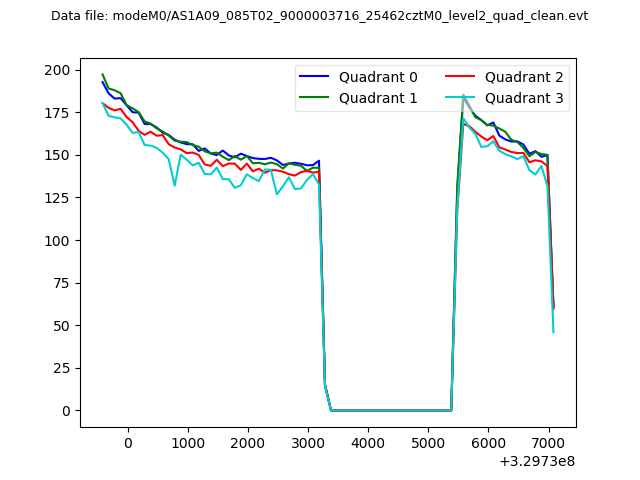 |
|
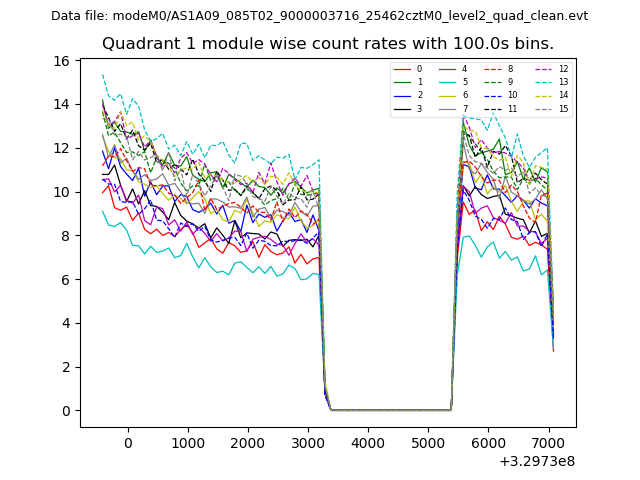
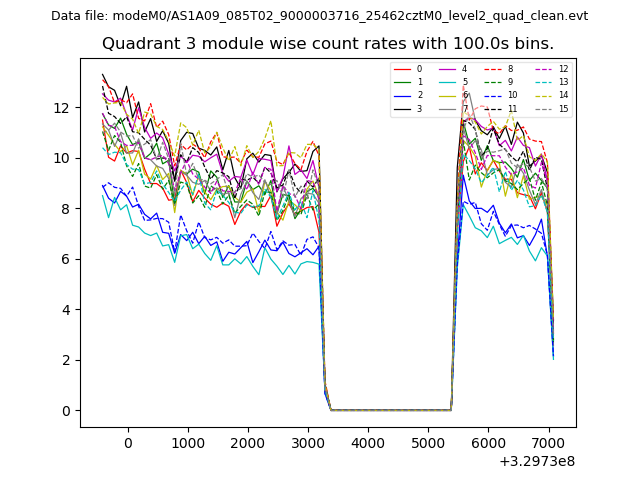
| Module-wise count rates for Quadrant A Data is divided into 100 sec bins |
 |
 |
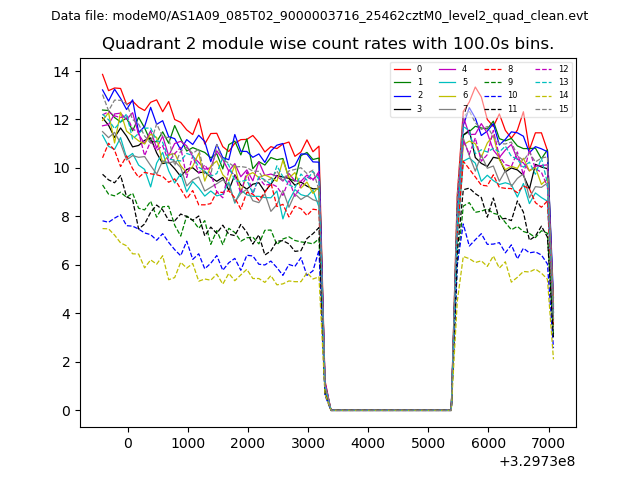
| Module-wise count rates for Quadrant B Data is divided into 100 sec bins |
 |
 |
| Module-wise count rates for Quadrant C Data is divided into 100 sec bins |
 |
 |
| Module-wise count rates for Quadrant D Data is divided into 100 sec bins |
 |
 |
| Parameter | Plot |
|---|---|
| CZT HV Monitor | 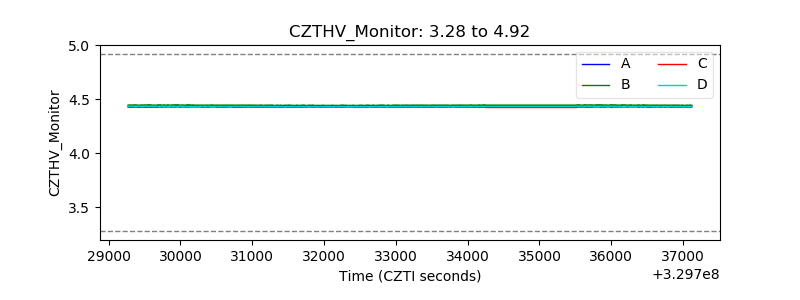 |
| D_VDD | 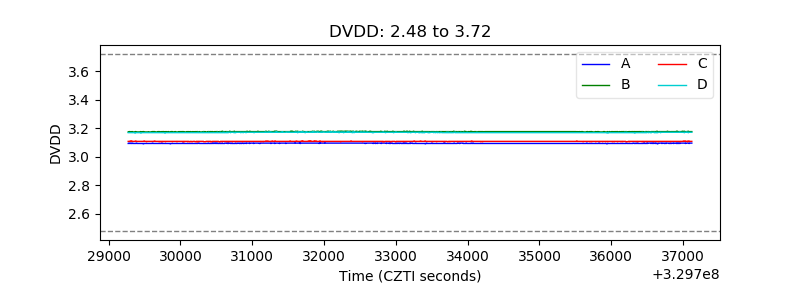 |
| Temperature 1 | 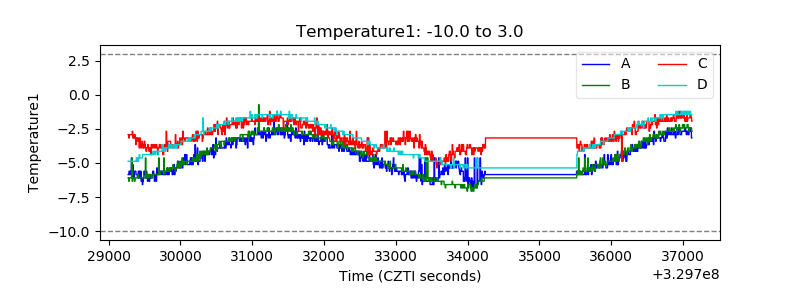 |
| Veto HV Monitor | 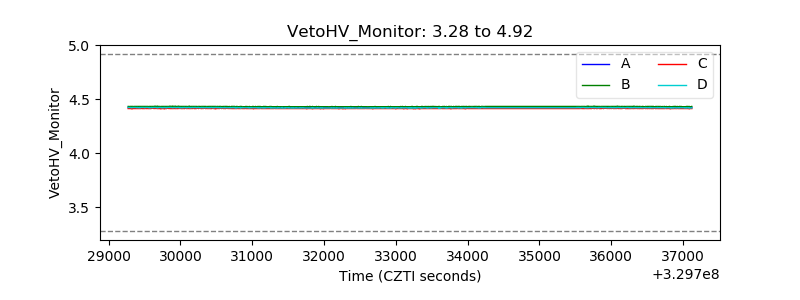 |
| Veto LLD | 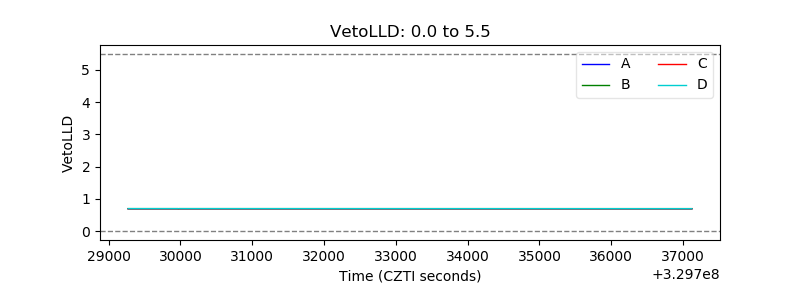 |
| Alpha Counter | 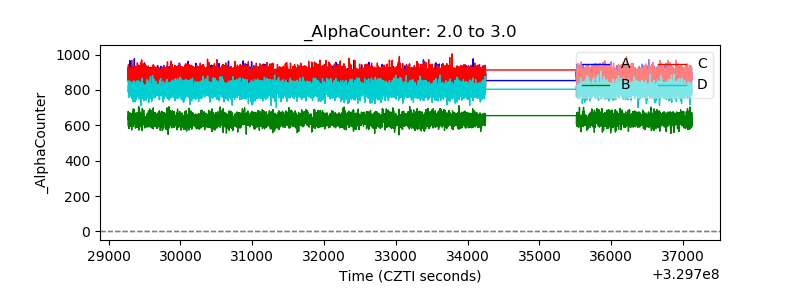 |
| _CPM_Rate | 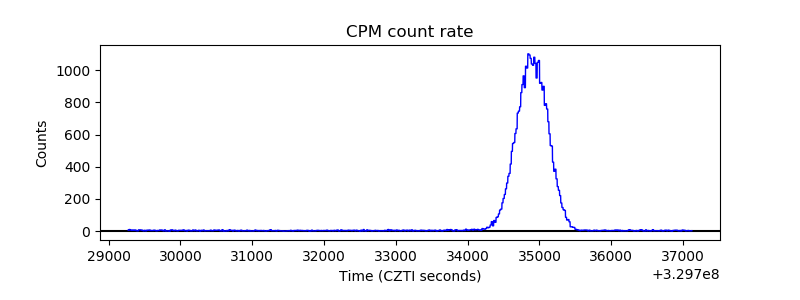 |
| CZT Counter | 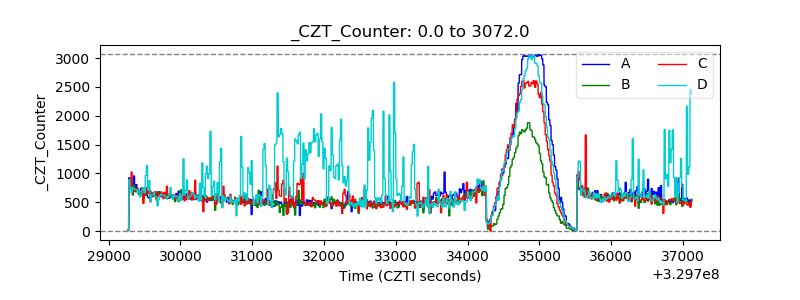 |
| +2.5 Volts monitor | 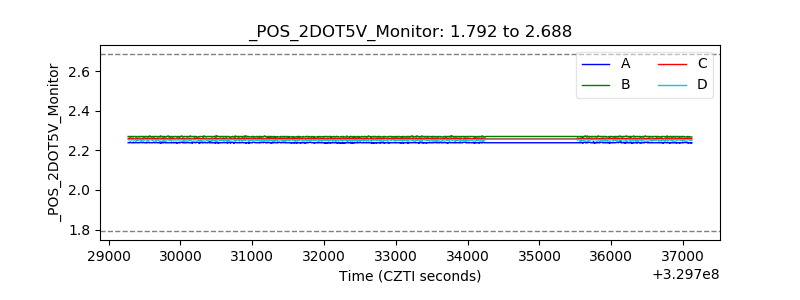 |
| +5 Volts monitor | 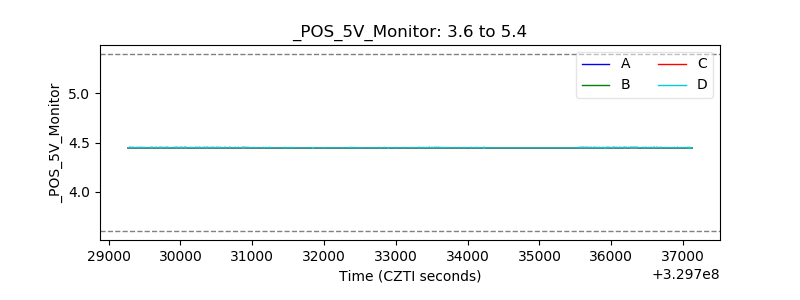 |
| _ROLL_ROT | 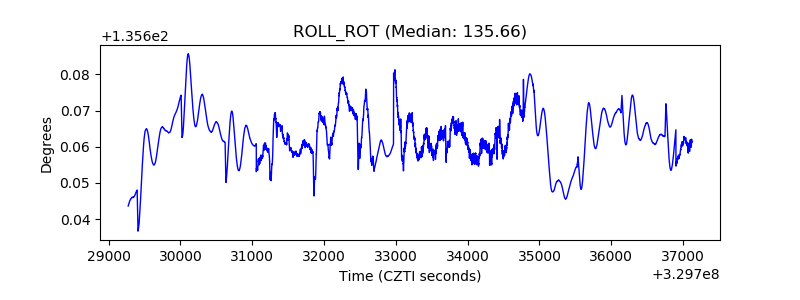 |
| _Roll_DEC | 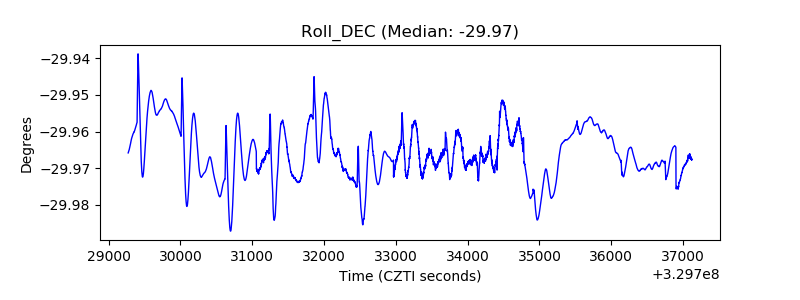 |
| _Roll_RA | 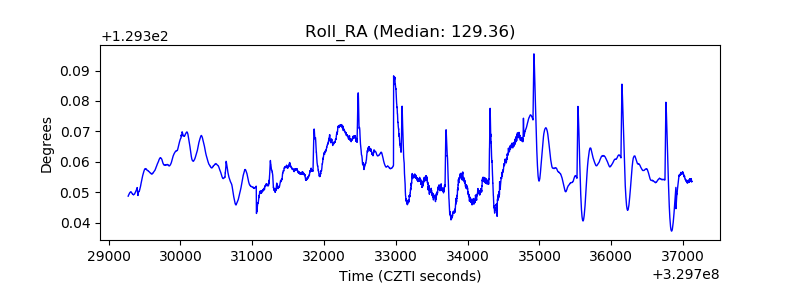 |
| Veto Counter |  |