| Param | Original file | Final file |
|---|---|---|
| Filename | modeM0/AS1A09_085T02_9000003716_25463cztM0_level2.evt | modeM0/AS1A09_085T02_9000003716_25463cztM0_level2_quad_clean.evt |
| Size (bytes) | 545,166,720 | 103,279,680 |
| Size | 519.9 MB | 98.5 MB |
| Events in quadrant A | 3,840,614 | 693,022 |
| Events in quadrant B | 3,147,430 | 692,875 |
| Events in quadrant C | 3,379,810 | 667,063 |
| Events in quadrant D | 5,718,644 | 638,083 |
| Mode M9 | |||
|---|---|---|---|
| Quadrant | BADHDUFLAG | Total packets | Discarded packets |
| A | 0 | 11 | 0 |
| B | 0 | 11 | 0 |
| C | 0 | 11 | 0 |
| D | 0 | 11 | 0 |
| Mode M0 | |||
|---|---|---|---|
| Quadrant | BADHDUFLAG | Total packets | Discarded packets |
| A | 0 | 15543 | 0 |
| B | 0 | 13102 | 0 |
| C | 0 | 13887 | 0 |
| D | 0 | 21099 | 0 |
| Quadrant | Total seconds | Saturated seconds | Saturation percentage |
|---|---|---|---|
| A | 6262 | 104 | 1.660811% |
| B | 6263 | 88 | 1.405077% |
| C | 6263 | 181 | 2.889989% |
| D | 6263 | 393 | 6.274948% |
Noise dominated data is calculated using 1-second bins in cleaned event files. If a bin has >2000 counts, and if more than 50% of those come from <1% of pixels, then it is considered to be noise-dominated and hence unusable.
| Quadrant | # 1 sec bins | Bins with >0 counts | Bins with >2000 counts | High rate bins dominated by noise | Noise dominated (total time) | Noise dominated (detector-on time) | Marked lightcurve |
|---|---|---|---|---|---|---|---|
| A | 7352 | 6263 | 3 | 3 | 0.04% | 0.05% | 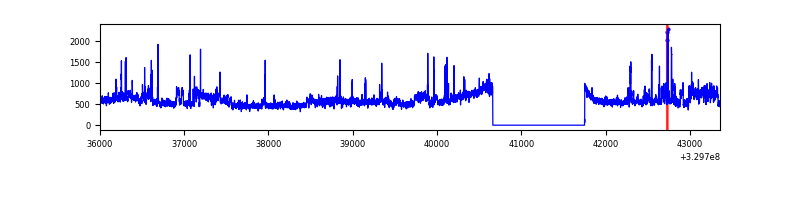 |
| B | 7353 | 6264 | 0 | 0 | 0.00% | 0.00% | 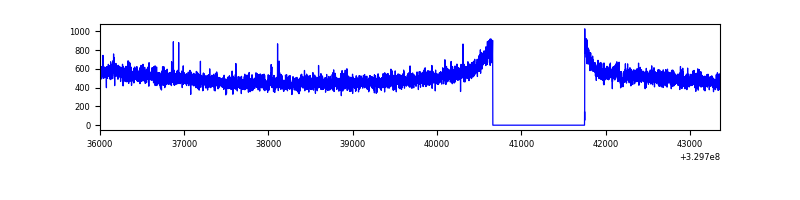 |
| C | 7353 | 6264 | 22 | 22 | 0.30% | 0.35% | 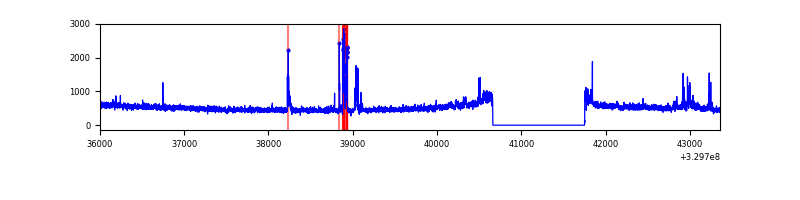 |
| D | 7353 | 6264 | 297 | 297 | 4.04% | 4.74% | 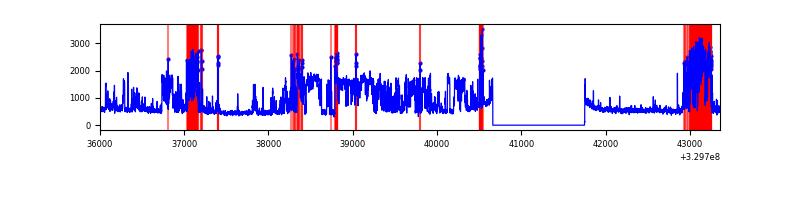 |
Top three noisy pixels from each quadrant. If the there are fewer than three noisy pixels in the level2.evt file, extra rows are filled as -1
| Pixel properties | Quadrant properties | ||||||
|---|---|---|---|---|---|---|---|
| Quadrant | DetID | PixID | Counts | Sigma | Mean | Median | Sigma |
| A | 6 | 16 | 664771 | 4037.17 | 823 | 807 | 164.5 |
| A | 13 | 254 | 10992 | 61.93 | 823 | 807 | 164.5 |
| A | 3 | 137 | 7174 | 38.71 | 823 | 807 | 164.5 |
| B | 12 | 111 | 18152 | 113.69 | 802 | 783 | 152.8 |
| B | 11 | 111 | 16483 | 102.76 | 802 | 783 | 152.8 |
| B | 14 | 111 | 15026 | 93.23 | 802 | 783 | 152.8 |
| C | 9 | 54 | 214707 | 1178.93 | 779 | 784 | 181.5 |
| C | 14 | 238 | 126590 | 693.31 | 779 | 784 | 181.5 |
| C | 13 | 61 | 5187 | 24.26 | 779 | 784 | 181.5 |
| D | 1 | 52 | 1873708 | 9880.01 | 784 | 762 | 189.6 |
| D | 7 | 238 | 680325 | 3584.78 | 784 | 762 | 189.6 |
| D | 8 | 195 | 106637 | 558.5 | 784 | 762 | 189.6 |
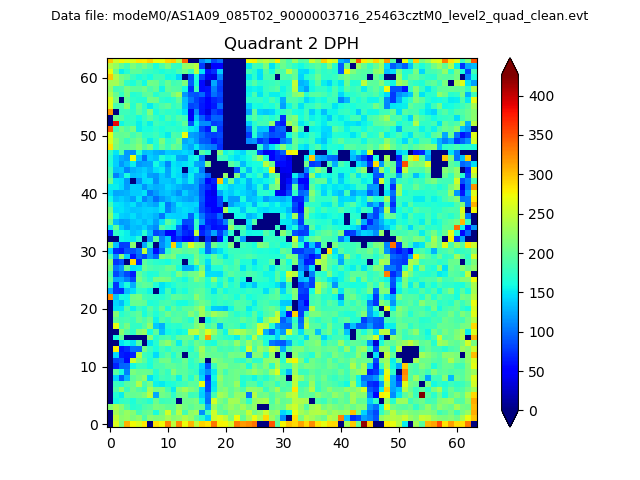
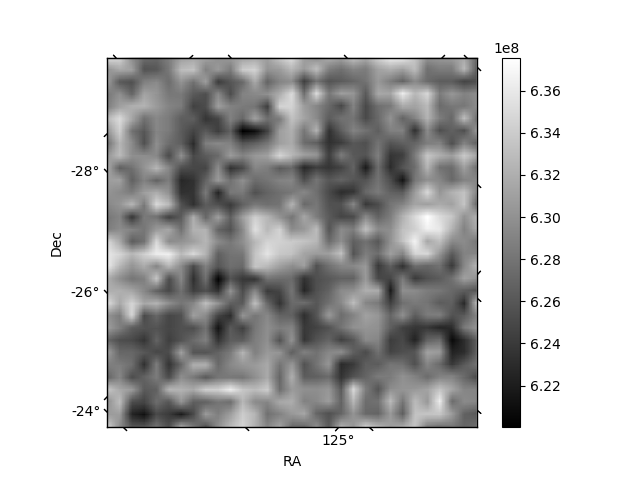
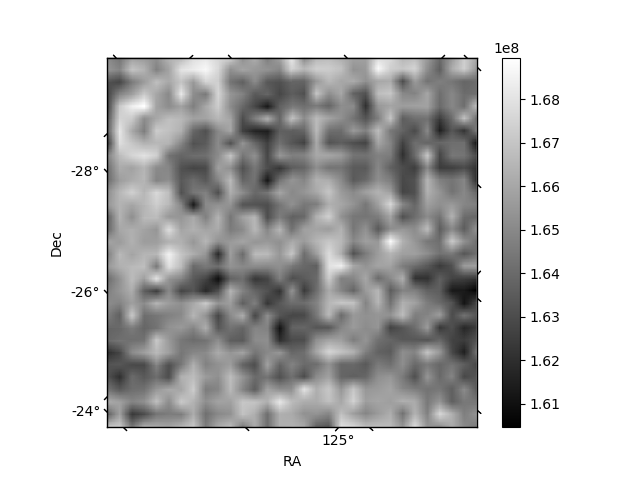
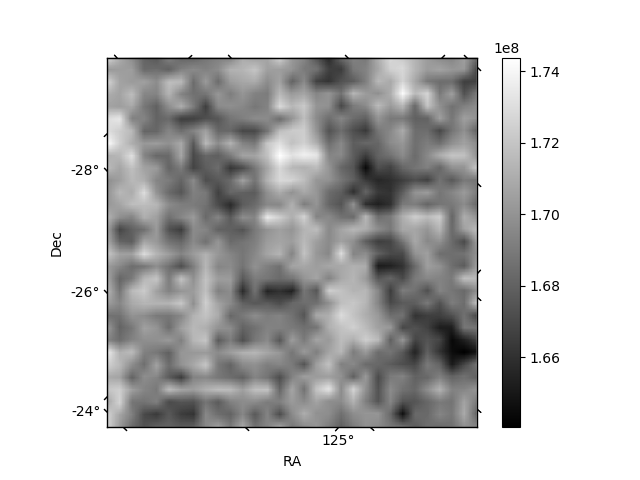
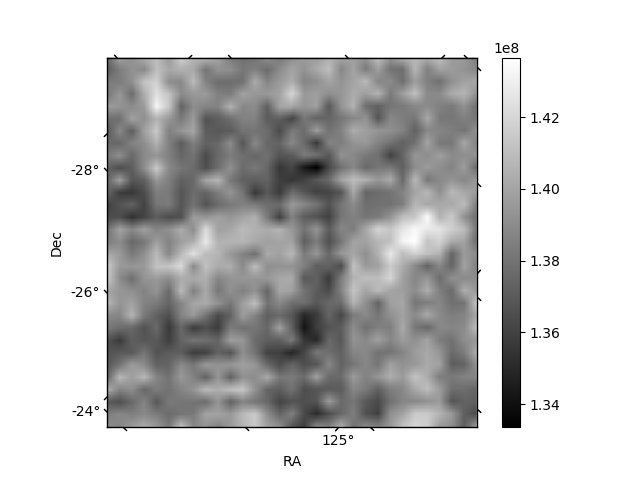
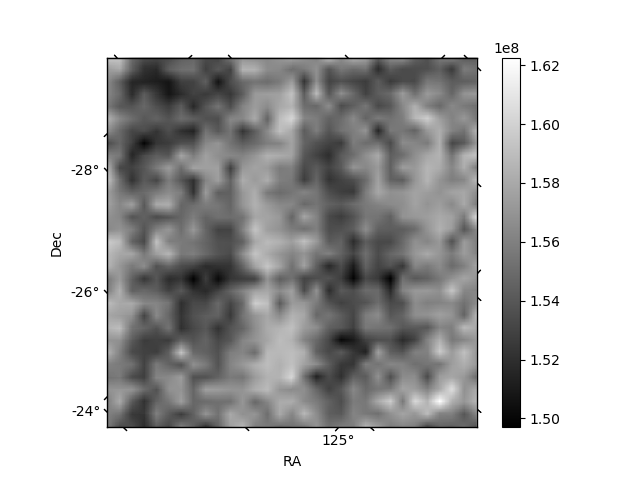
Histogram calculated using DETX and DETY for each event in the final _common_clean file
| Quadrant A | 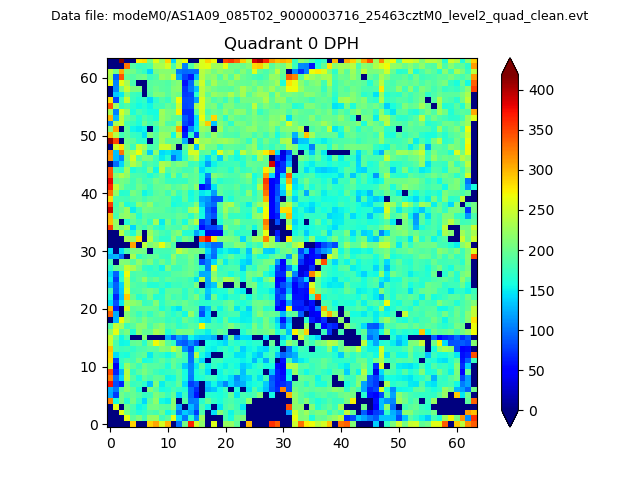 |
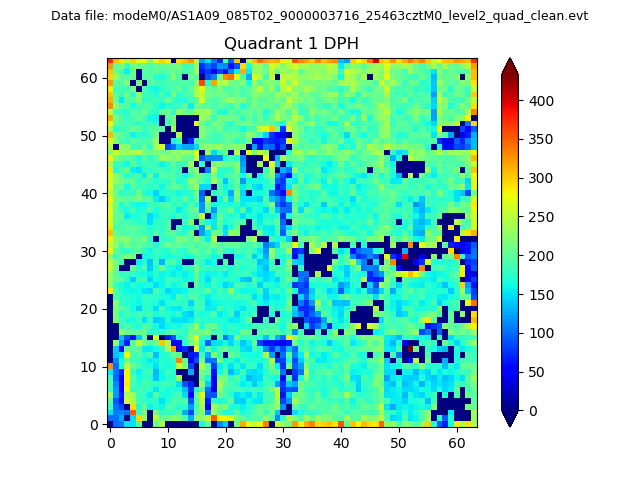 |
Quadrant B |
|---|---|---|---|
| Quadrant D | 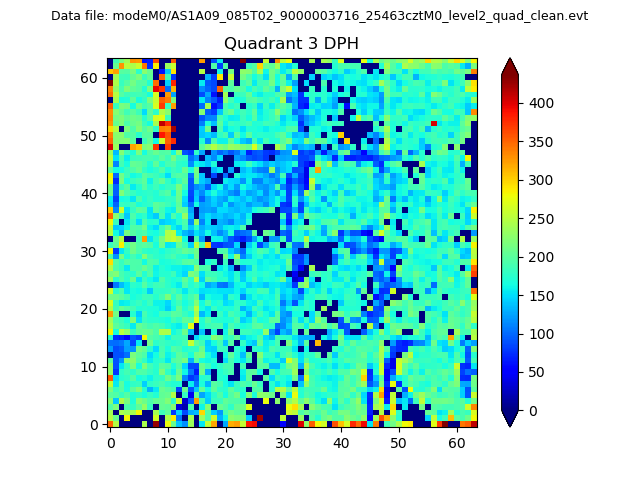 |
 |
Quadrant C |
| Plot type | Count rate plots | Images |
|---|---|---|
| Comparison with Poisson distribution Blue bars denote a histogram of data divided into 1 sec bins. Red curve is a Poisson curve with rate = median count rate of data. |
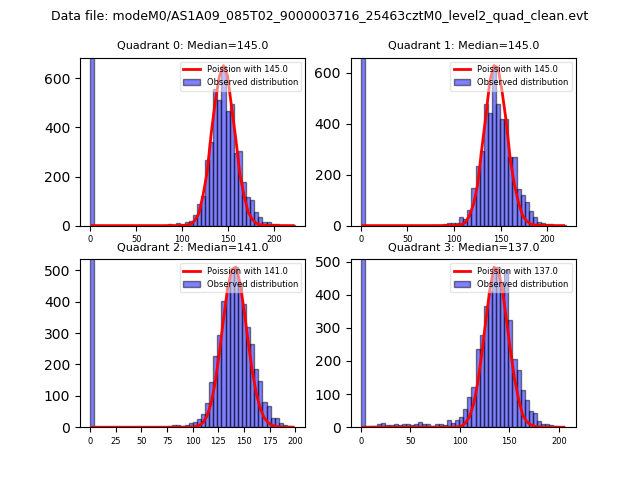 |
 |
| Quadrant-wise count rates Data is divided into 100 sec bins |
 |
|
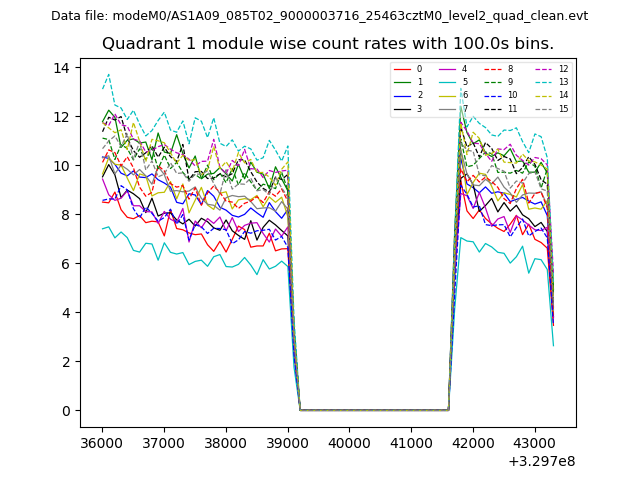
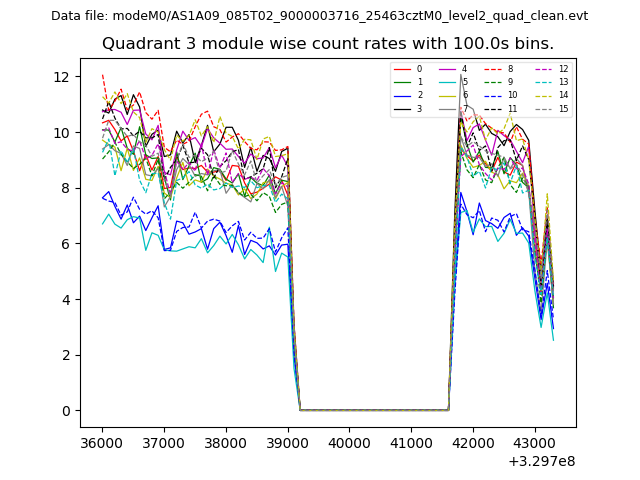
| Module-wise count rates for Quadrant A Data is divided into 100 sec bins |
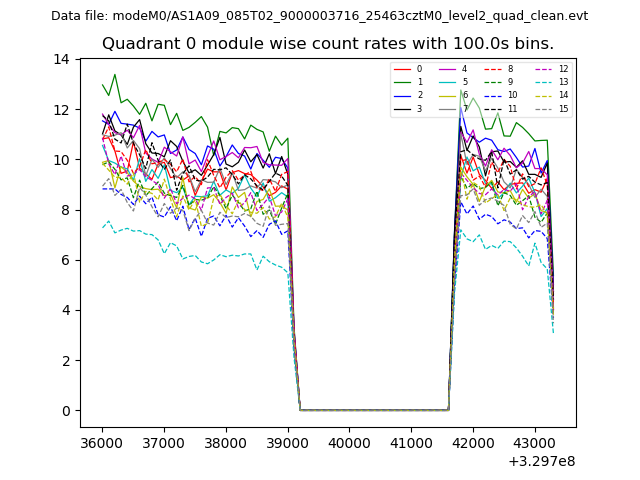 |
 |
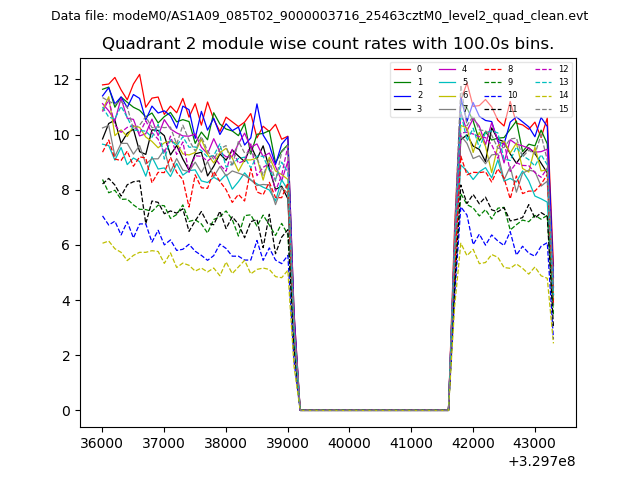
| Module-wise count rates for Quadrant B Data is divided into 100 sec bins |
 |
 |
| Module-wise count rates for Quadrant C Data is divided into 100 sec bins |
 |
 |
| Module-wise count rates for Quadrant D Data is divided into 100 sec bins |
 |
 |
| Parameter | Plot |
|---|---|
| CZT HV Monitor | 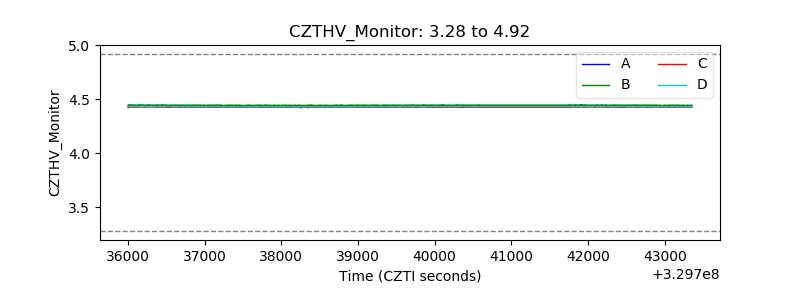 |
| D_VDD | 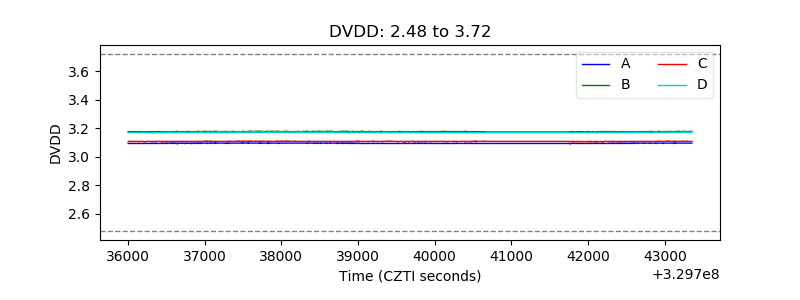 |
| Temperature 1 | 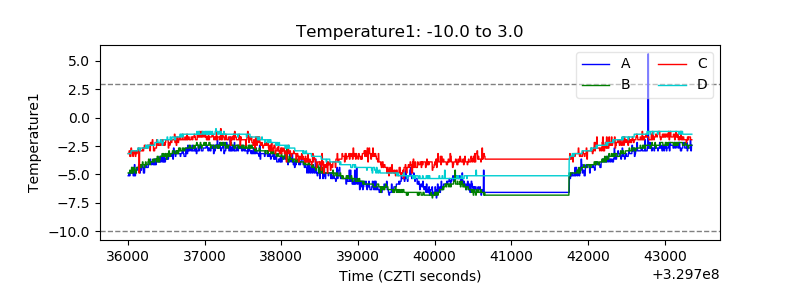 |
| Veto HV Monitor | 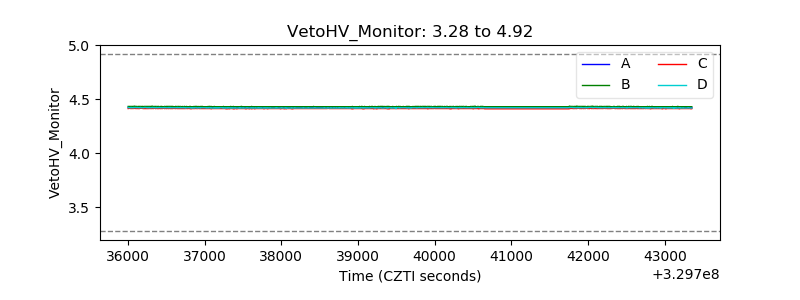 |
| Veto LLD | 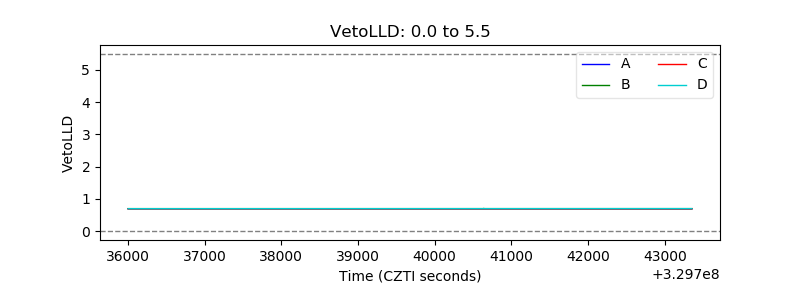 |
| Alpha Counter | 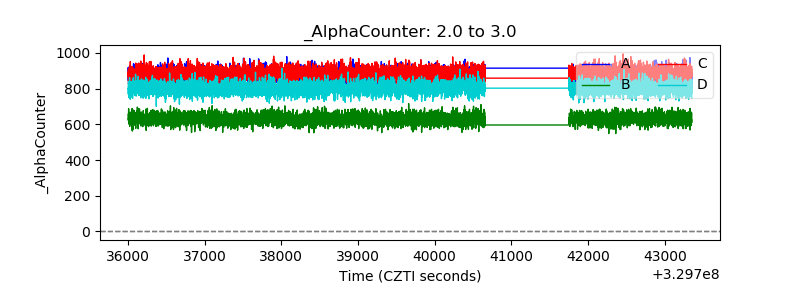 |
| _CPM_Rate | 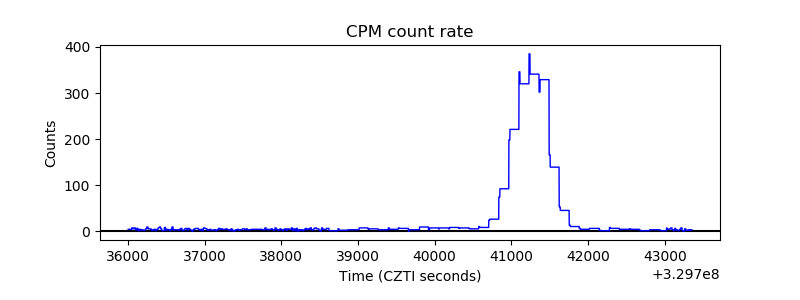 |
| CZT Counter | 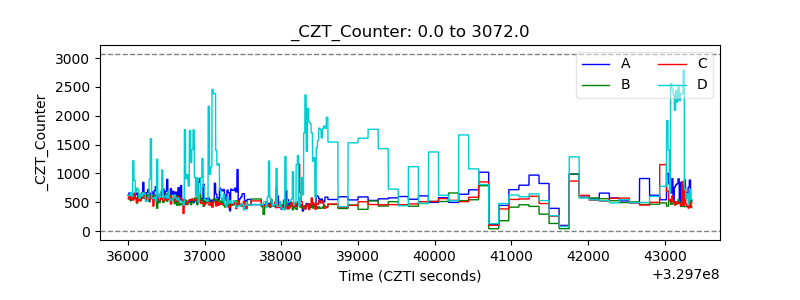 |
| +2.5 Volts monitor |  |
| +5 Volts monitor |  |
| _ROLL_ROT | 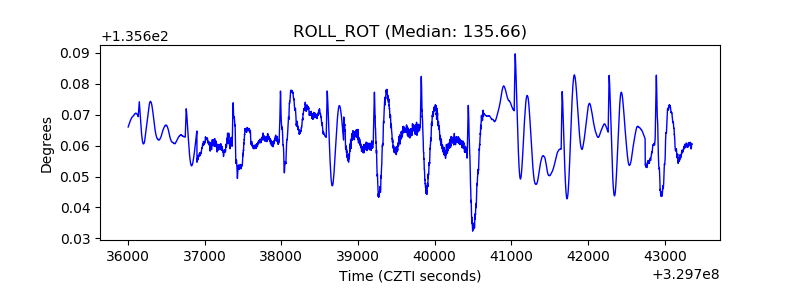 |
| _Roll_DEC | 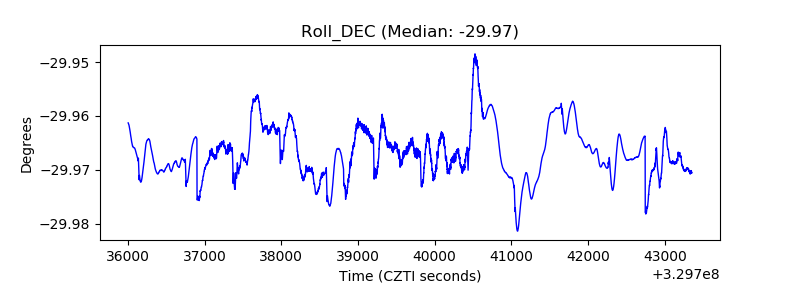 |
| _Roll_RA | 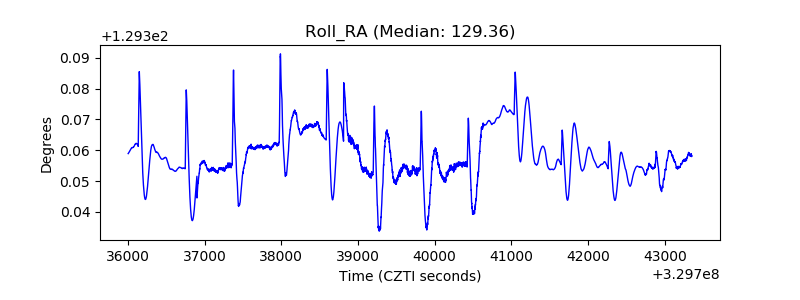 |
| Veto Counter | 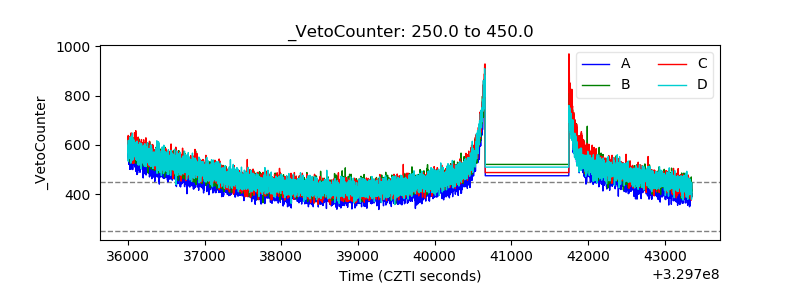 |