| Param | Original file | Final file |
|---|---|---|
| Filename | modeM0/AS1A09_085T02_9000003716_25464cztM0_level2.evt | modeM0/AS1A09_085T02_9000003716_25464cztM0_level2_quad_clean.evt |
| Size (bytes) | 480,176,640 | 86,682,240 |
| Size | 457.9 MB | 82.7 MB |
| Events in quadrant A | 3,399,995 | 564,016 |
| Events in quadrant B | 3,043,203 | 563,550 |
| Events in quadrant C | 3,092,059 | 541,282 |
| Events in quadrant D | 4,581,187 | 518,372 |
| Mode M9 | |||
|---|---|---|---|
| Quadrant | BADHDUFLAG | Total packets | Discarded packets |
| A | 0 | 7 | 0 |
| B | 0 | 7 | 0 |
| C | 0 | 7 | 0 |
| D | 0 | 7 | 0 |
| Mode M0 | |||
|---|---|---|---|
| Quadrant | BADHDUFLAG | Total packets | Discarded packets |
| A | 0 | 14036 | 0 |
| B | 0 | 12973 | 0 |
| C | 0 | 13187 | 0 |
| D | 0 | 17590 | 0 |
| Quadrant | Total seconds | Saturated seconds | Saturation percentage |
|---|---|---|---|
| A | 6267 | 78 | 1.244615% |
| B | 6267 | 83 | 1.324398% |
| C | 6267 | 111 | 1.771182% |
| D | 6267 | 385 | 6.143290% |
Noise dominated data is calculated using 1-second bins in cleaned event files. If a bin has >2000 counts, and if more than 50% of those come from <1% of pixels, then it is considered to be noise-dominated and hence unusable.
| Quadrant | # 1 sec bins | Bins with >0 counts | Bins with >2000 counts | High rate bins dominated by noise | Noise dominated (total time) | Noise dominated (detector-on time) | Marked lightcurve |
|---|---|---|---|---|---|---|---|
| A | 7017 | 6270 | 3 | 3 | 0.04% | 0.05% | 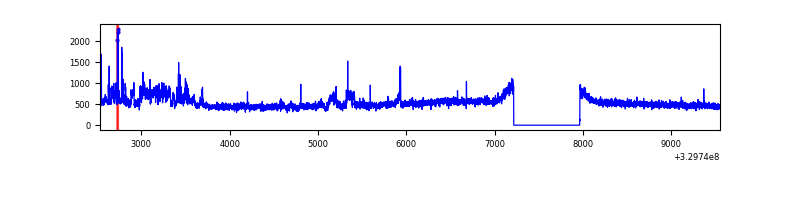 |
| B | 7017 | 6270 | 0 | 0 | 0.00% | 0.00% | 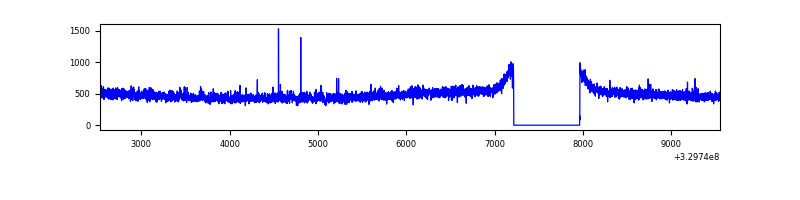 |
| C | 7017 | 6270 | 0 | 0 | 0.00% | 0.00% | 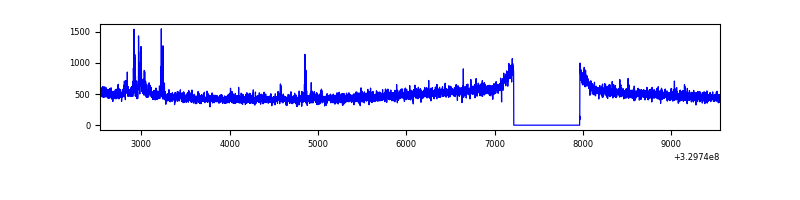 |
| D | 7017 | 6270 | 345 | 345 | 4.92% | 5.50% | 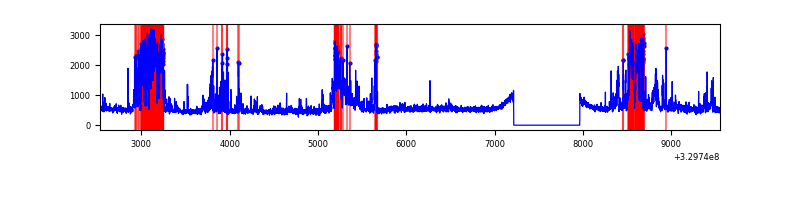 |
Top three noisy pixels from each quadrant. If the there are fewer than three noisy pixels in the level2.evt file, extra rows are filled as -1
| Pixel properties | Quadrant properties | ||||||
|---|---|---|---|---|---|---|---|
| Quadrant | DetID | PixID | Counts | Sigma | Mean | Median | Sigma |
| A | 6 | 16 | 346118 | 2180.59 | 791 | 772 | 158.4 |
| A | 13 | 254 | 10314 | 60.25 | 791 | 772 | 158.4 |
| A | 3 | 137 | 7168 | 40.38 | 791 | 772 | 158.4 |
| B | 12 | 111 | 17960 | 115.87 | 775 | 756 | 148.5 |
| B | 11 | 111 | 16263 | 104.44 | 775 | 756 | 148.5 |
| B | 14 | 111 | 14885 | 95.16 | 775 | 756 | 148.5 |
| C | 14 | 238 | 119548 | 681.36 | 747 | 752 | 174.4 |
| C | 9 | 54 | 49849 | 281.6 | 747 | 752 | 174.4 |
| C | 2 | 16 | 8018 | 41.67 | 747 | 752 | 174.4 |
| D | 7 | 238 | 1259217 | 6908.58 | 751 | 730 | 182.2 |
| D | 8 | 195 | 294146 | 1610.73 | 751 | 730 | 182.2 |
| D | 12 | 233 | 67759 | 367.96 | 751 | 730 | 182.2 |
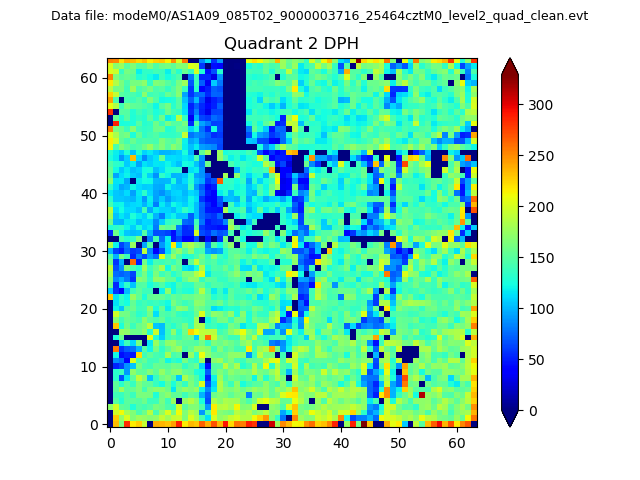
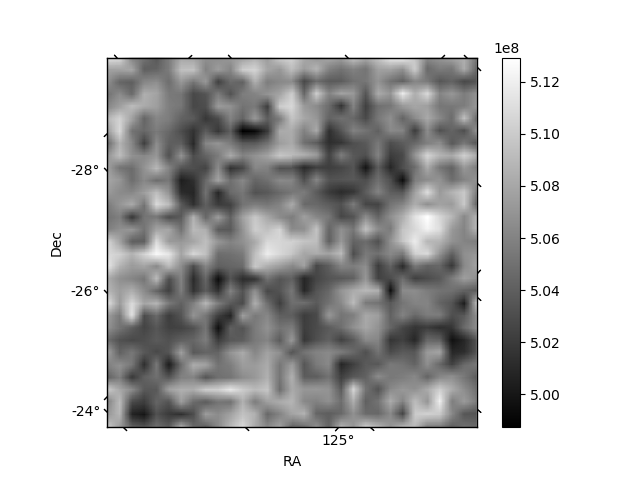
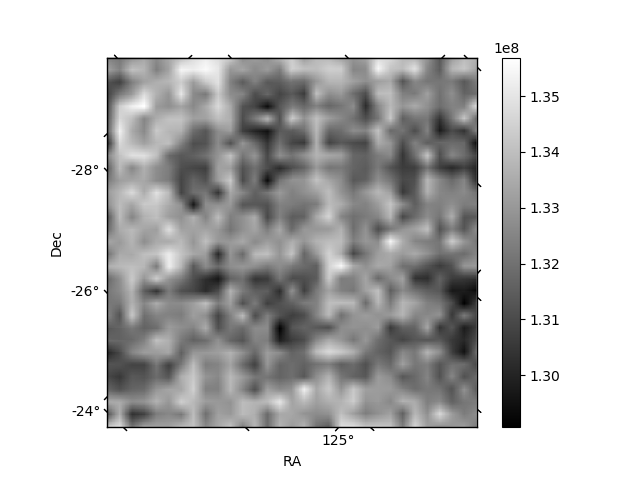
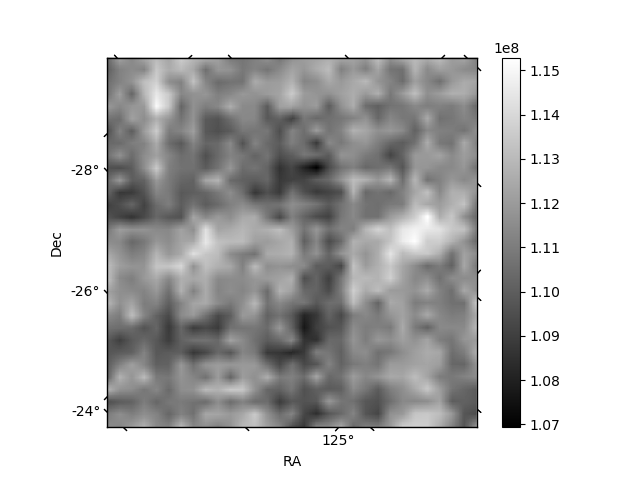
Histogram calculated using DETX and DETY for each event in the final _common_clean file
| Quadrant A | 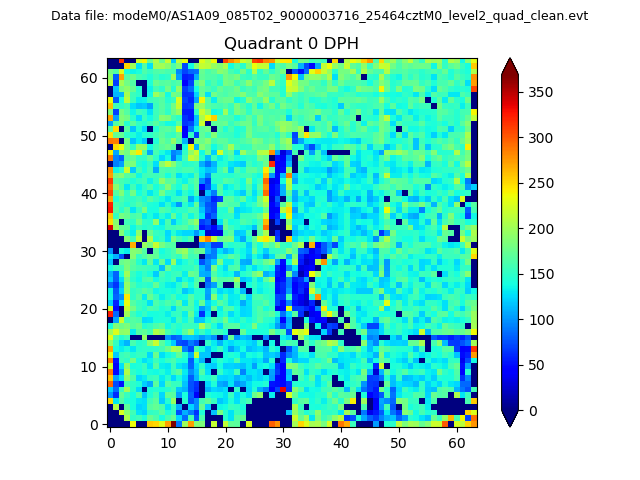 |
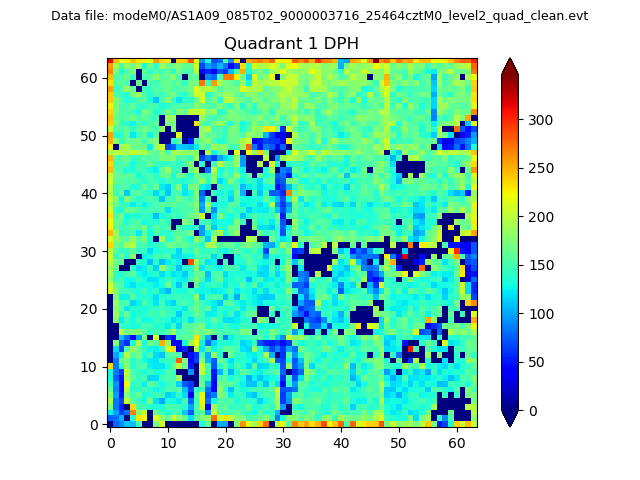 |
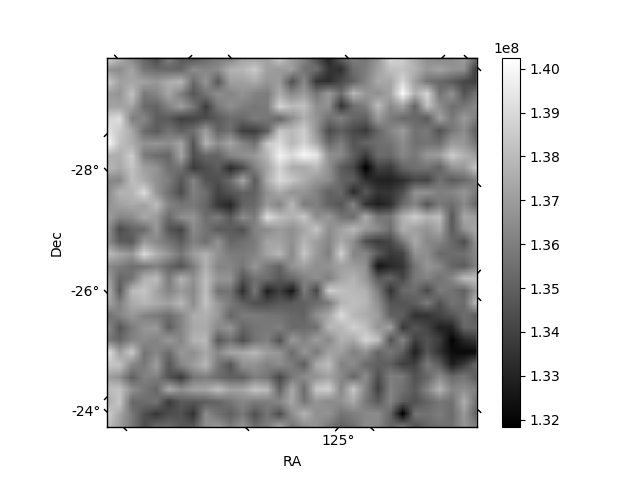
Quadrant B |
|---|---|---|---|
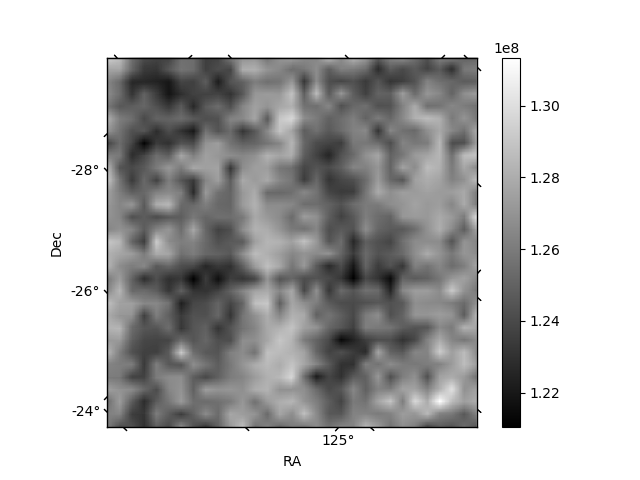
| Quadrant D | 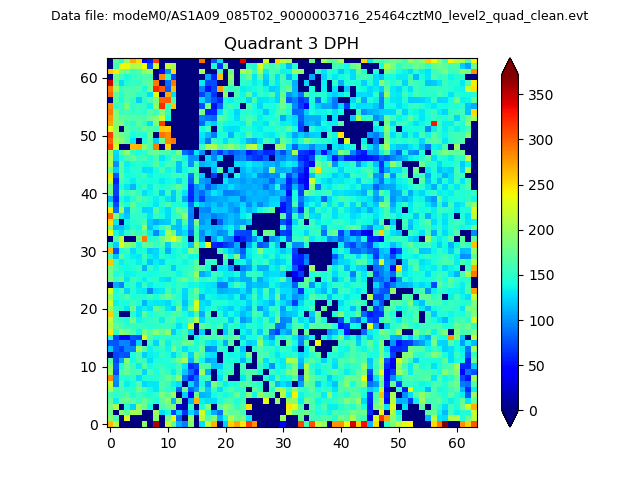 |
 |
Quadrant C |
| Plot type | Count rate plots | Images |
|---|---|---|
| Comparison with Poisson distribution Blue bars denote a histogram of data divided into 1 sec bins. Red curve is a Poisson curve with rate = median count rate of data. |
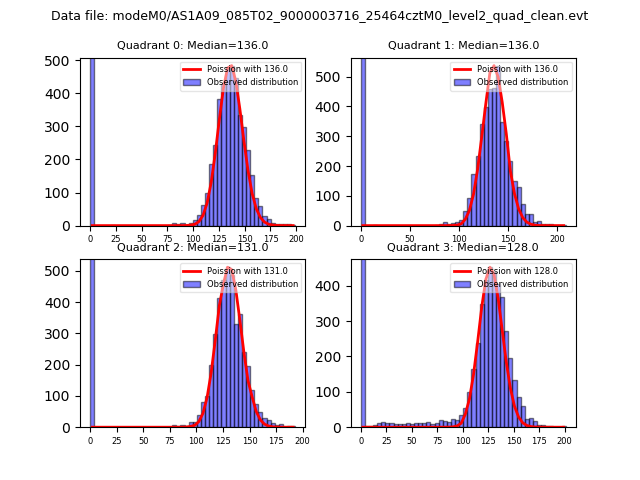 |
 |
| Quadrant-wise count rates Data is divided into 100 sec bins |
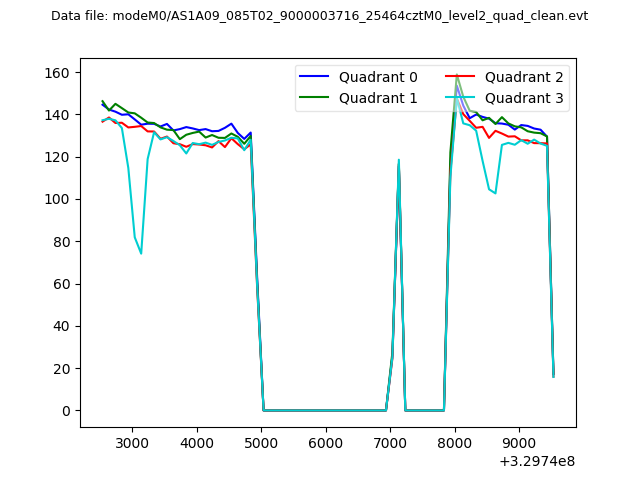 |
|
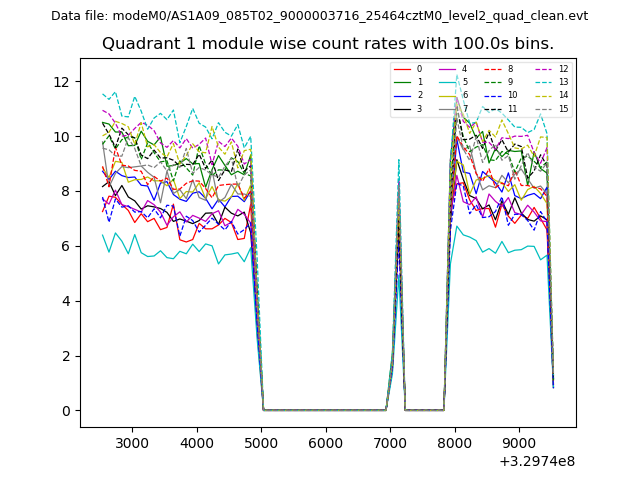
| Module-wise count rates for Quadrant A Data is divided into 100 sec bins |
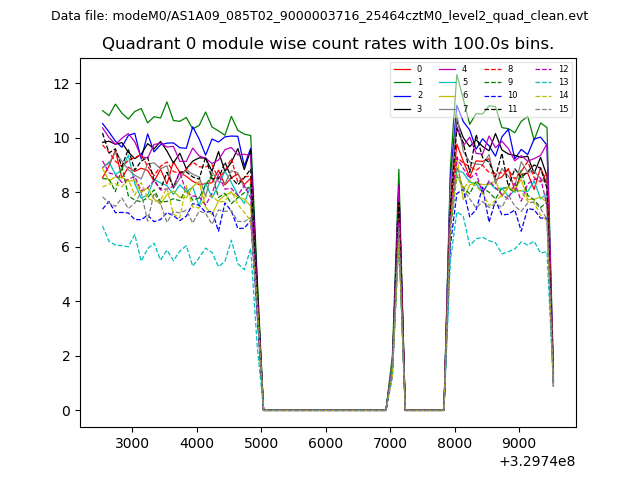 |
 |
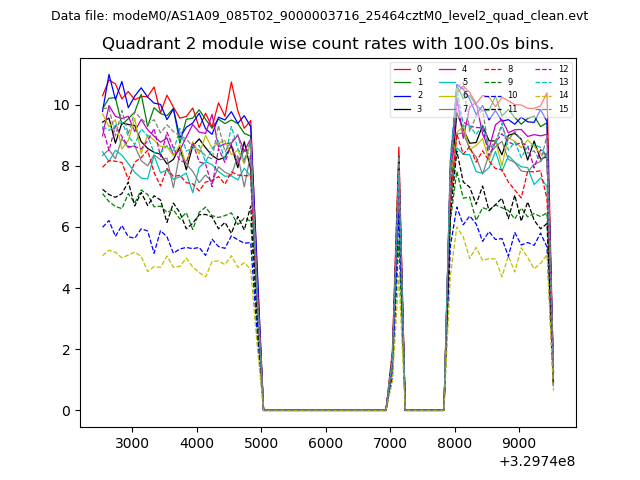
| Module-wise count rates for Quadrant B Data is divided into 100 sec bins |
 |
 |
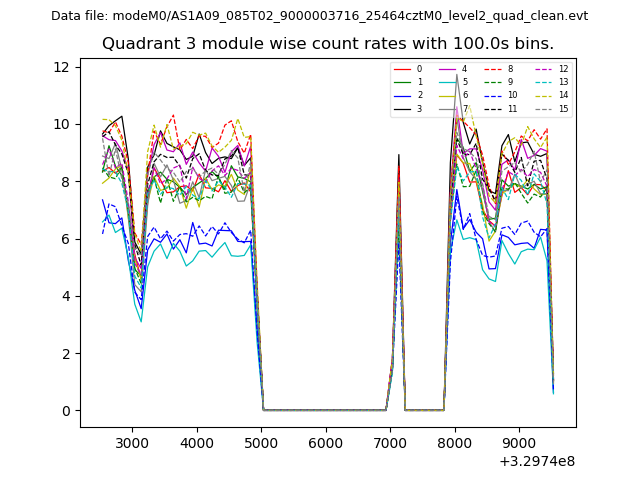
| Module-wise count rates for Quadrant C Data is divided into 100 sec bins |
 |
 |
| Module-wise count rates for Quadrant D Data is divided into 100 sec bins |
 |
 |
| Parameter | Plot |
|---|---|
| CZT HV Monitor | 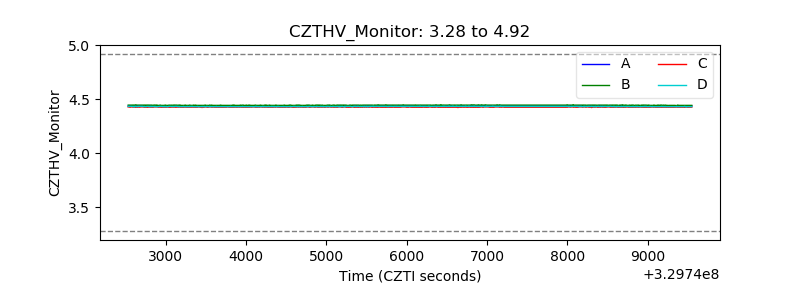 |
| D_VDD | 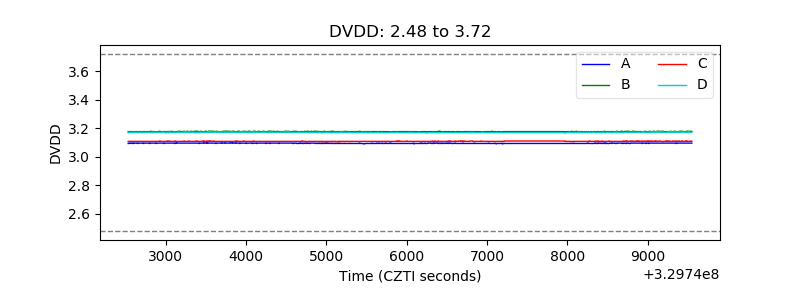 |
| Temperature 1 | 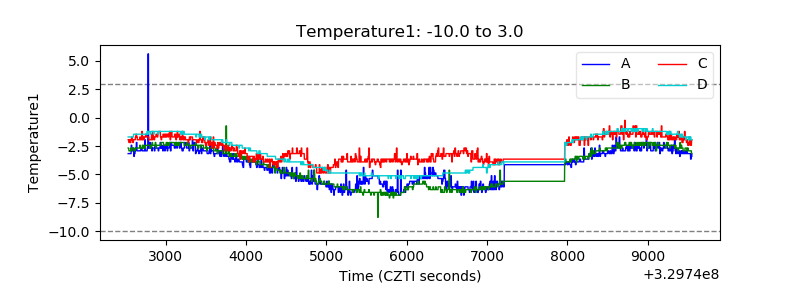 |
| Veto HV Monitor | 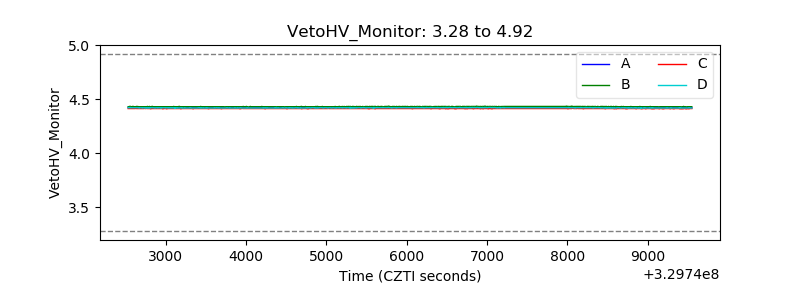 |
| Veto LLD | 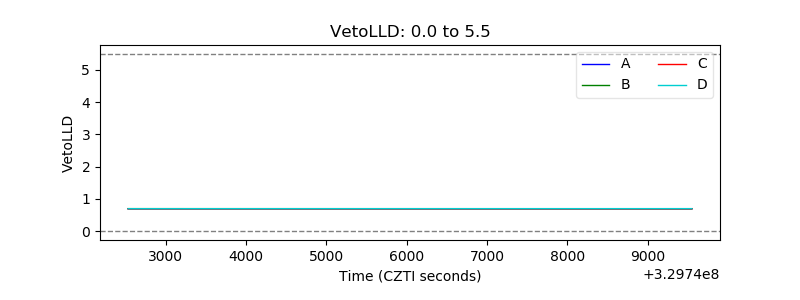 |
| Alpha Counter | 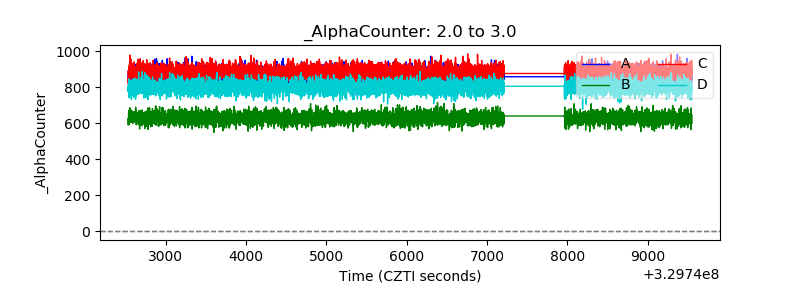 |
| _CPM_Rate |  |
| CZT Counter | 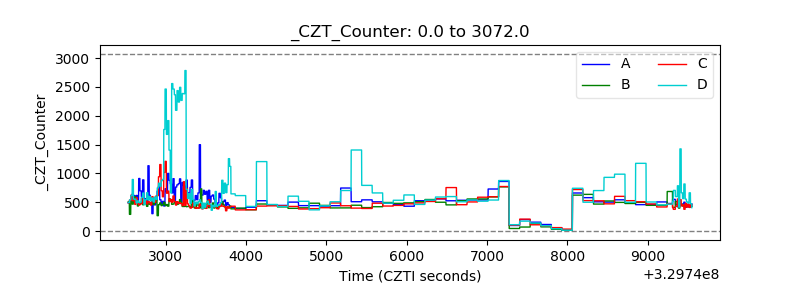 |
| +2.5 Volts monitor |  |
| +5 Volts monitor |  |
| _ROLL_ROT | 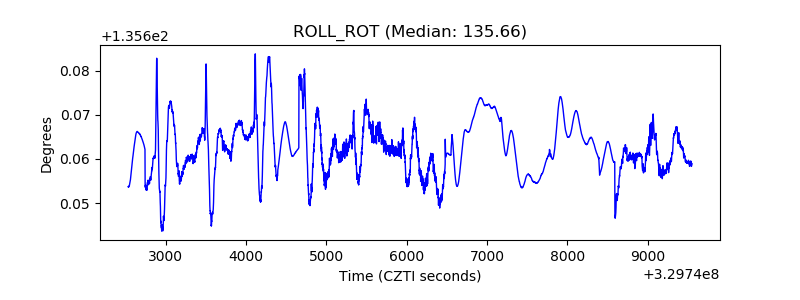 |
| _Roll_DEC | 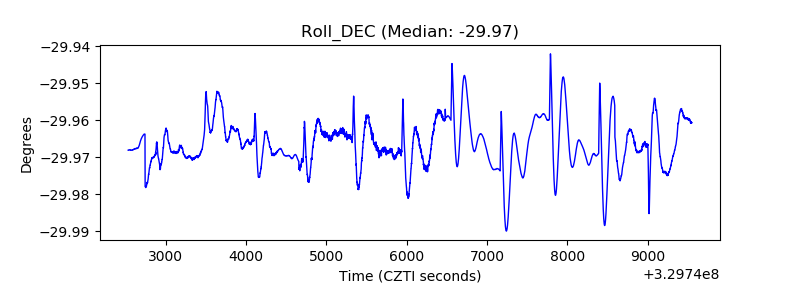 |
| _Roll_RA | 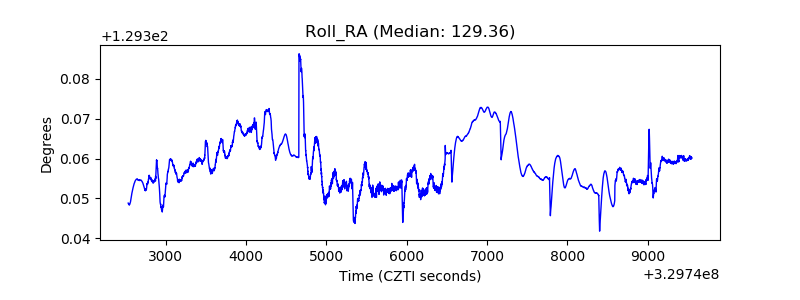 |
| Veto Counter | 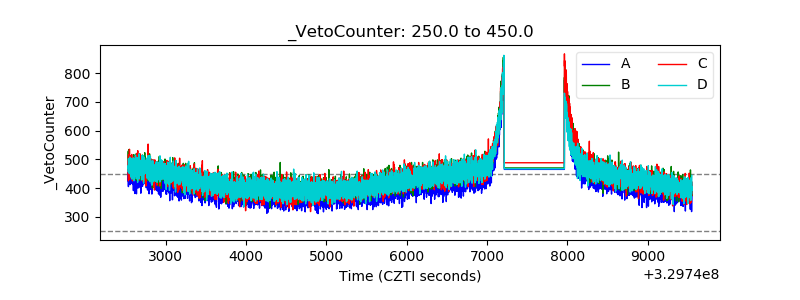 |