| Param | Original file | Final file |
|---|---|---|
| Filename | modeM0/AS1A09_085T02_9000003716_25465cztM0_level2.evt | modeM0/AS1A09_085T02_9000003716_25465cztM0_level2_quad_clean.evt |
| Size (bytes) | 554,696,640 | 98,853,120 |
| Size | 529.0 MB | 94.3 MB |
| Events in quadrant A | 3,369,280 | 647,072 |
| Events in quadrant B | 3,360,983 | 646,937 |
| Events in quadrant C | 3,442,042 | 621,613 |
| Events in quadrant D | 6,154,061 | 592,652 |
| Mode M9 | |||
|---|---|---|---|
| Quadrant | BADHDUFLAG | Total packets | Discarded packets |
| A | 0 | 3 | 0 |
| B | 0 | 3 | 0 |
| C | 0 | 3 | 0 |
| D | 0 | 3 | 0 |
| Mode M0 | |||
|---|---|---|---|
| Quadrant | BADHDUFLAG | Total packets | Discarded packets |
| A | 0 | 14442 | 0 |
| B | 0 | 14407 | 0 |
| C | 0 | 14729 | 0 |
| D | 0 | 23018 | 0 |
| Quadrant | Total seconds | Saturated seconds | Saturation percentage |
|---|---|---|---|
| A | 6965 | 97 | 1.392678% |
| B | 6965 | 120 | 1.722900% |
| C | 6966 | 139 | 1.995406% |
| D | 6966 | 554 | 7.952914% |
Noise dominated data is calculated using 1-second bins in cleaned event files. If a bin has >2000 counts, and if more than 50% of those come from <1% of pixels, then it is considered to be noise-dominated and hence unusable.
| Quadrant | # 1 sec bins | Bins with >0 counts | Bins with >2000 counts | High rate bins dominated by noise | Noise dominated (total time) | Noise dominated (detector-on time) | Marked lightcurve |
|---|---|---|---|---|---|---|---|
| A | 7290 | 6966 | 0 | 0 | 0.00% | 0.00% | 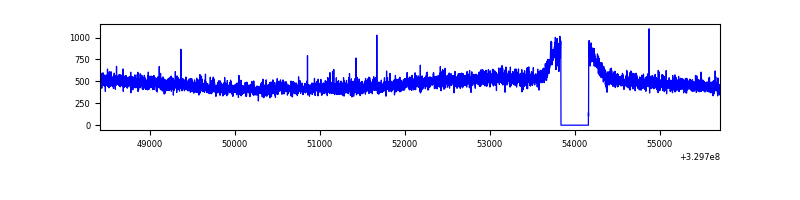 |
| B | 7290 | 6966 | 0 | 0 | 0.00% | 0.00% | 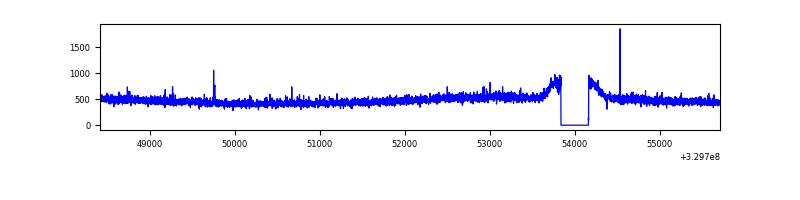 |
| C | 7291 | 6967 | 4 | 4 | 0.05% | 0.06% | 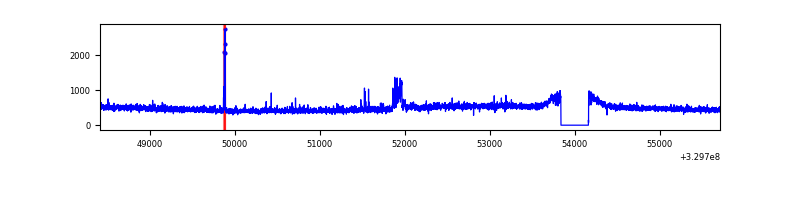 |
| D | 7291 | 6967 | 438 | 438 | 6.01% | 6.29% | 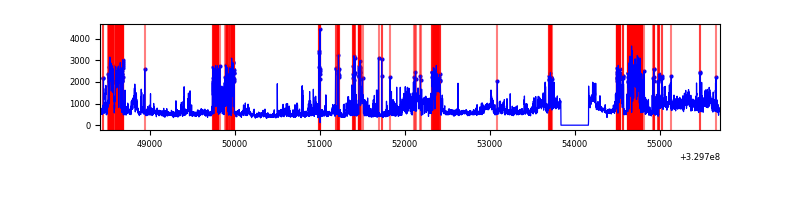 |
Top three noisy pixels from each quadrant. If the there are fewer than three noisy pixels in the level2.evt file, extra rows are filled as -1
| Pixel properties | Quadrant properties | ||||||
|---|---|---|---|---|---|---|---|
| Quadrant | DetID | PixID | Counts | Sigma | Mean | Median | Sigma |
| A | 13 | 254 | 10888 | 57.31 | 872 | 850 | 175.1 |
| A | 3 | 137 | 7972 | 40.66 | 872 | 850 | 175.1 |
| A | 0 | 226 | 7601 | 38.54 | 872 | 850 | 175.1 |
| B | 12 | 111 | 20205 | 117.82 | 856 | 835 | 164.4 |
| B | 11 | 111 | 18261 | 105.99 | 856 | 835 | 164.4 |
| B | 14 | 111 | 16635 | 96.1 | 856 | 835 | 164.4 |
| C | 14 | 238 | 131941 | 679.8 | 824 | 828 | 192.9 |
| C | 9 | 54 | 92650 | 476.08 | 824 | 828 | 192.9 |
| C | 13 | 61 | 5766 | 25.6 | 824 | 828 | 192.9 |
| D | 1 | 52 | 1068296 | 5373.05 | 823 | 800 | 198.7 |
| D | 7 | 238 | 1038034 | 5220.73 | 823 | 800 | 198.7 |
| D | 8 | 195 | 602222 | 3027.15 | 823 | 800 | 198.7 |
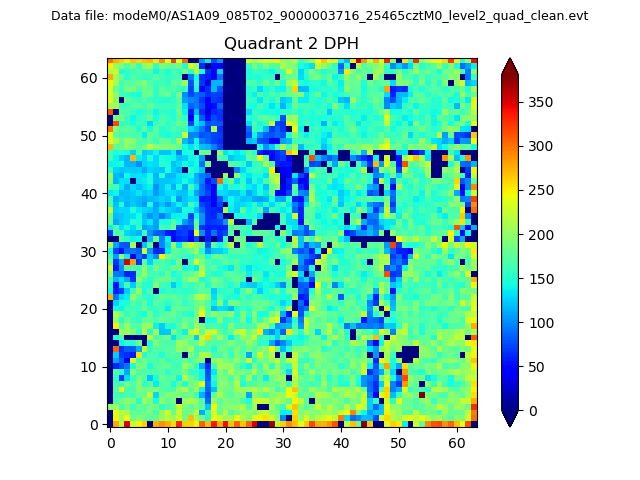
Histogram calculated using DETX and DETY for each event in the final _common_clean file
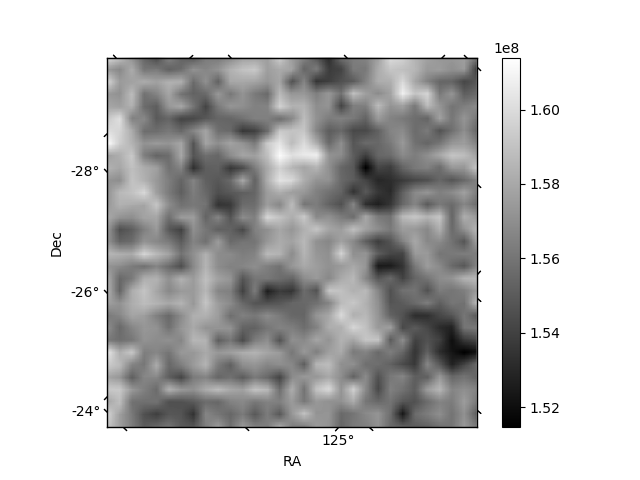
| Quadrant A | 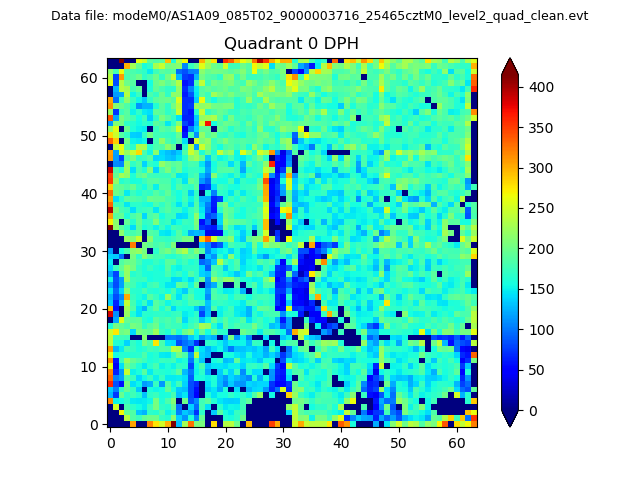 |
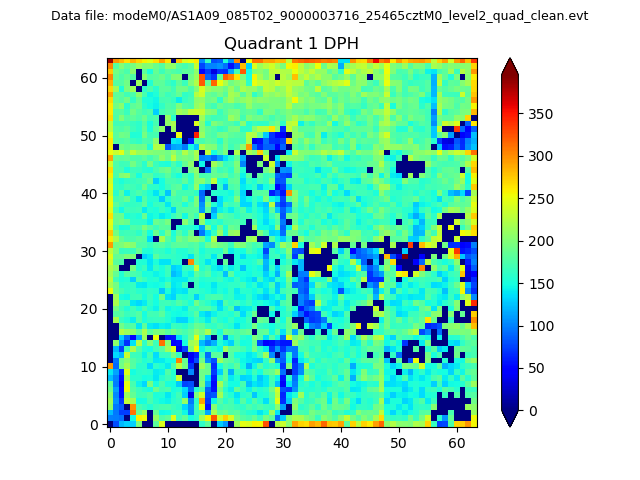 |
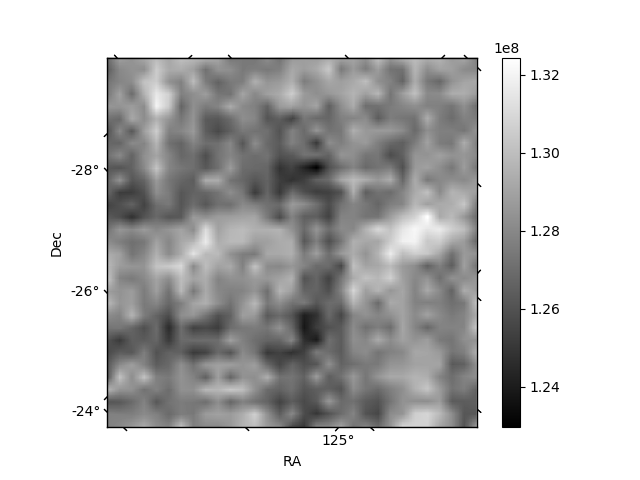
Quadrant B |
|---|---|---|---|
| Quadrant D | 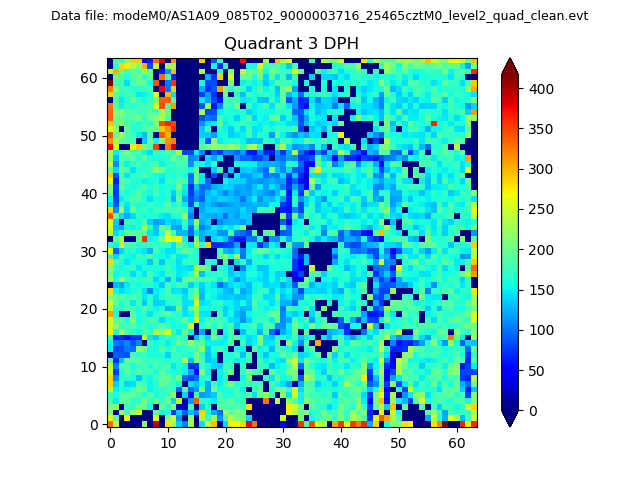 |
 |
Quadrant C |
| Plot type | Count rate plots | Images |
|---|---|---|
| Comparison with Poisson distribution Blue bars denote a histogram of data divided into 1 sec bins. Red curve is a Poisson curve with rate = median count rate of data. |
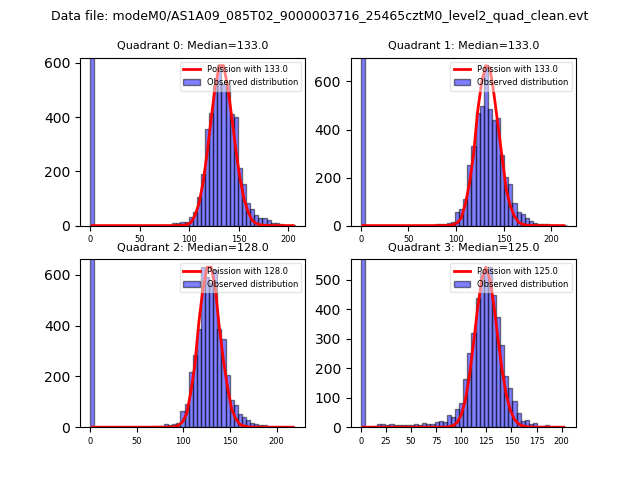 |
 |
| Quadrant-wise count rates Data is divided into 100 sec bins |
 |
|
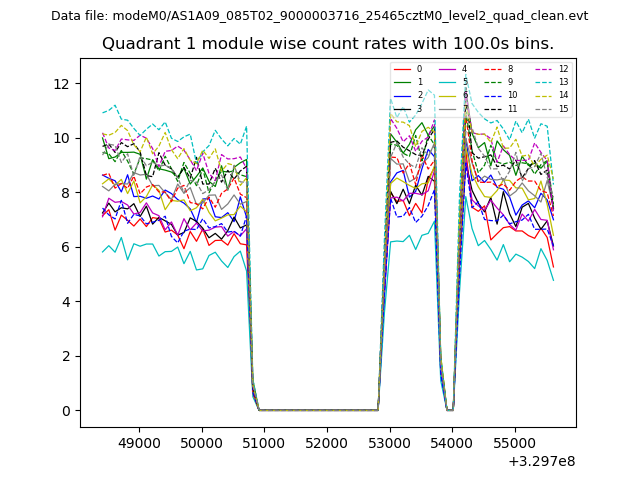
| Module-wise count rates for Quadrant A Data is divided into 100 sec bins |
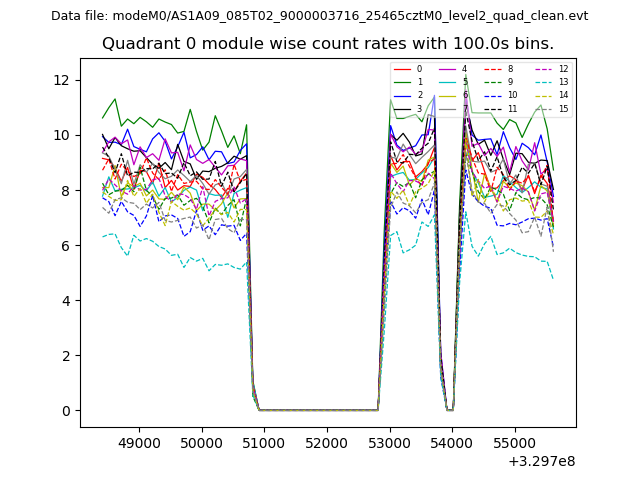 |
 |
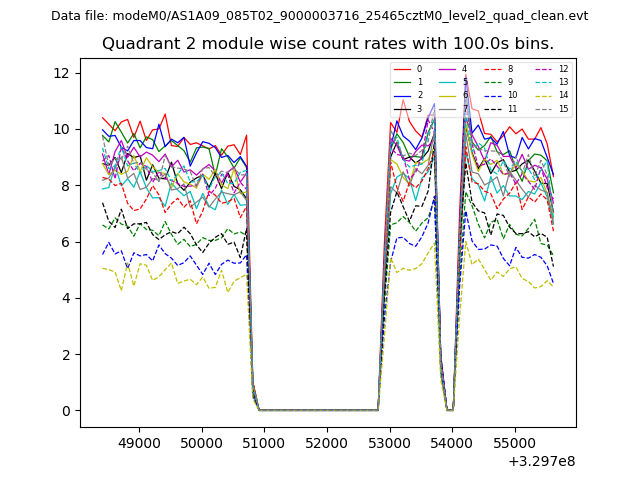
| Module-wise count rates for Quadrant B Data is divided into 100 sec bins |
 |
 |
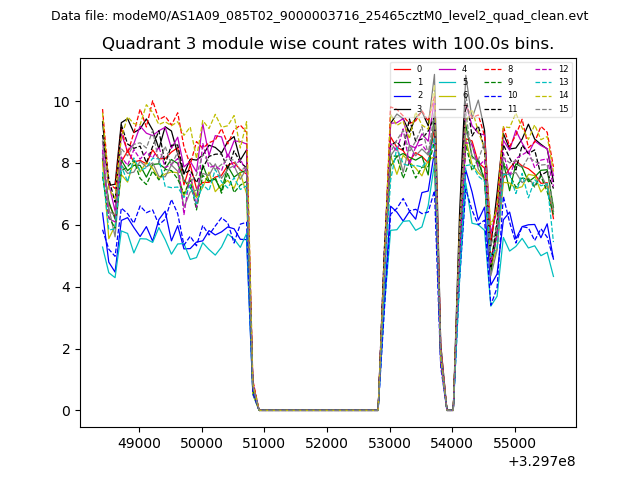
| Module-wise count rates for Quadrant C Data is divided into 100 sec bins |
 |
 |
| Module-wise count rates for Quadrant D Data is divided into 100 sec bins |
 |
 |
| Parameter | Plot |
|---|---|
| CZT HV Monitor | 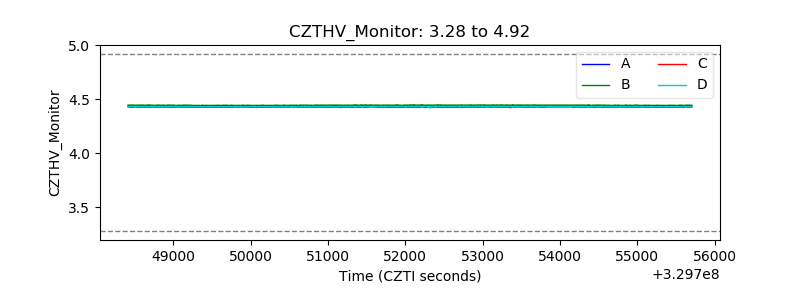 |
| D_VDD | 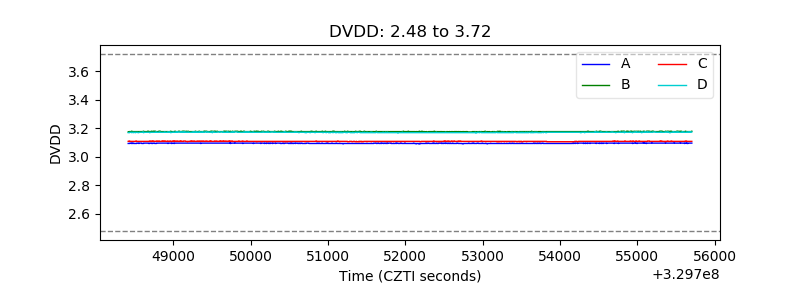 |
| Temperature 1 | 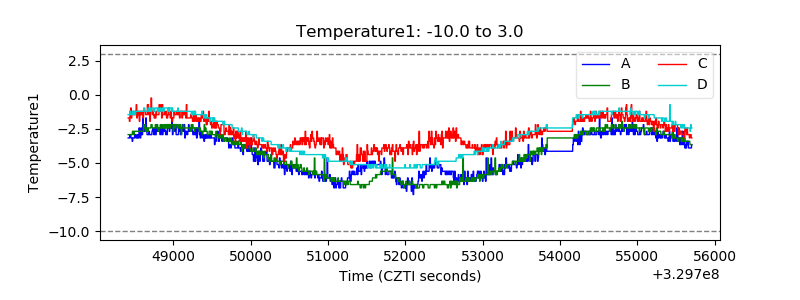 |
| Veto HV Monitor | 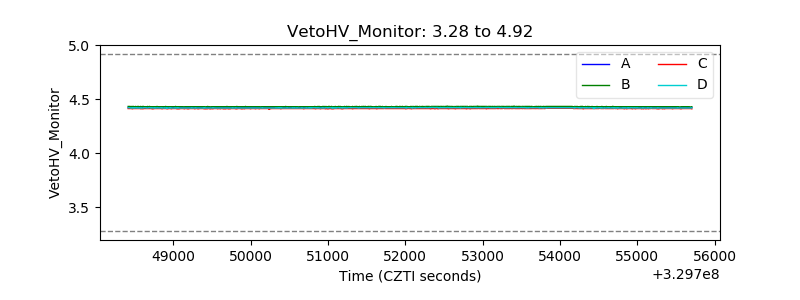 |
| Veto LLD | 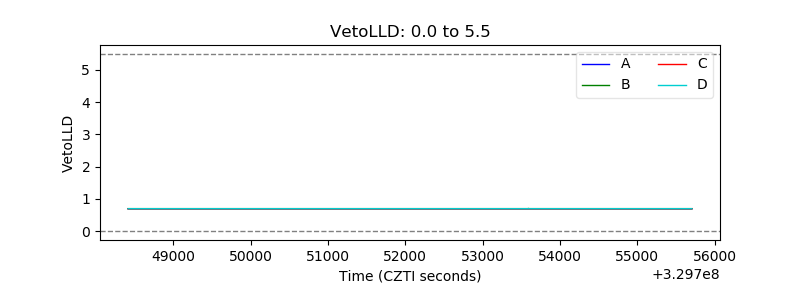 |
| Alpha Counter | 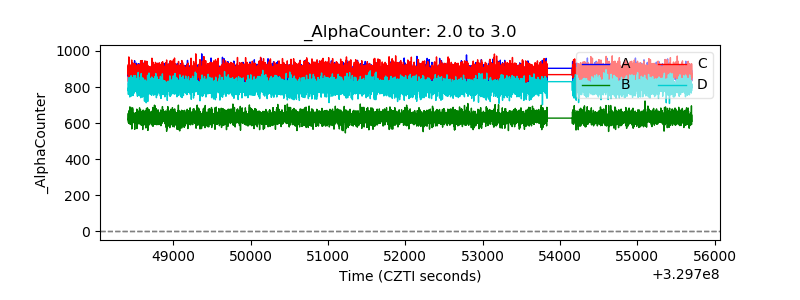 |
| _CPM_Rate | 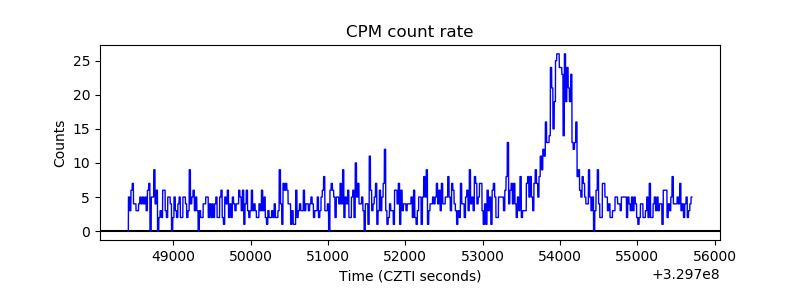 |
| CZT Counter | 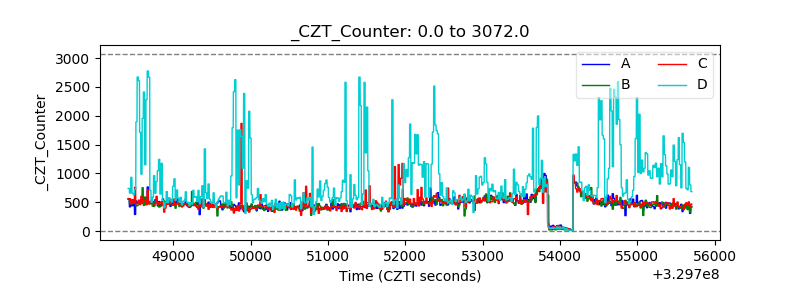 |
| +2.5 Volts monitor |  |
| +5 Volts monitor |  |
| _ROLL_ROT | 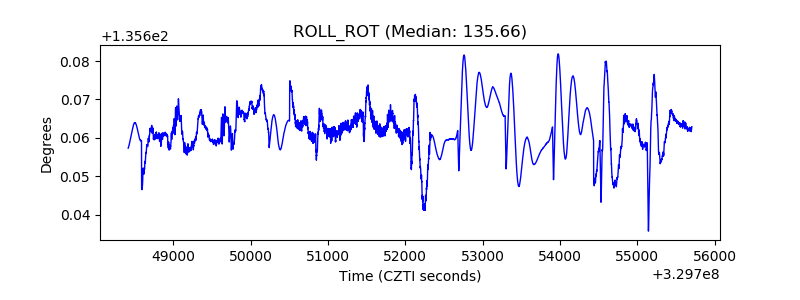 |
| _Roll_DEC | 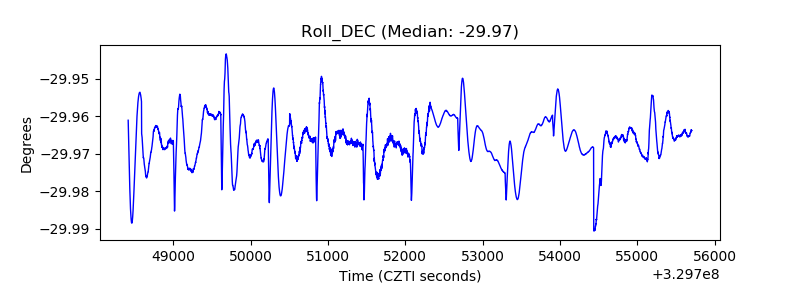 |
| _Roll_RA | 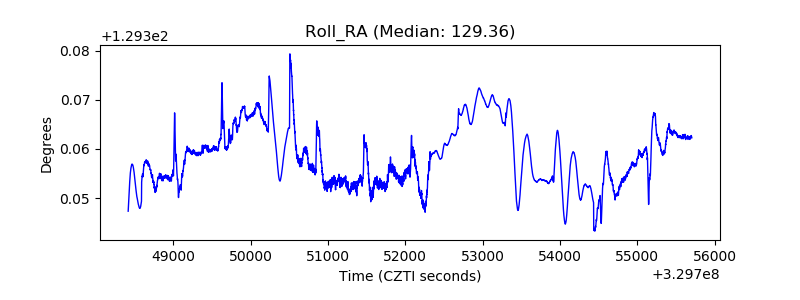 |
| Veto Counter | 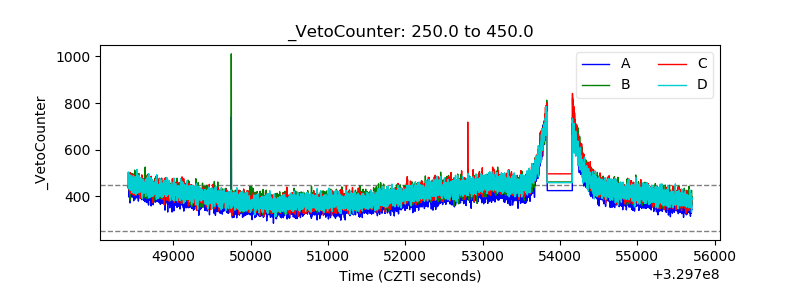 |