| Param | Original file | Final file |
|---|---|---|
| Filename | modeM0/AS1A09_085T02_9000003716_25466cztM0_level2.evt | modeM0/AS1A09_085T02_9000003716_25466cztM0_level2_quad_clean.evt |
| Size (bytes) | 514,624,320 | 92,551,680 |
| Size | 490.8 MB | 88.3 MB |
| Events in quadrant A | 3,170,607 | 602,489 |
| Events in quadrant B | 3,180,955 | 604,608 |
| Events in quadrant C | 3,165,128 | 580,146 |
| Events in quadrant D | 5,613,851 | 548,106 |
| Mode M9 | |||
|---|---|---|---|
| Quadrant | BADHDUFLAG | Total packets | Discarded packets |
| A | 0 | 3 | 0 |
| B | 0 | 3 | 0 |
| C | 0 | 3 | 0 |
| D | 0 | 3 | 0 |
| Mode M0 | |||
|---|---|---|---|
| Quadrant | BADHDUFLAG | Total packets | Discarded packets |
| A | 0 | 13798 | 0 |
| B | 0 | 13796 | 0 |
| C | 0 | 13815 | 0 |
| D | 0 | 21214 | 0 |
| Quadrant | Total seconds | Saturated seconds | Saturation percentage |
|---|---|---|---|
| A | 6703 | 67 | 0.999552% |
| B | 6704 | 88 | 1.312649% |
| C | 6704 | 78 | 1.163484% |
| D | 6704 | 458 | 6.831742% |
Noise dominated data is calculated using 1-second bins in cleaned event files. If a bin has >2000 counts, and if more than 50% of those come from <1% of pixels, then it is considered to be noise-dominated and hence unusable.
| Quadrant | # 1 sec bins | Bins with >0 counts | Bins with >2000 counts | High rate bins dominated by noise | Noise dominated (total time) | Noise dominated (detector-on time) | Marked lightcurve |
|---|---|---|---|---|---|---|---|
| A | 6958 | 6704 | 0 | 0 | 0.00% | 0.00% | 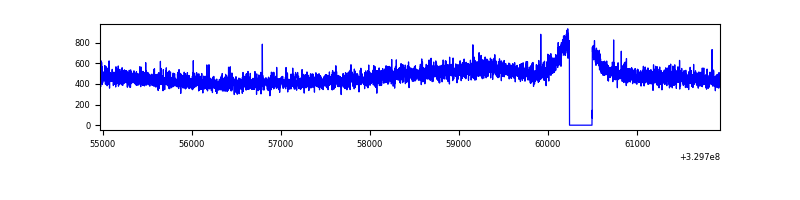 |
| B | 6959 | 6705 | 0 | 0 | 0.00% | 0.00% | 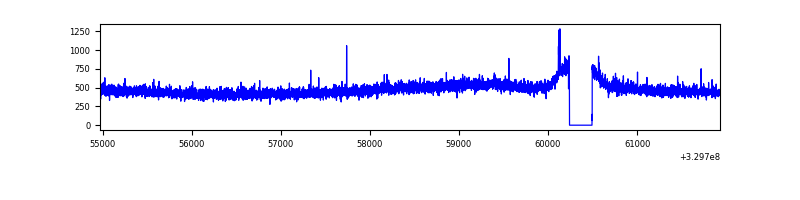 |
| C | 6959 | 6705 | 0 | 0 | 0.00% | 0.00% | 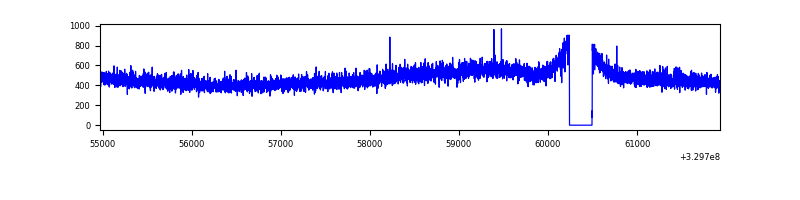 |
| D | 6959 | 6705 | 370 | 370 | 5.32% | 5.52% | 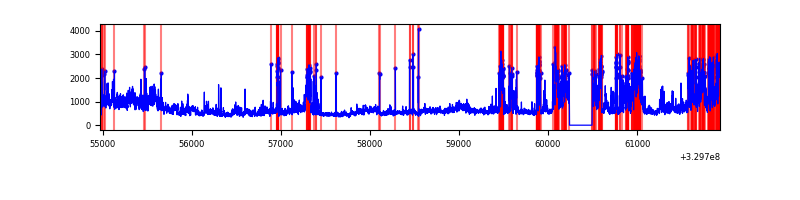 |
Top three noisy pixels from each quadrant. If the there are fewer than three noisy pixels in the level2.evt file, extra rows are filled as -1
| Pixel properties | Quadrant properties | ||||||
|---|---|---|---|---|---|---|---|
| Quadrant | DetID | PixID | Counts | Sigma | Mean | Median | Sigma |
| A | 13 | 254 | 10640 | 59.24 | 821 | 803 | 166.0 |
| A | 3 | 137 | 7674 | 41.38 | 821 | 803 | 166.0 |
| A | 0 | 226 | 7246 | 38.8 | 821 | 803 | 166.0 |
| B | 12 | 111 | 19300 | 118.11 | 807 | 785 | 156.8 |
| B | 11 | 111 | 17171 | 104.53 | 807 | 785 | 156.8 |
| B | 14 | 111 | 15409 | 93.29 | 807 | 785 | 156.8 |
| C | 14 | 238 | 125056 | 677.52 | 777 | 782 | 183.4 |
| C | 13 | 61 | 5365 | 24.99 | 777 | 782 | 183.4 |
| C | 8 | 128 | 3510 | 14.87 | 777 | 782 | 183.4 |
| D | 1 | 52 | 1129039 | 5931.86 | 774 | 753 | 190.2 |
| D | 8 | 195 | 843084 | 4428.48 | 774 | 753 | 190.2 |
| D | 7 | 238 | 653233 | 3430.35 | 774 | 753 | 190.2 |
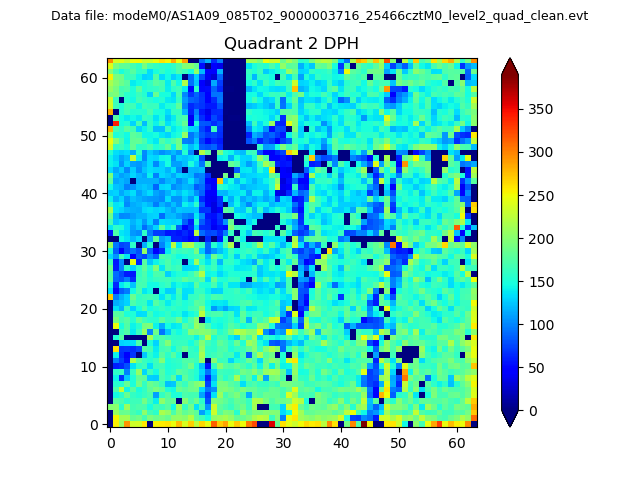
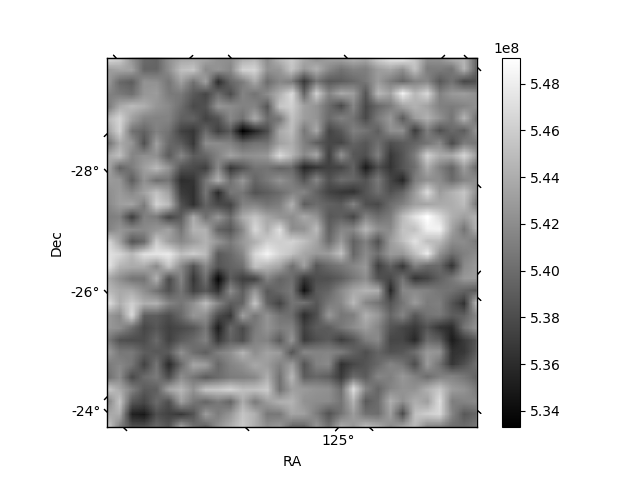
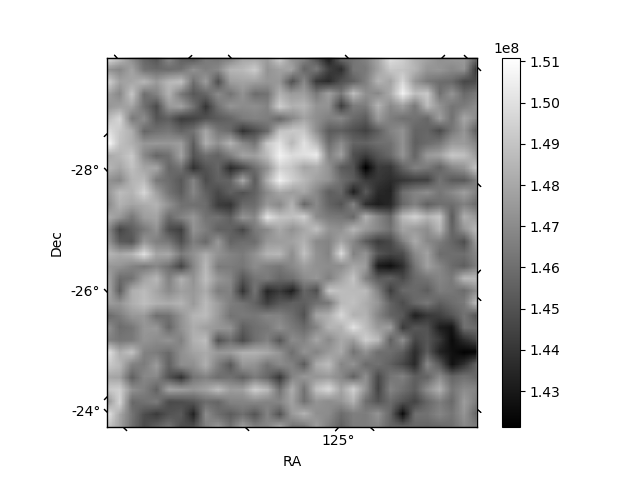
Histogram calculated using DETX and DETY for each event in the final _common_clean file
| Quadrant A | 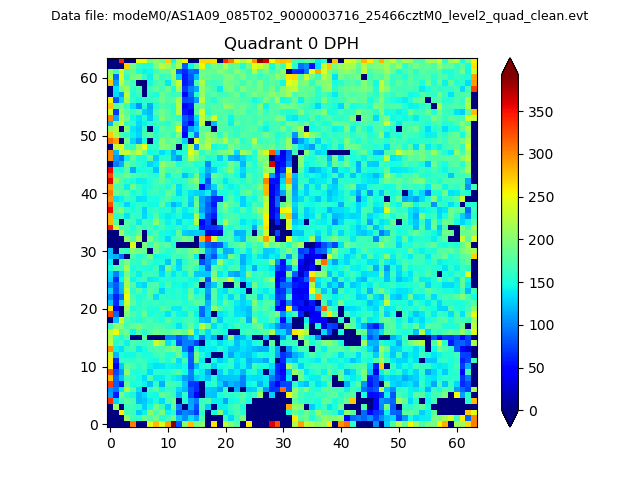 |
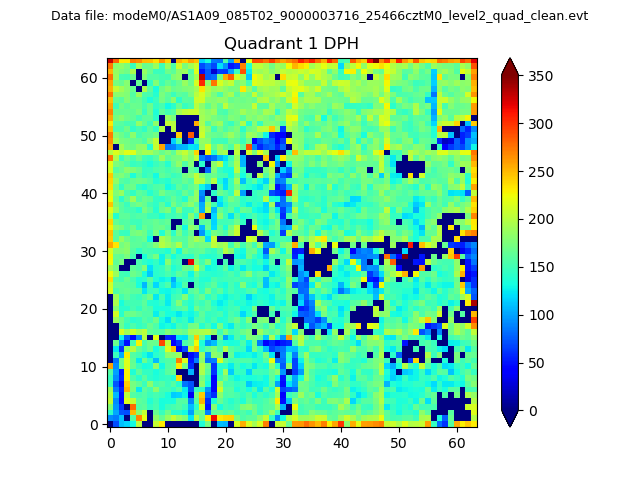 |
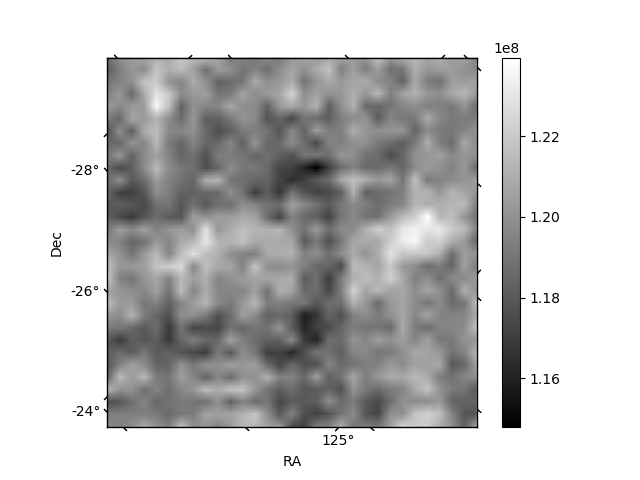
Quadrant B |
|---|---|---|---|
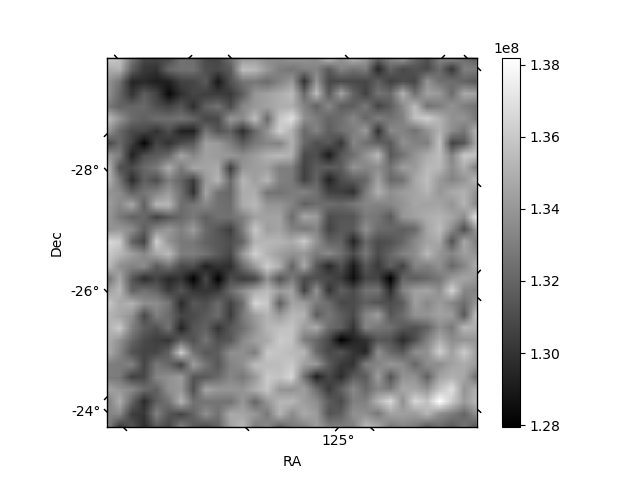
| Quadrant D | 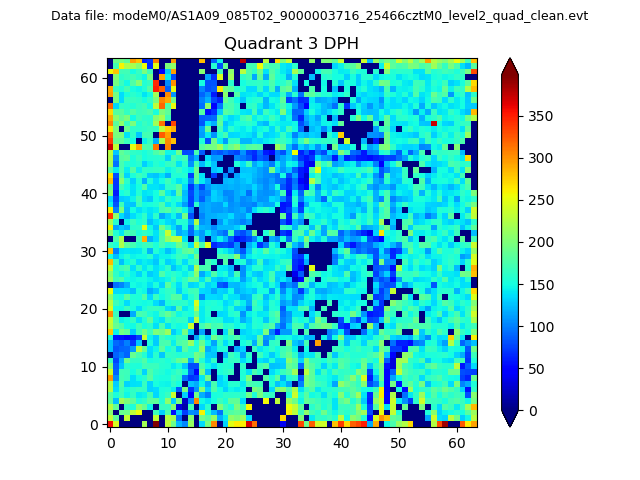 |
 |
Quadrant C |
| Plot type | Count rate plots | Images |
|---|---|---|
| Comparison with Poisson distribution Blue bars denote a histogram of data divided into 1 sec bins. Red curve is a Poisson curve with rate = median count rate of data. |
 |
 |
| Quadrant-wise count rates Data is divided into 100 sec bins |
 |
|
| Module-wise count rates for Quadrant A Data is divided into 100 sec bins |
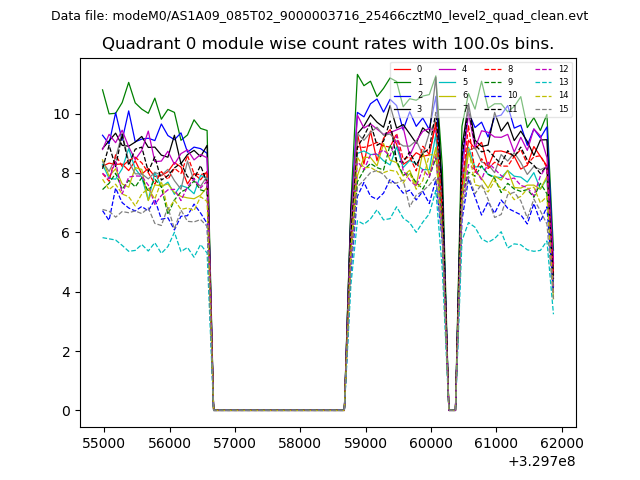 |
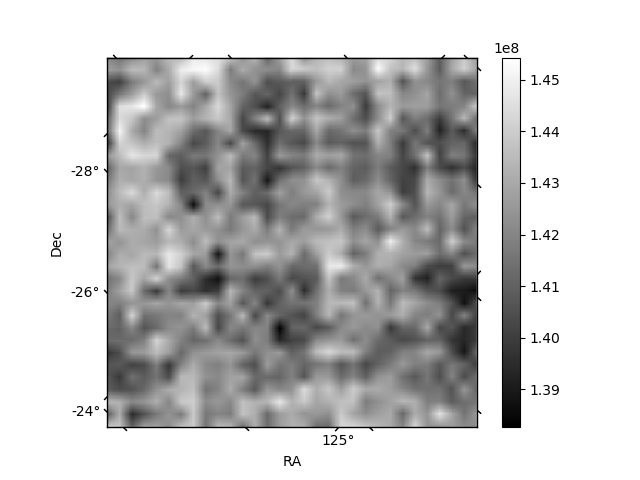 |
| Module-wise count rates for Quadrant B Data is divided into 100 sec bins |
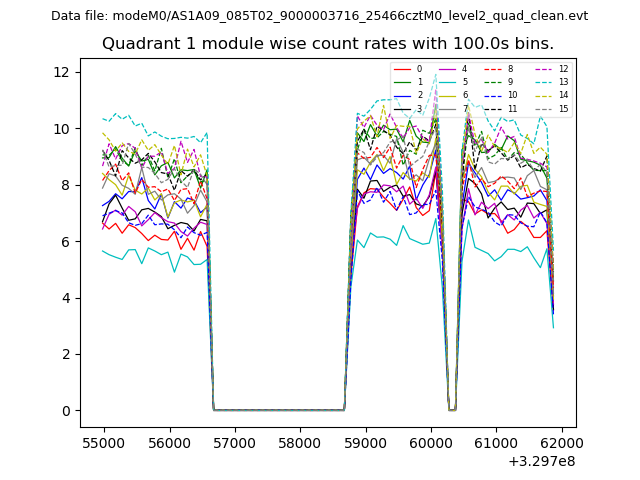 |
 |
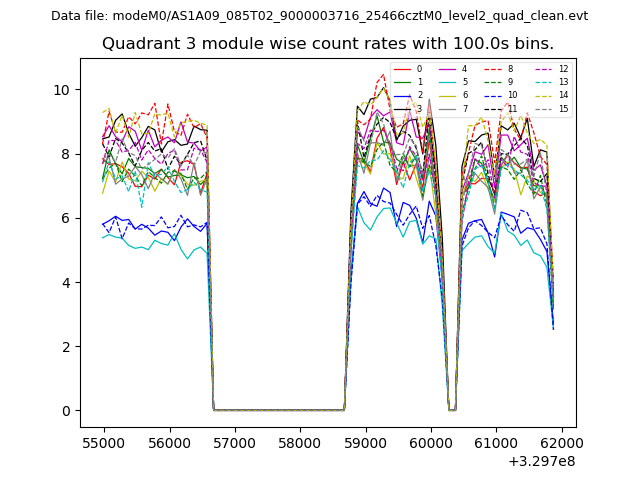
| Module-wise count rates for Quadrant C Data is divided into 100 sec bins |
 |
 |
| Module-wise count rates for Quadrant D Data is divided into 100 sec bins |
 |
 |
| Parameter | Plot |
|---|---|
| CZT HV Monitor | 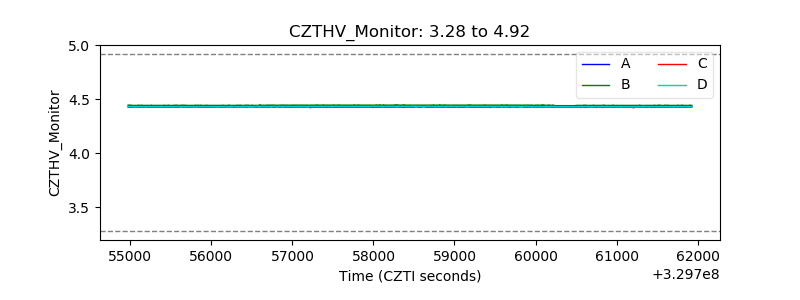 |
| D_VDD | 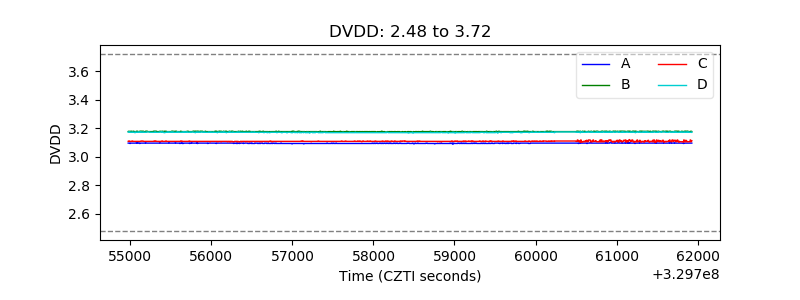 |
| Temperature 1 | 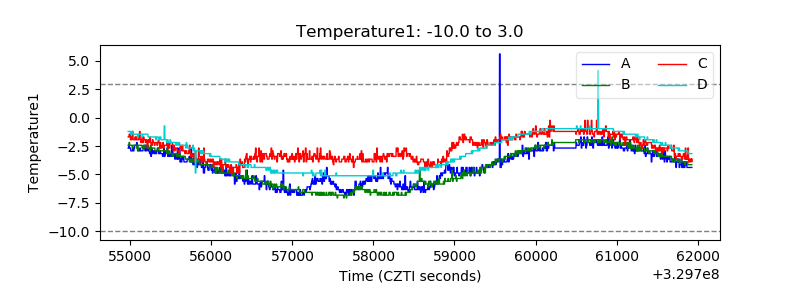 |
| Veto HV Monitor | 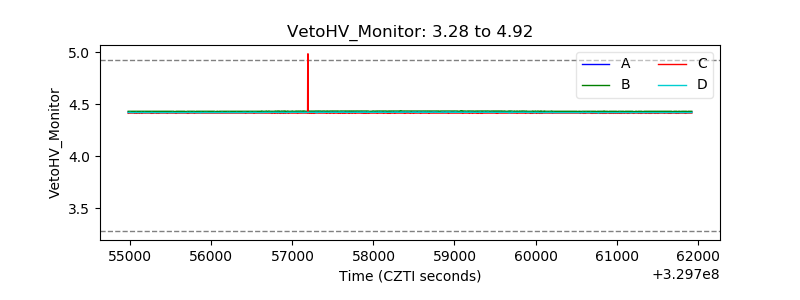 |
| Veto LLD | 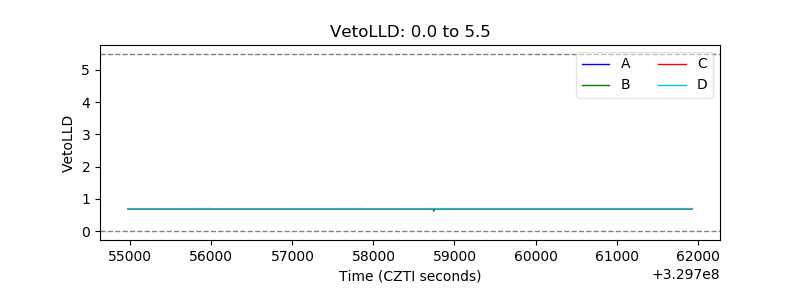 |
| Alpha Counter | 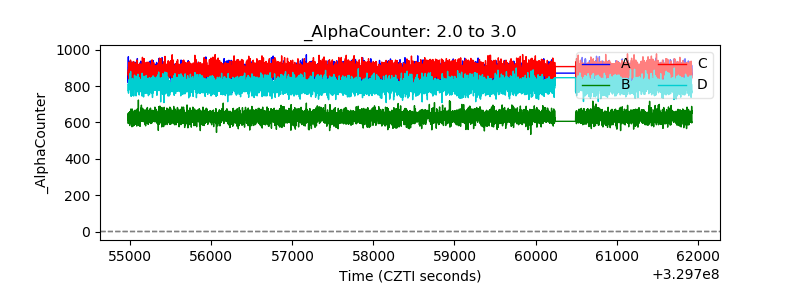 |
| _CPM_Rate | 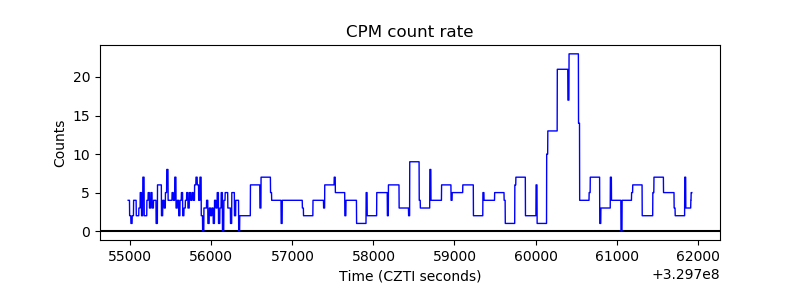 |
| CZT Counter | 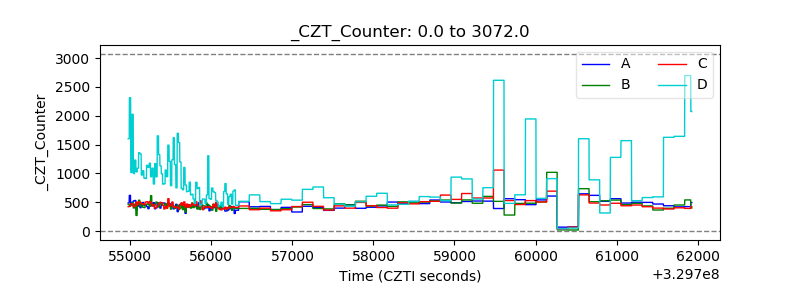 |
| +2.5 Volts monitor | 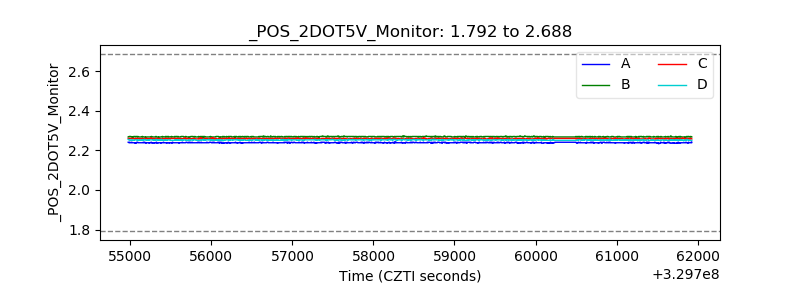 |
| +5 Volts monitor |  |
| _ROLL_ROT | 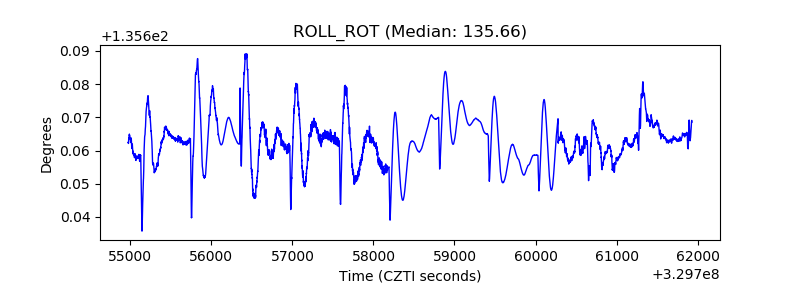 |
| _Roll_DEC | 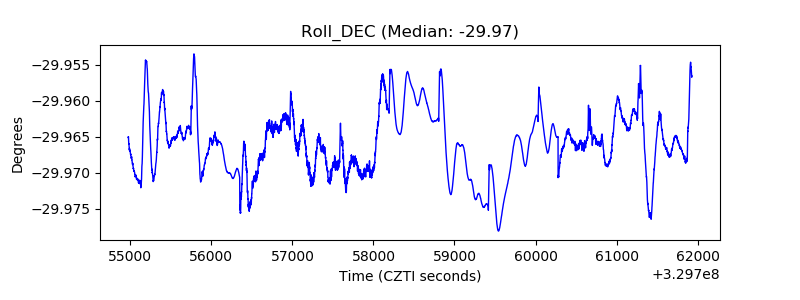 |
| _Roll_RA | 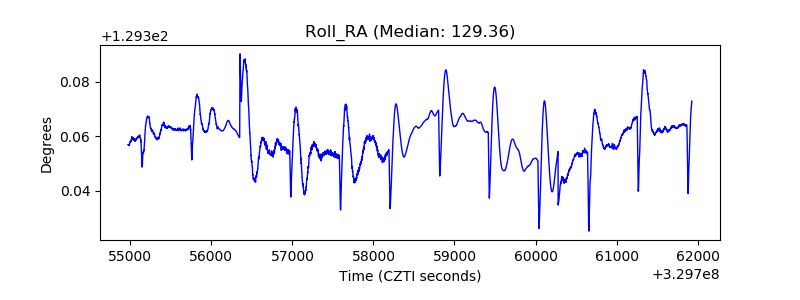 |
| Veto Counter | 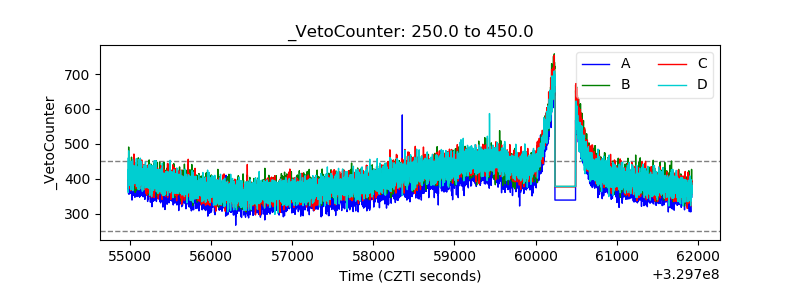 |