| Param | Original file | Final file |
|---|---|---|
| Filename | modeM0/AS1A09_085T02_9000003716_25467cztM0_level2.evt | modeM0/AS1A09_085T02_9000003716_25467cztM0_level2_quad_clean.evt |
| Size (bytes) | 544,449,600 | 101,214,720 |
| Size | 519.2 MB | 96.5 MB |
| Events in quadrant A | 3,465,554 | 660,974 |
| Events in quadrant B | 3,442,875 | 662,671 |
| Events in quadrant C | 3,416,334 | 634,170 |
| Events in quadrant D | 5,666,634 | 597,195 |
| Mode M9 | |||
|---|---|---|---|
| Quadrant | BADHDUFLAG | Total packets | Discarded packets |
| A | 0 | 4 | 0 |
| B | 0 | 4 | 0 |
| C | 0 | 4 | 0 |
| D | 0 | 4 | 0 |
| Mode M0 | |||
|---|---|---|---|
| Quadrant | BADHDUFLAG | Total packets | Discarded packets |
| A | 0 | 15103 | 0 |
| B | 0 | 14936 | 0 |
| C | 0 | 14962 | 0 |
| D | 0 | 21743 | 0 |
| Quadrant | Total seconds | Saturated seconds | Saturation percentage |
|---|---|---|---|
| A | 7322 | 39 | 0.532641% |
| B | 7322 | 40 | 0.546299% |
| C | 7323 | 64 | 0.873959% |
| D | 7323 | 491 | 6.704902% |
Noise dominated data is calculated using 1-second bins in cleaned event files. If a bin has >2000 counts, and if more than 50% of those come from <1% of pixels, then it is considered to be noise-dominated and hence unusable.
| Quadrant | # 1 sec bins | Bins with >0 counts | Bins with >2000 counts | High rate bins dominated by noise | Noise dominated (total time) | Noise dominated (detector-on time) | Marked lightcurve |
|---|---|---|---|---|---|---|---|
| A | 7747 | 7323 | 1 | 1 | 0.01% | 0.01% | 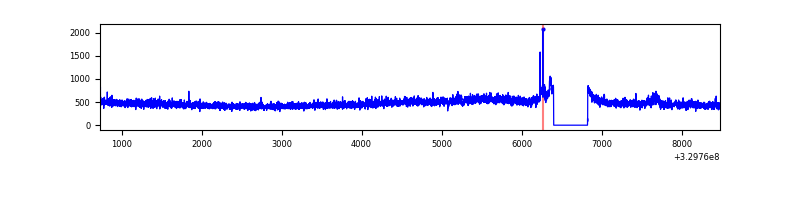 |
| B | 7747 | 7323 | 0 | 0 | 0.00% | 0.00% | 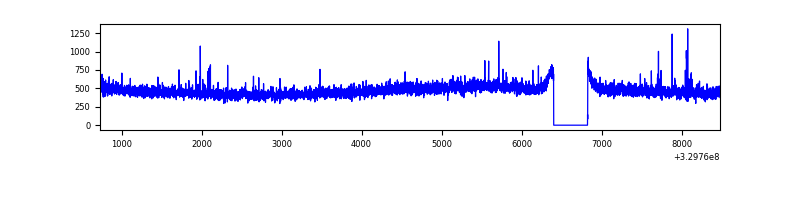 |
| C | 7748 | 7324 | 1 | 1 | 0.01% | 0.01% | 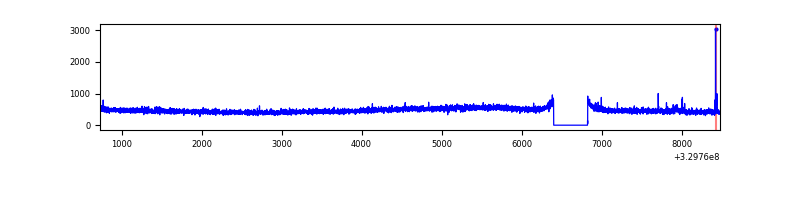 |
| D | 7748 | 7324 | 484 | 484 | 6.25% | 6.61% | 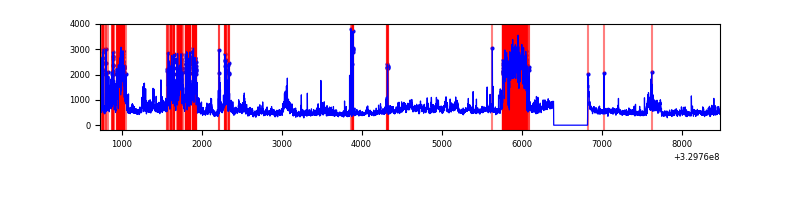 |
Top three noisy pixels from each quadrant. If the there are fewer than three noisy pixels in the level2.evt file, extra rows are filled as -1
| Pixel properties | Quadrant properties | ||||||
|---|---|---|---|---|---|---|---|
| Quadrant | DetID | PixID | Counts | Sigma | Mean | Median | Sigma |
| A | 6 | 16 | 69474 | 384.73 | 881 | 864 | 178.3 |
| A | 13 | 254 | 10855 | 56.02 | 881 | 864 | 178.3 |
| A | 3 | 137 | 7923 | 39.58 | 881 | 864 | 178.3 |
| B | 12 | 111 | 20445 | 117.43 | 867 | 845 | 166.9 |
| B | 11 | 111 | 18659 | 106.73 | 867 | 845 | 166.9 |
| B | 14 | 111 | 16364 | 92.98 | 867 | 845 | 166.9 |
| C | 14 | 238 | 133289 | 674.17 | 832 | 837 | 196.5 |
| C | 2 | 16 | 19655 | 95.78 | 832 | 837 | 196.5 |
| C | 8 | 128 | 10441 | 48.88 | 832 | 837 | 196.5 |
| D | 8 | 195 | 897840 | 4447.26 | 824 | 800 | 201.7 |
| D | 1 | 52 | 841150 | 4166.21 | 824 | 800 | 201.7 |
| D | 7 | 238 | 718830 | 3559.78 | 824 | 800 | 201.7 |
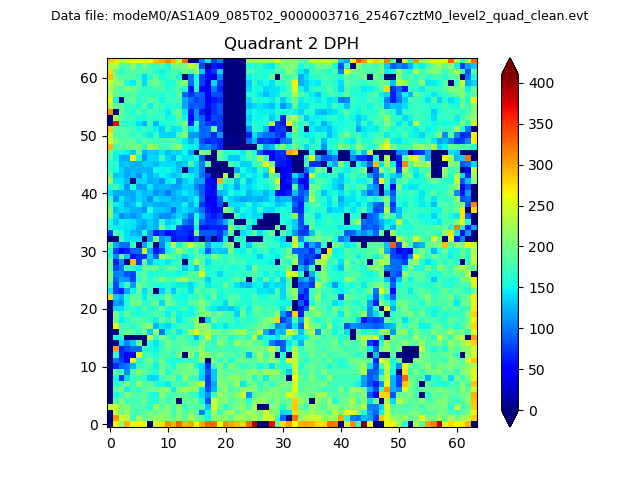
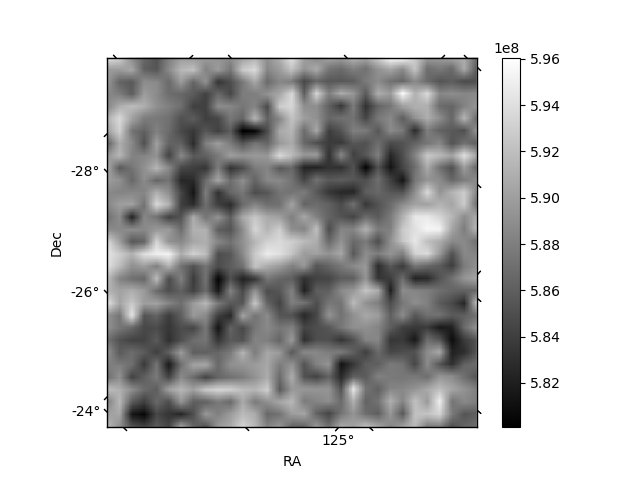
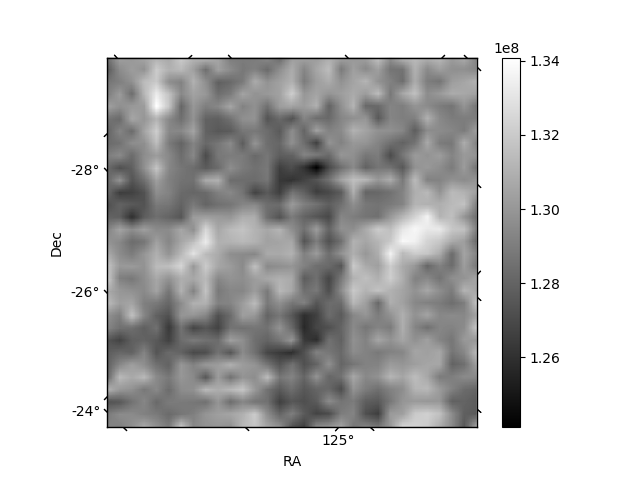
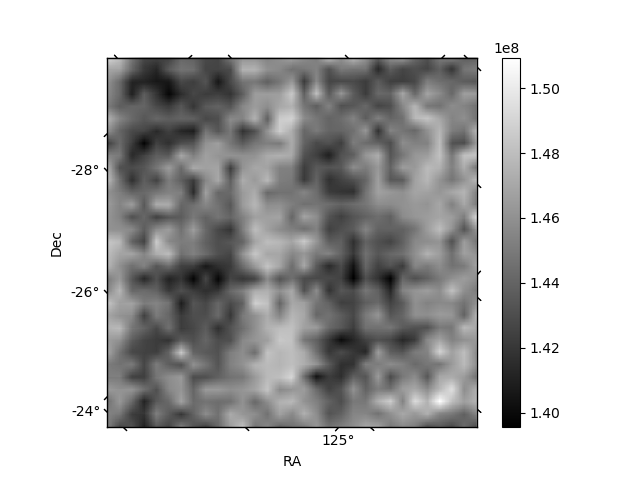
Histogram calculated using DETX and DETY for each event in the final _common_clean file
| Quadrant A | 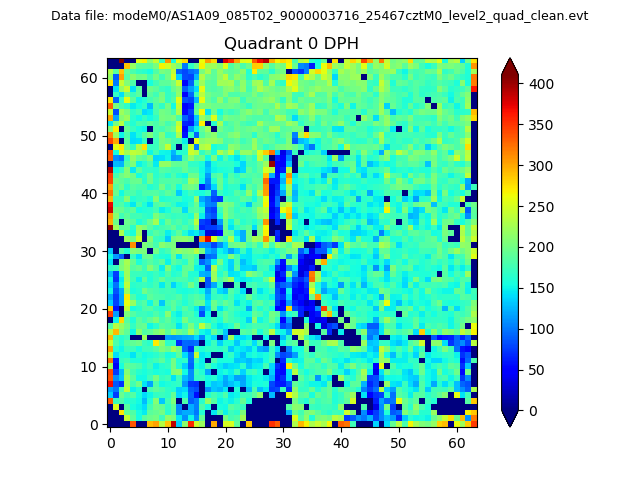 |
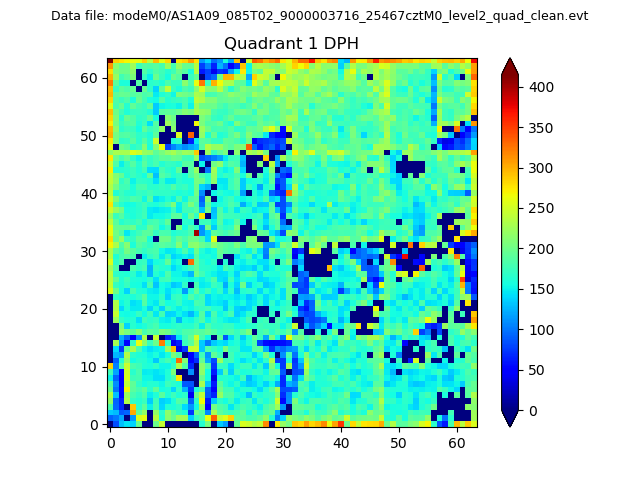 |
Quadrant B |
|---|---|---|---|
| Quadrant D | 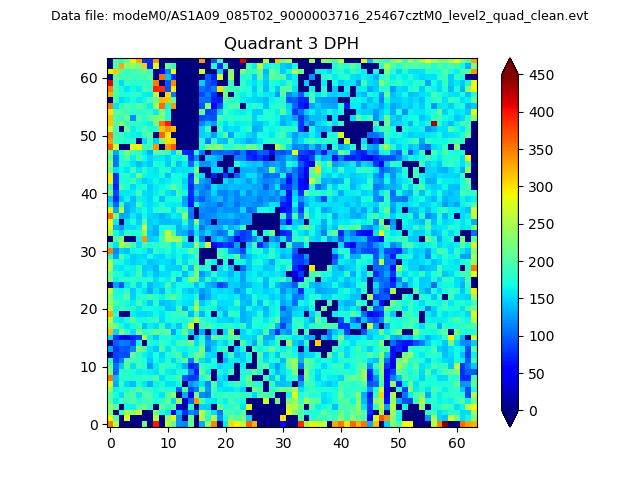 |
 |
Quadrant C |
| Plot type | Count rate plots | Images |
|---|---|---|
| Comparison with Poisson distribution Blue bars denote a histogram of data divided into 1 sec bins. Red curve is a Poisson curve with rate = median count rate of data. |
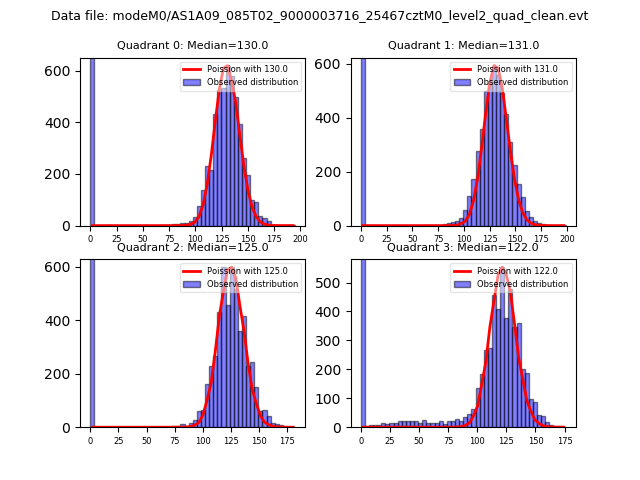 |
 |
| Quadrant-wise count rates Data is divided into 100 sec bins |
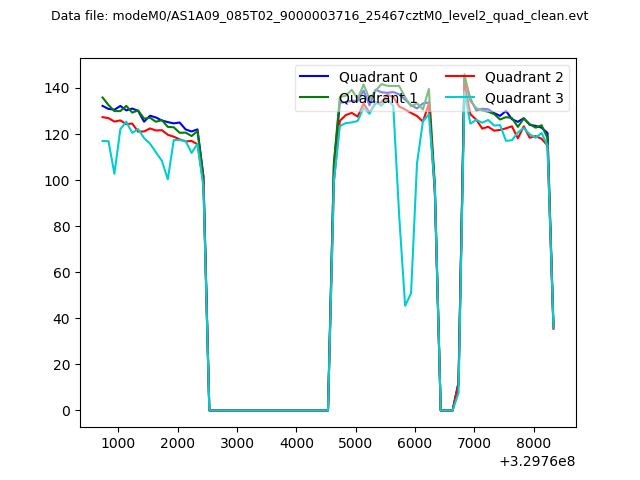 |
|
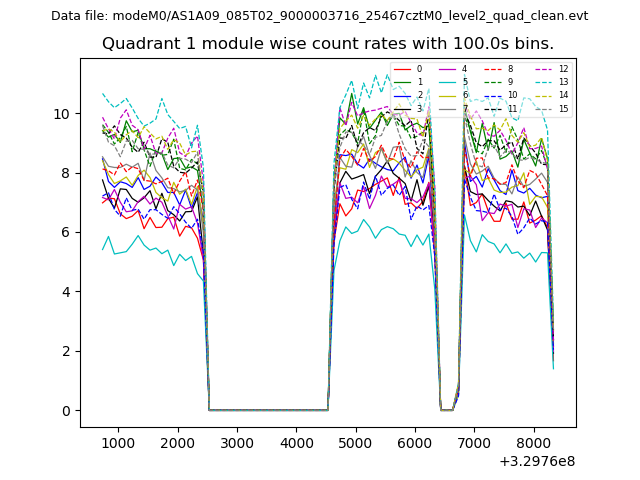
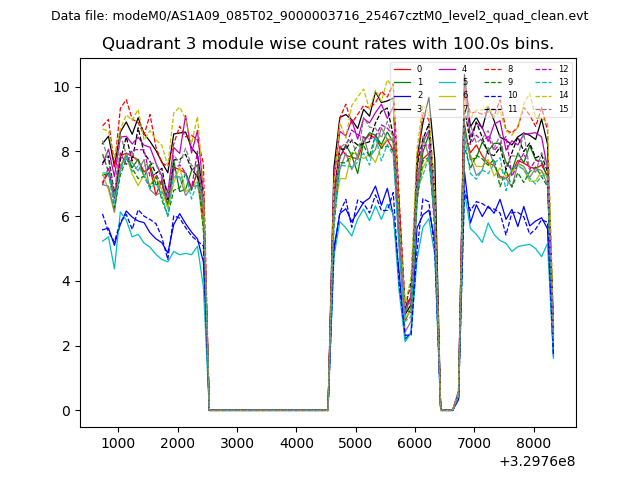
| Module-wise count rates for Quadrant A Data is divided into 100 sec bins |
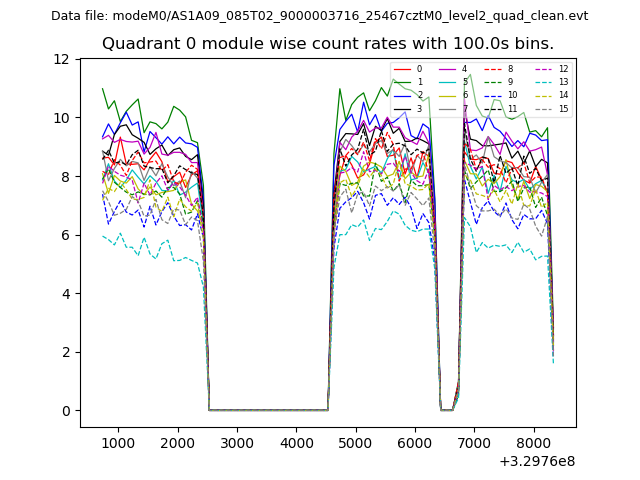 |
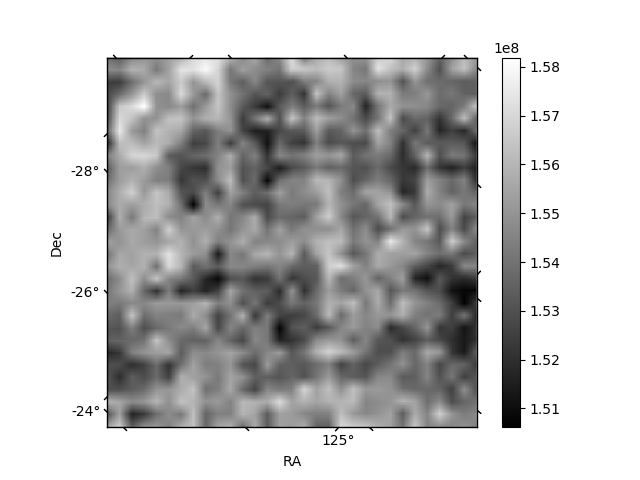 |
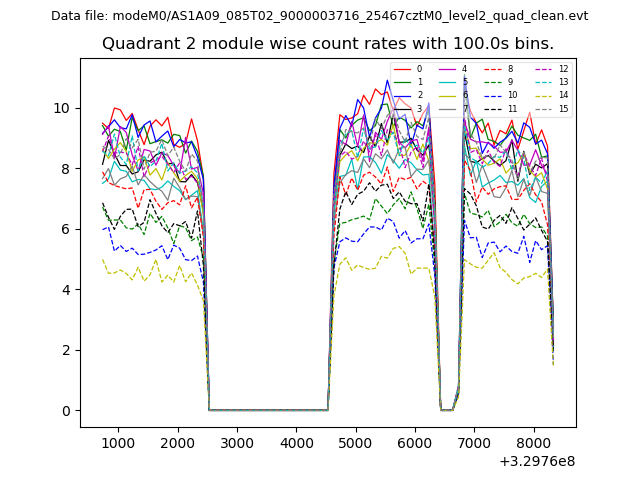
| Module-wise count rates for Quadrant B Data is divided into 100 sec bins |
 |
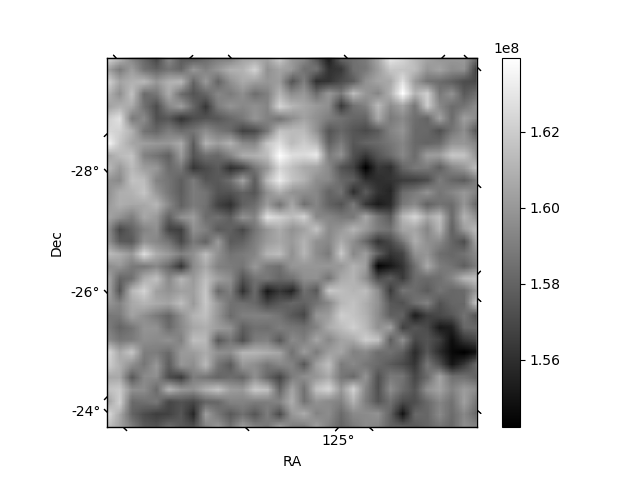 |
| Module-wise count rates for Quadrant C Data is divided into 100 sec bins |
 |
 |
| Module-wise count rates for Quadrant D Data is divided into 100 sec bins |
 |
 |
| Parameter | Plot |
|---|---|
| CZT HV Monitor | 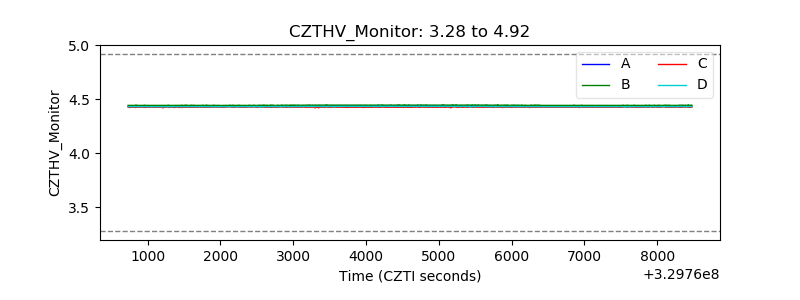 |
| D_VDD | 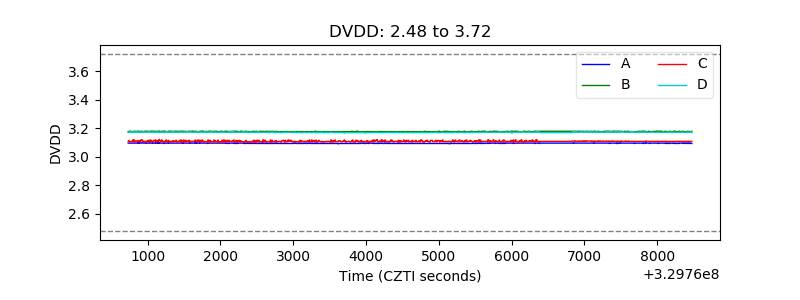 |
| Temperature 1 | 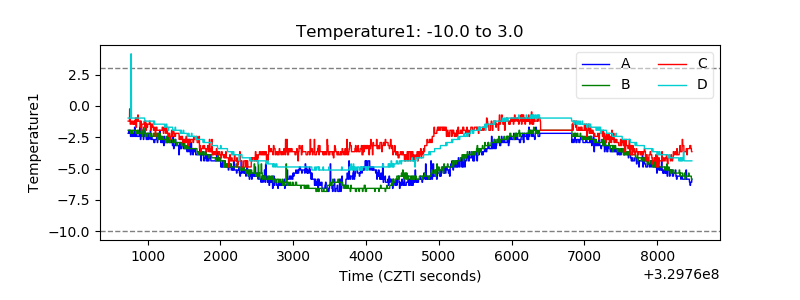 |
| Veto HV Monitor | 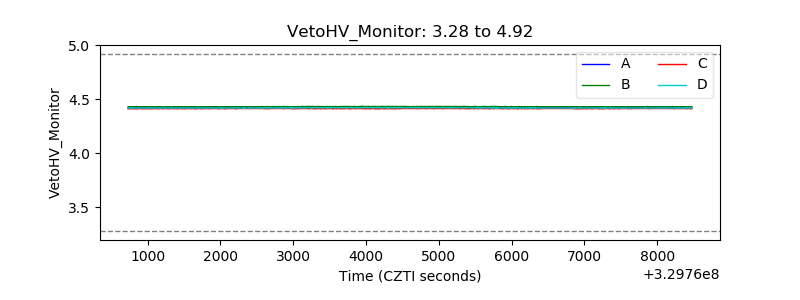 |
| Veto LLD | 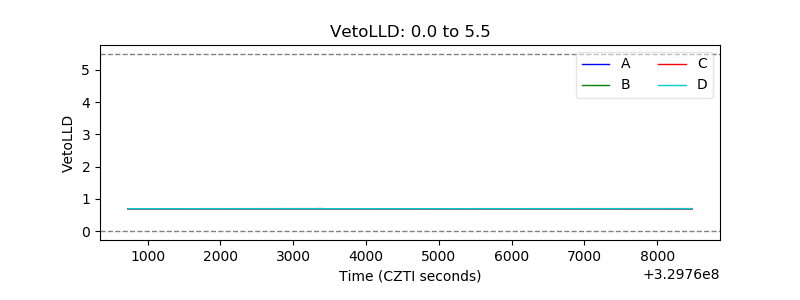 |
| Alpha Counter | 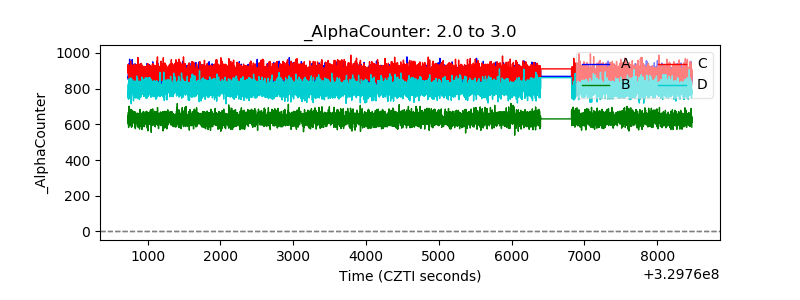 |
| _CPM_Rate |  |
| CZT Counter | 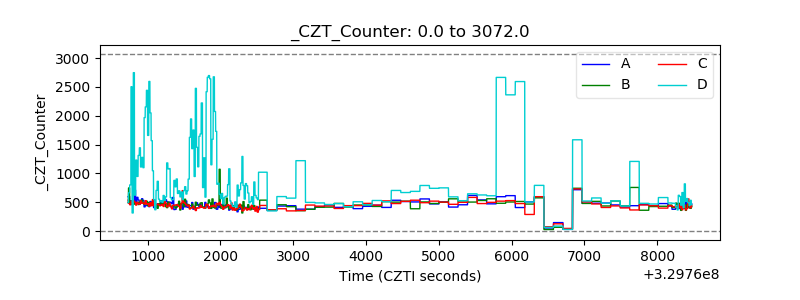 |
| +2.5 Volts monitor |  |
| +5 Volts monitor |  |
| _ROLL_ROT | 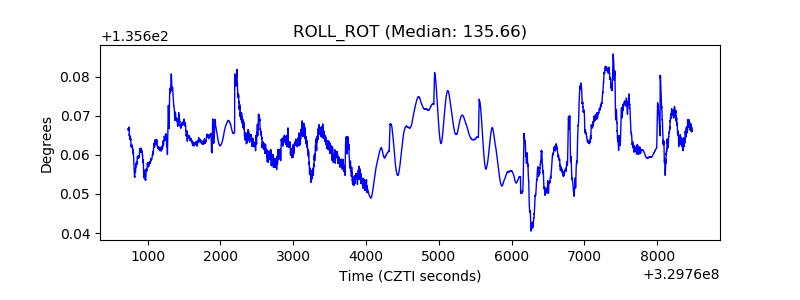 |
| _Roll_DEC | 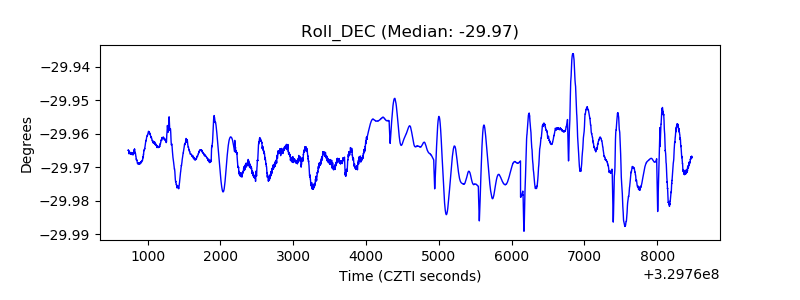 |
| _Roll_RA | 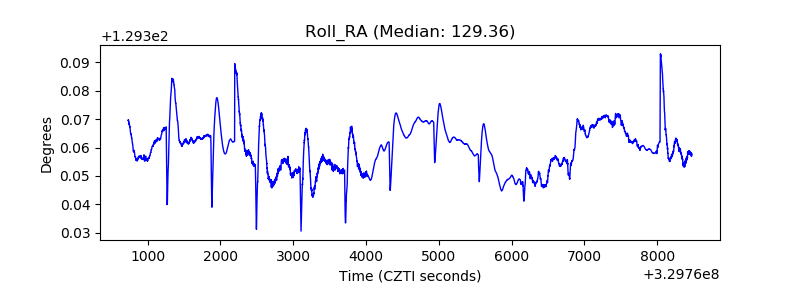 |
| Veto Counter | 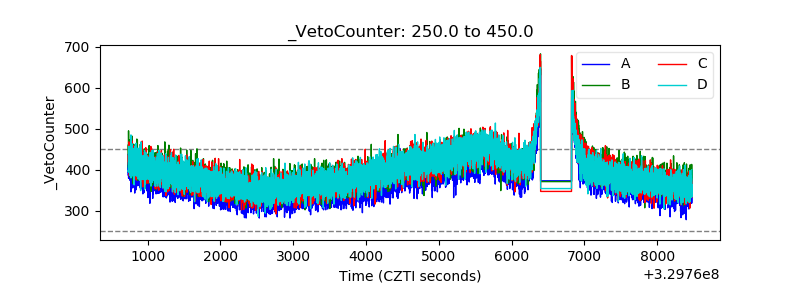 |