| Param | Original file | Final file |
|---|---|---|
| Filename | modeM0/AS1A09_085T02_9000003716_25469cztM0_level2.evt | modeM0/AS1A09_085T02_9000003716_25469cztM0_level2_quad_clean.evt |
| Size (bytes) | 893,252,160 | 148,092,480 |
| Size | 851.9 MB | 141.2 MB |
| Events in quadrant A | 5,761,062 | 940,024 |
| Events in quadrant B | 5,811,069 | 946,077 |
| Events in quadrant C | 5,840,870 | 905,316 |
| Events in quadrant D | 8,810,147 | 846,466 |
| Mode M9 | |||
|---|---|---|---|
| Quadrant | BADHDUFLAG | Total packets | Discarded packets |
| A | 0 | 14 | 0 |
| B | 0 | 14 | 0 |
| C | 0 | 14 | 0 |
| D | 0 | 14 | 0 |
| Mode M0 | |||
|---|---|---|---|
| Quadrant | BADHDUFLAG | Total packets | Discarded packets |
| A | 0 | 24995 | 0 |
| B | 0 | 25085 | 0 |
| C | 0 | 25299 | 0 |
| D | 0 | 34413 | 0 |
| Quadrant | Total seconds | Saturated seconds | Saturation percentage |
|---|---|---|---|
| A | 12251 | 50 | 0.408130% |
| B | 12252 | 71 | 0.579497% |
| C | 12252 | 120 | 0.979432% |
| D | 12252 | 878 | 7.166177% |
Noise dominated data is calculated using 1-second bins in cleaned event files. If a bin has >2000 counts, and if more than 50% of those come from <1% of pixels, then it is considered to be noise-dominated and hence unusable.
| Quadrant | # 1 sec bins | Bins with >0 counts | Bins with >2000 counts | High rate bins dominated by noise | Noise dominated (total time) | Noise dominated (detector-on time) | Marked lightcurve |
|---|---|---|---|---|---|---|---|
| A | 13586 | 12253 | 0 | 0 | 0.00% | 0.00% | 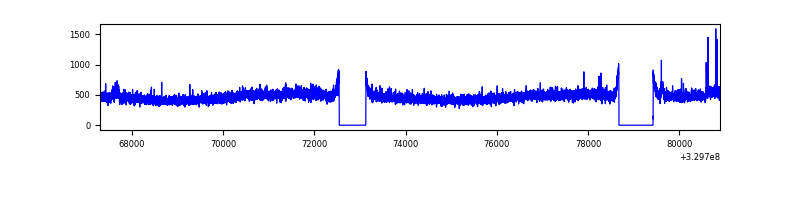 |
| B | 13587 | 12254 | 4 | 4 | 0.03% | 0.03% | 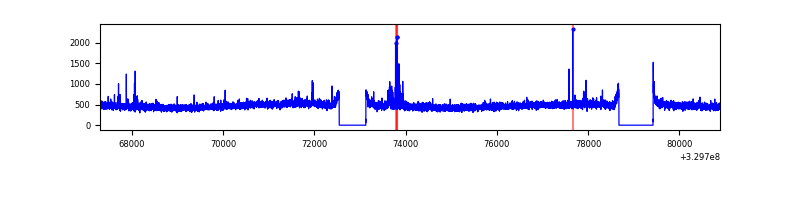 |
| C | 13587 | 12254 | 11 | 11 | 0.08% | 0.09% | 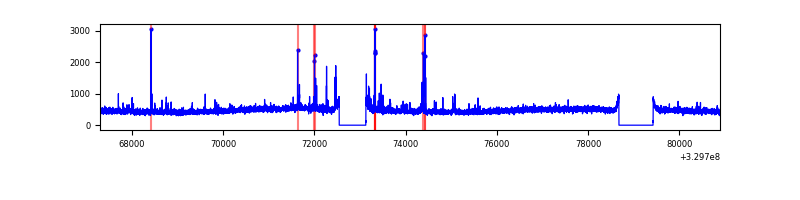 |
| D | 13587 | 12254 | 760 | 760 | 5.59% | 6.20% | 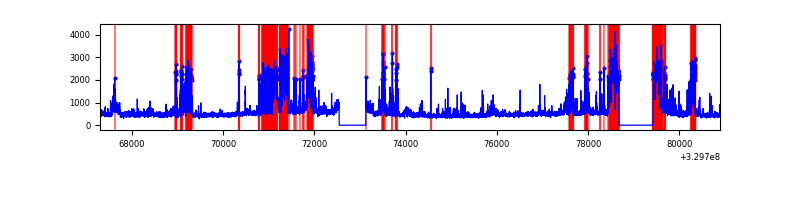 |
Top three noisy pixels from each quadrant. If the there are fewer than three noisy pixels in the level2.evt file, extra rows are filled as -1
| Pixel properties | Quadrant properties | ||||||
|---|---|---|---|---|---|---|---|
| Quadrant | DetID | PixID | Counts | Sigma | Mean | Median | Sigma |
| A | 6 | 16 | 87629 | 291.77 | 1472 | 1439 | 295.4 |
| A | 13 | 254 | 17585 | 54.66 | 1472 | 1439 | 295.4 |
| A | 3 | 137 | 13861 | 42.05 | 1472 | 1439 | 295.4 |
| B | 3 | 112 | 37012 | 127.81 | 1456 | 1421 | 278.5 |
| B | 12 | 111 | 35217 | 121.37 | 1456 | 1421 | 278.5 |
| B | 11 | 111 | 31606 | 108.4 | 1456 | 1421 | 278.5 |
| C | 14 | 238 | 222454 | 675.58 | 1395 | 1405 | 327.2 |
| C | 2 | 16 | 176066 | 533.81 | 1395 | 1405 | 327.2 |
| C | 3 | 233 | 12263 | 33.18 | 1395 | 1405 | 327.2 |
| D | 7 | 238 | 1700852 | 5033.96 | 1380 | 1342 | 337.6 |
| D | 2 | 82 | 792574 | 2343.63 | 1380 | 1342 | 337.6 |
| D | 8 | 195 | 521663 | 1541.19 | 1380 | 1342 | 337.6 |
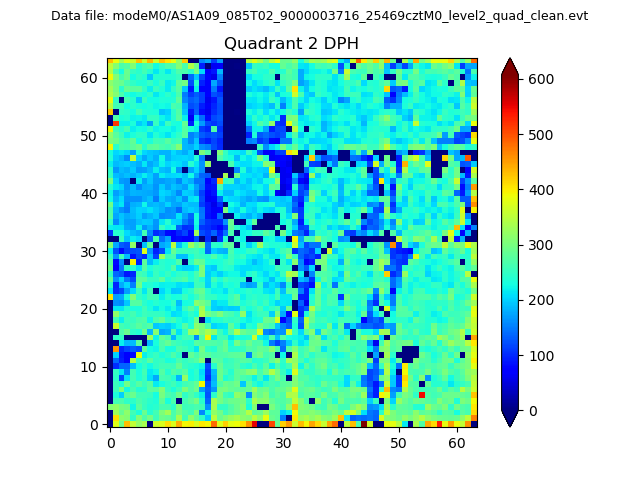
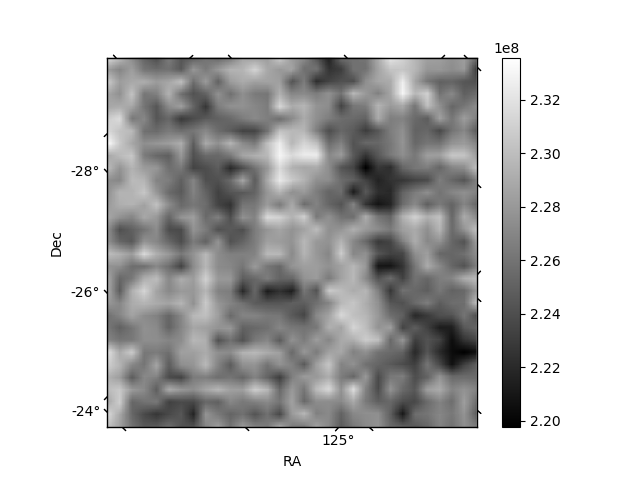
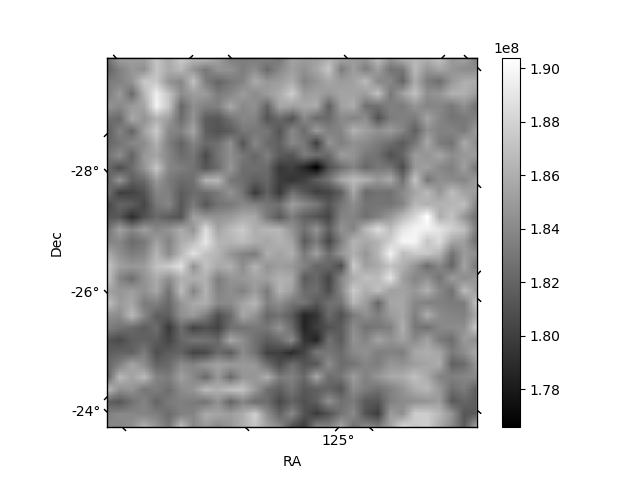
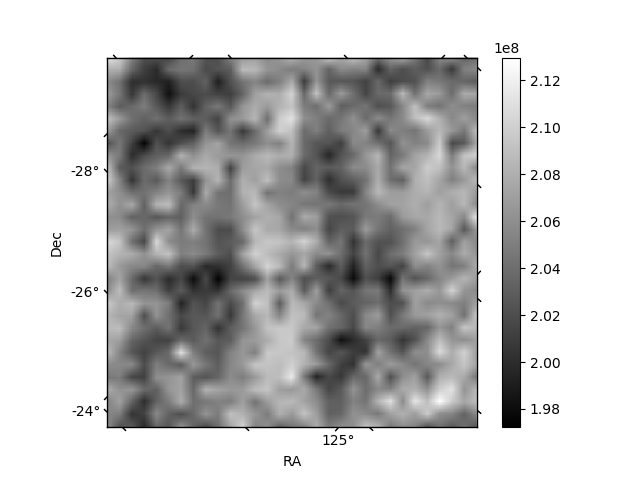
Histogram calculated using DETX and DETY for each event in the final _common_clean file
| Quadrant A | 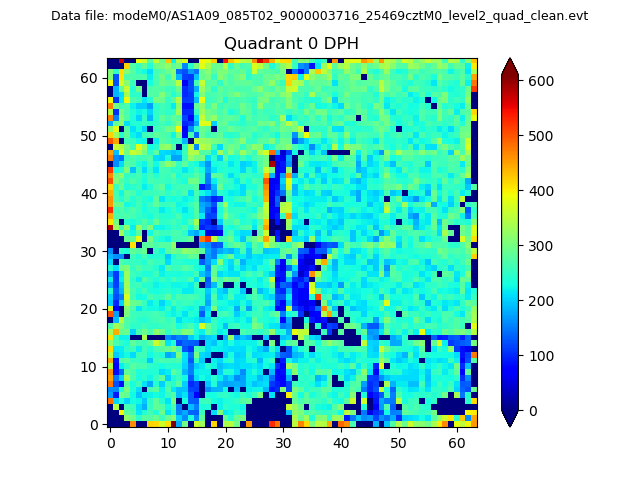 |
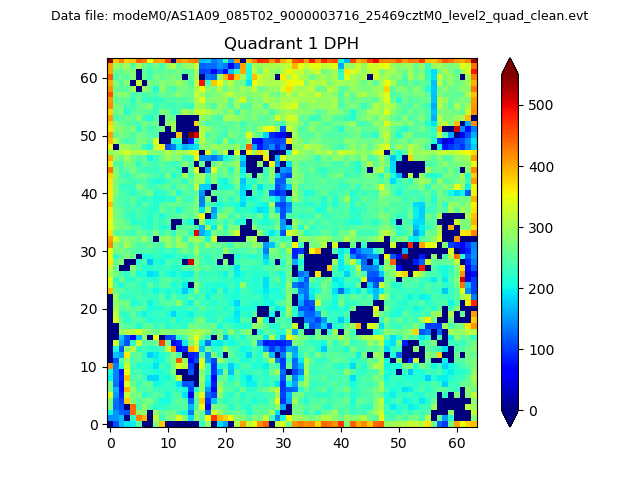 |
Quadrant B |
|---|---|---|---|
| Quadrant D | 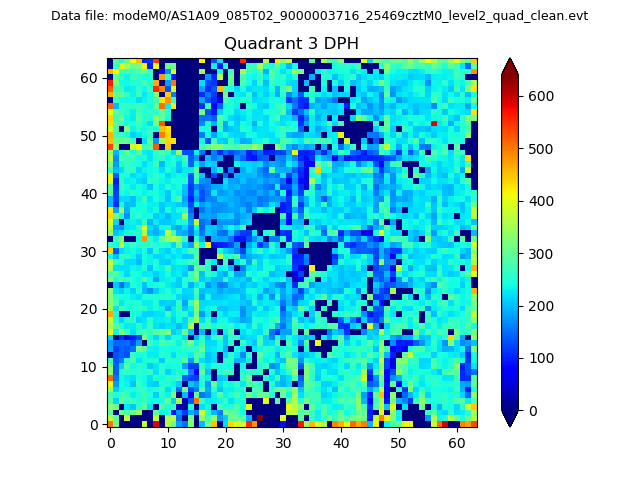 |
 |
Quadrant C |
| Plot type | Count rate plots | Images |
|---|---|---|
| Comparison with Poisson distribution Blue bars denote a histogram of data divided into 1 sec bins. Red curve is a Poisson curve with rate = median count rate of data. |
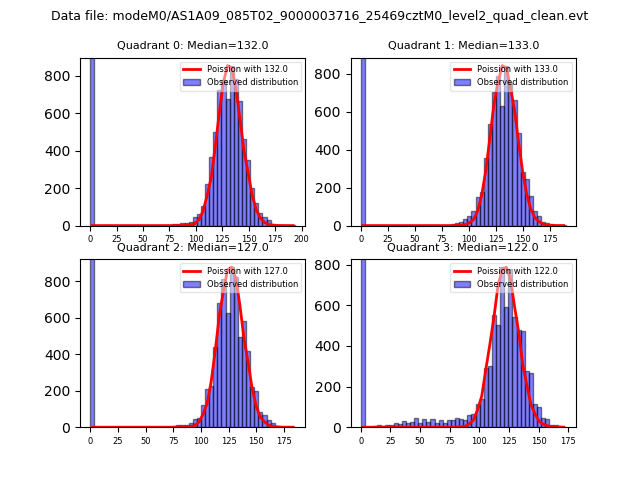 |
 |
| Quadrant-wise count rates Data is divided into 100 sec bins |
 |
|
| Module-wise count rates for Quadrant A Data is divided into 100 sec bins |
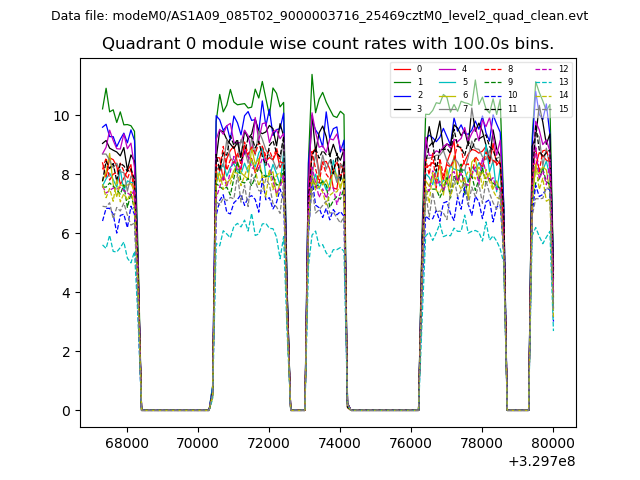 |
 |
| Module-wise count rates for Quadrant B Data is divided into 100 sec bins |
 |
 |
| Module-wise count rates for Quadrant C Data is divided into 100 sec bins |
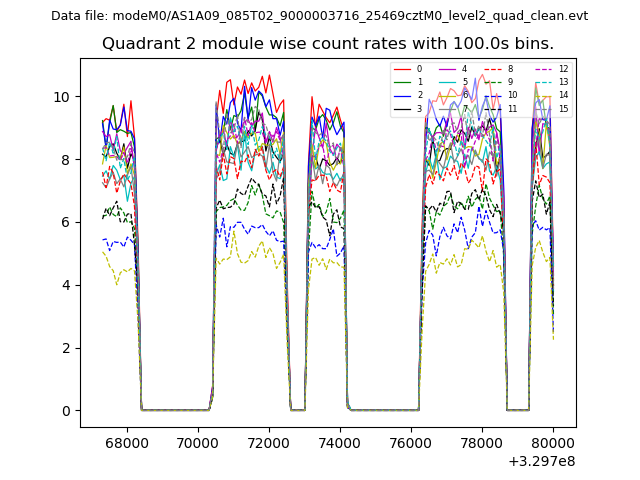 |
 |
| Module-wise count rates for Quadrant D Data is divided into 100 sec bins |
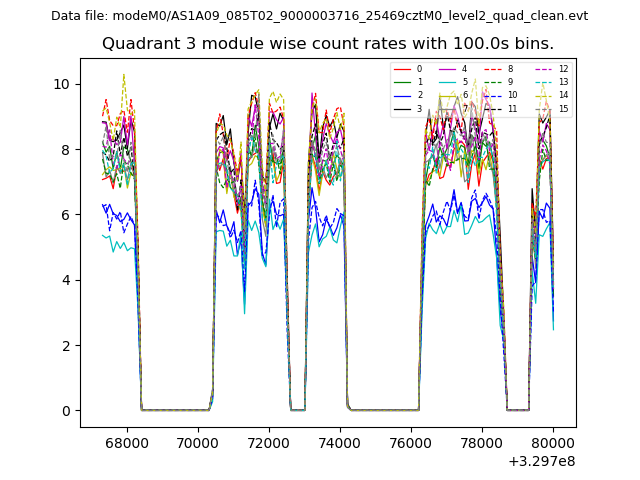 |
 |
| Parameter | Plot |
|---|---|
| CZT HV Monitor | 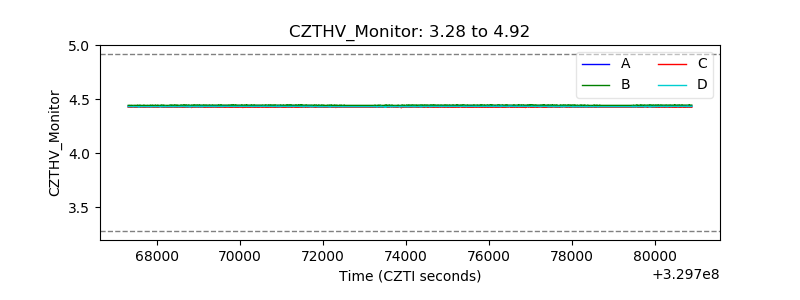 |
| D_VDD | 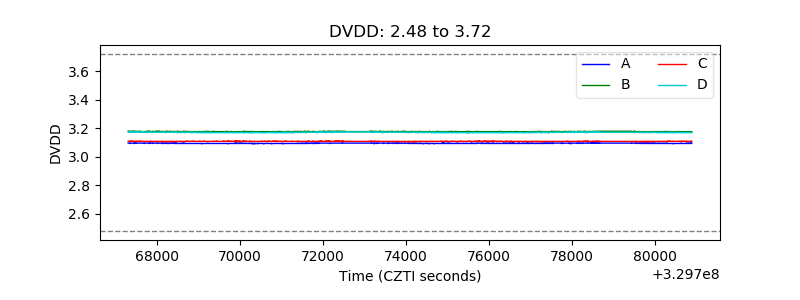 |
| Temperature 1 | 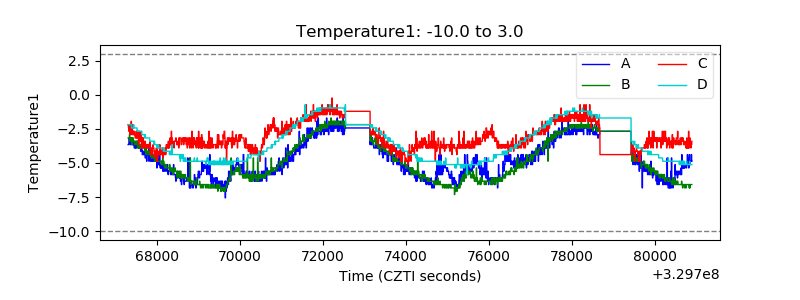 |
| Veto HV Monitor | 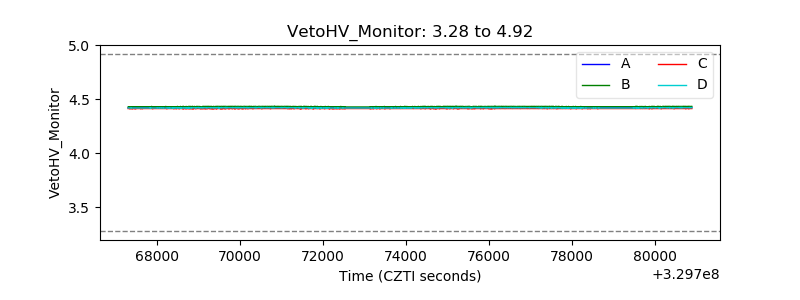 |
| Veto LLD | 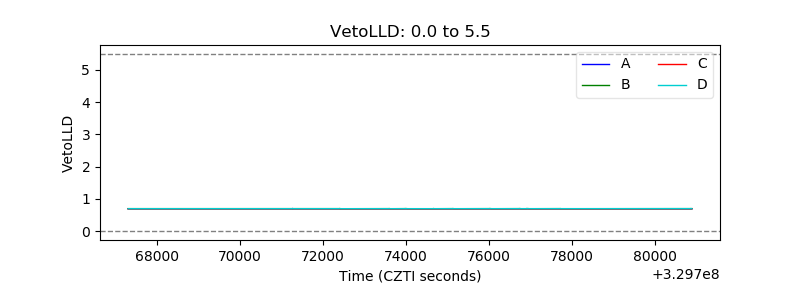 |
| Alpha Counter |  |
| _CPM_Rate | 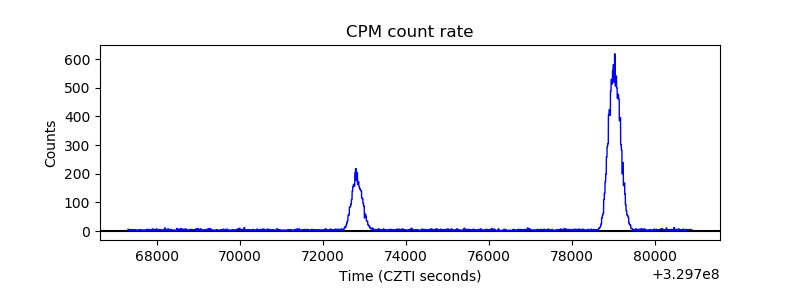 |
| CZT Counter | 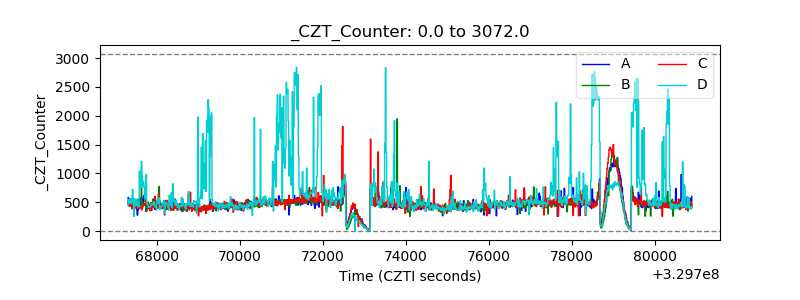 |
| +2.5 Volts monitor |  |
| +5 Volts monitor |  |
| _ROLL_ROT | 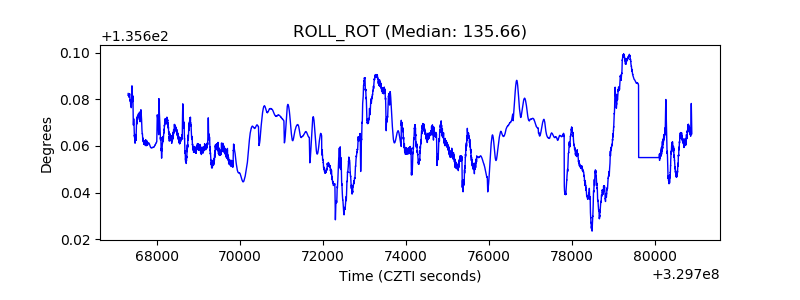 |
| _Roll_DEC | 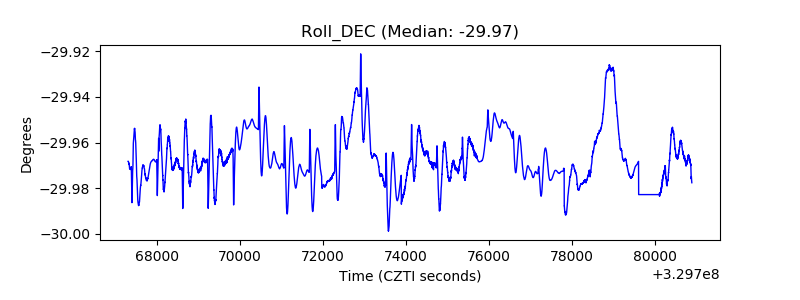 |
| _Roll_RA | 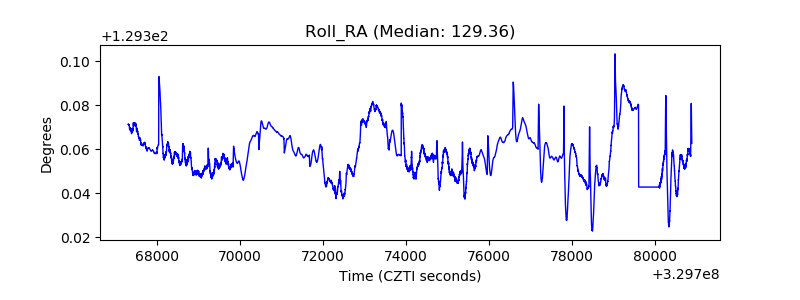 |
| Veto Counter | 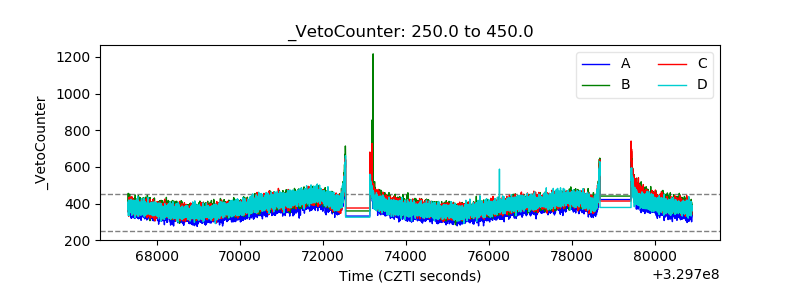 |