| Param | Original file | Final file |
|---|---|---|
| Filename | modeM0/AS1A09_085T02_9000003716_25470cztM0_level2.evt | modeM0/AS1A09_085T02_9000003716_25470cztM0_level2_quad_clean.evt |
| Size (bytes) | 540,377,280 | 73,860,480 |
| Size | 515.3 MB | 70.4 MB |
| Events in quadrant A | 3,408,882 | 457,536 |
| Events in quadrant B | 3,250,298 | 461,639 |
| Events in quadrant C | 3,205,893 | 442,216 |
| Events in quadrant D | 6,041,605 | 403,471 |
| Mode M9 | |||
|---|---|---|---|
| Quadrant | BADHDUFLAG | Total packets | Discarded packets |
| A | 0 | 13 | 0 |
| B | 0 | 14 | 0 |
| C | 0 | 14 | 0 |
| D | 0 | 14 | 0 |
| Mode M0 | |||
|---|---|---|---|
| Quadrant | BADHDUFLAG | Total packets | Discarded packets |
| A | 0 | 14239 | 0 |
| B | 0 | 13840 | 0 |
| C | 0 | 13764 | 0 |
| D | 0 | 22489 | 0 |
| Quadrant | Total seconds | Saturated seconds | Saturation percentage |
|---|---|---|---|
| A | 6759 | 34 | 0.503033% |
| B | 6759 | 38 | 0.562213% |
| C | 6759 | 52 | 0.769345% |
| D | 6759 | 813 | 12.028407% |
Noise dominated data is calculated using 1-second bins in cleaned event files. If a bin has >2000 counts, and if more than 50% of those come from <1% of pixels, then it is considered to be noise-dominated and hence unusable.
| Quadrant | # 1 sec bins | Bins with >0 counts | Bins with >2000 counts | High rate bins dominated by noise | Noise dominated (total time) | Noise dominated (detector-on time) | Marked lightcurve |
|---|---|---|---|---|---|---|---|
| A | 7659 | 6760 | 6 | 6 | 0.08% | 0.09% | 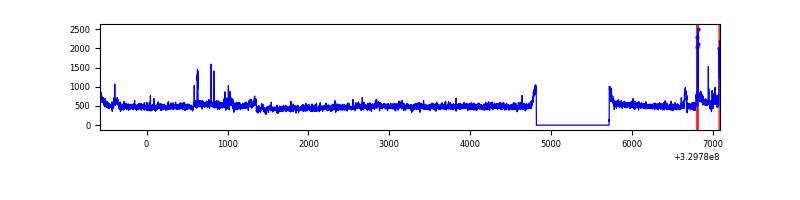 |
| B | 7659 | 6760 | 0 | 0 | 0.00% | 0.00% | 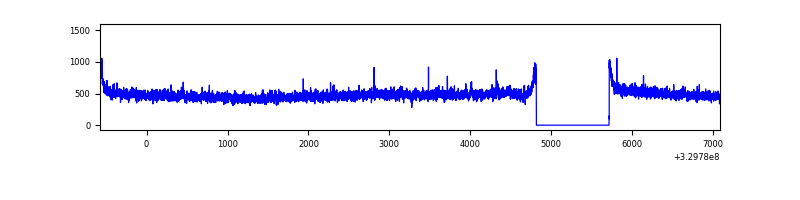 |
| C | 7659 | 6760 | 0 | 0 | 0.00% | 0.00% | 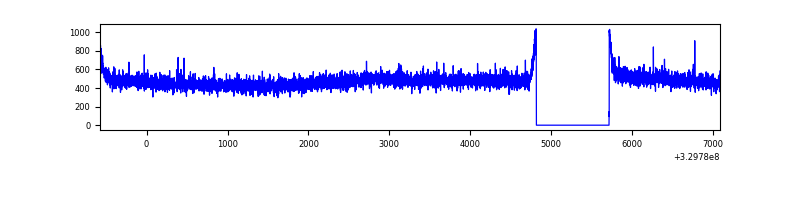 |
| D | 7659 | 6760 | 792 | 792 | 10.34% | 11.72% | 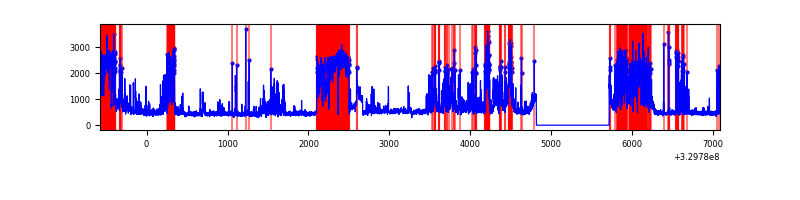 |
Top three noisy pixels from each quadrant. If the there are fewer than three noisy pixels in the level2.evt file, extra rows are filled as -1
| Pixel properties | Quadrant properties | ||||||
|---|---|---|---|---|---|---|---|
| Quadrant | DetID | PixID | Counts | Sigma | Mean | Median | Sigma |
| A | 6 | 16 | 216542 | 1292.6 | 828 | 809 | 166.9 |
| A | 13 | 254 | 10183 | 56.17 | 828 | 809 | 166.9 |
| A | 3 | 137 | 7813 | 41.97 | 828 | 809 | 166.9 |
| B | 12 | 111 | 19561 | 118.84 | 823 | 803 | 157.8 |
| B | 11 | 111 | 17679 | 106.91 | 823 | 803 | 157.8 |
| B | 14 | 111 | 16155 | 97.26 | 823 | 803 | 157.8 |
| C | 14 | 238 | 127291 | 686.3 | 786 | 793 | 184.3 |
| C | 3 | 233 | 10555 | 52.96 | 786 | 793 | 184.3 |
| C | 2 | 16 | 7678 | 37.35 | 786 | 793 | 184.3 |
| D | 7 | 238 | 2365948 | 12706.98 | 764 | 741 | 186.1 |
| D | 1 | 52 | 650359 | 3490.05 | 764 | 741 | 186.1 |
| D | 8 | 195 | 102010 | 544.06 | 764 | 741 | 186.1 |
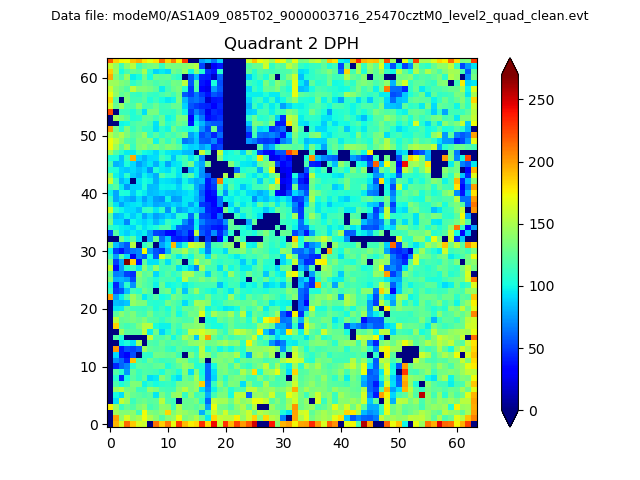
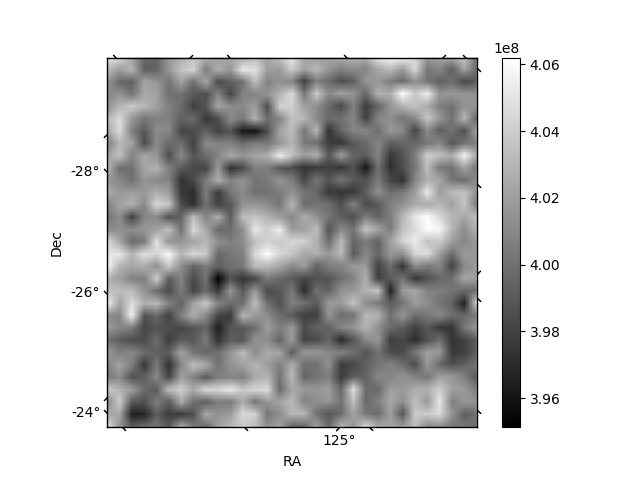
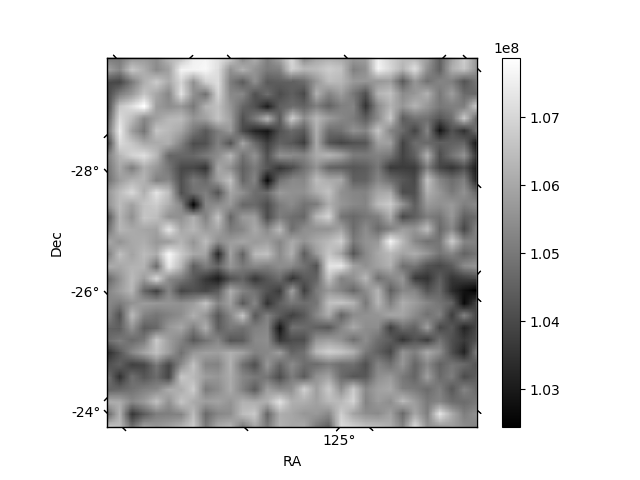
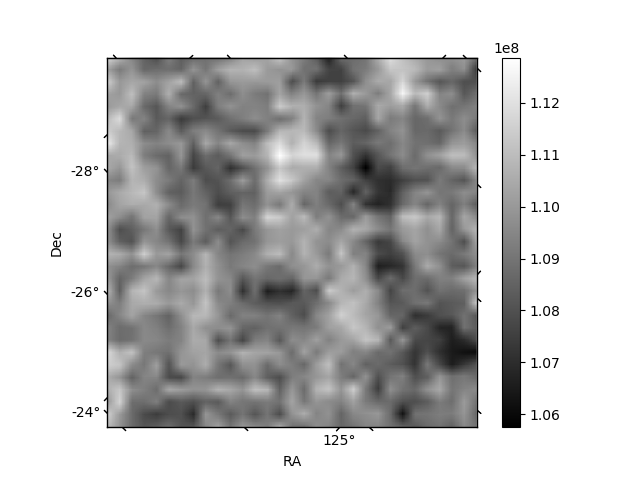
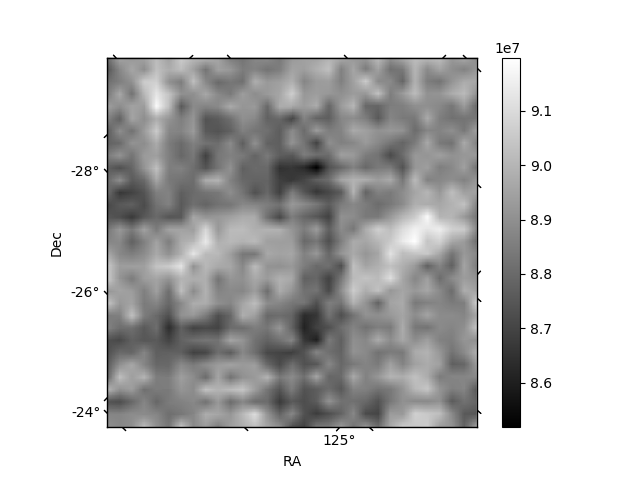
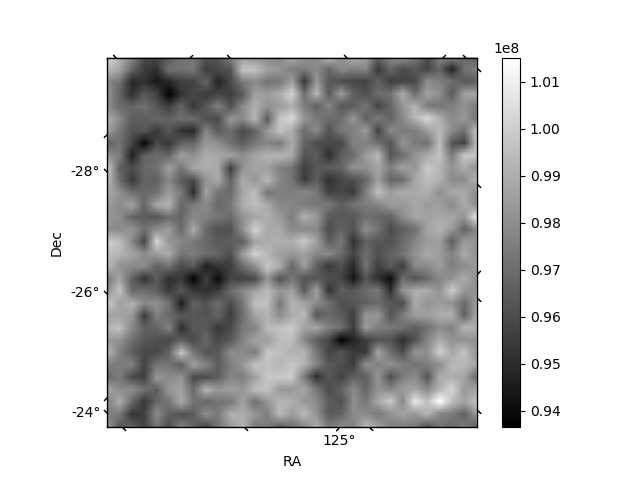
Histogram calculated using DETX and DETY for each event in the final _common_clean file
| Quadrant A | 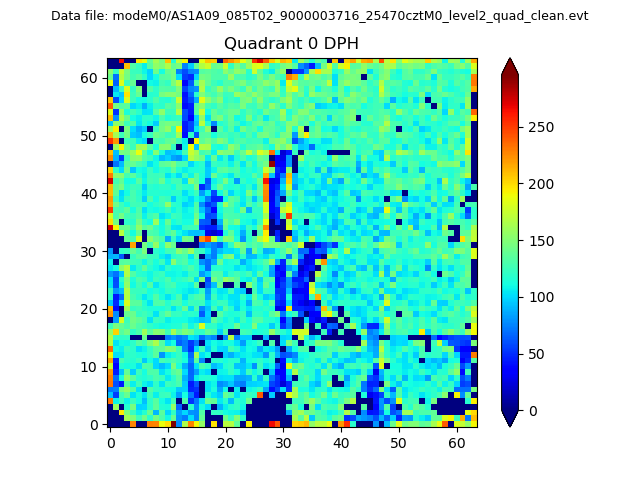 |
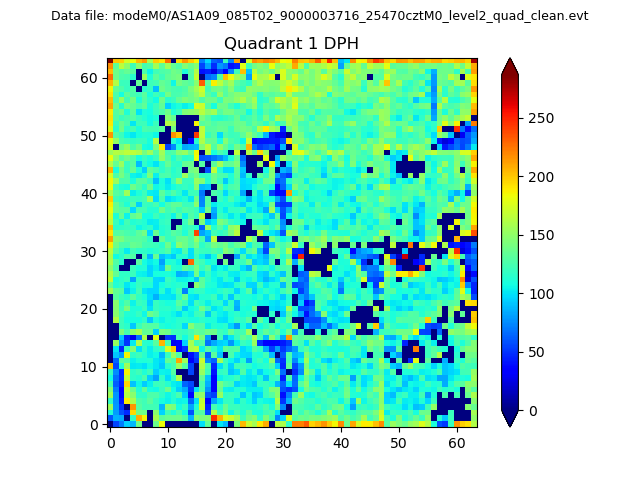 |
Quadrant B |
|---|---|---|---|
| Quadrant D | 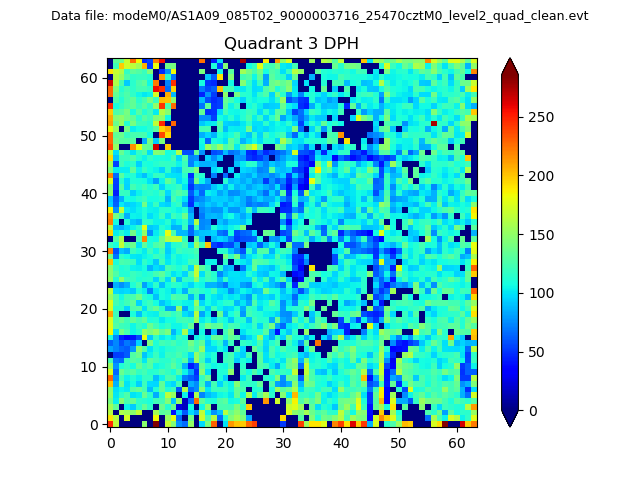 |
 |
Quadrant C |
| Plot type | Count rate plots | Images |
|---|---|---|
| Comparison with Poisson distribution Blue bars denote a histogram of data divided into 1 sec bins. Red curve is a Poisson curve with rate = median count rate of data. |
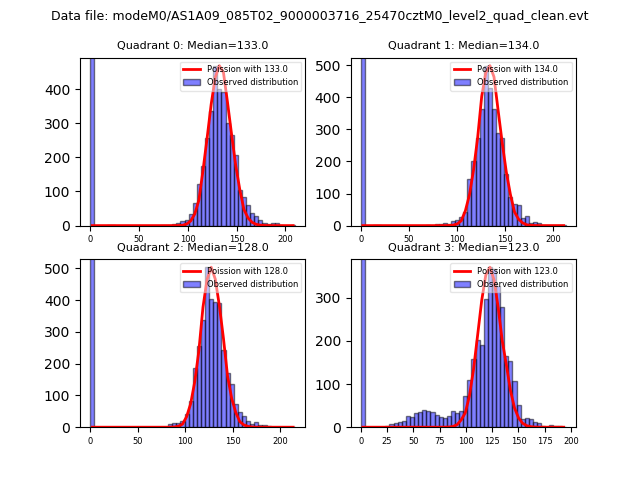 |
 |
| Quadrant-wise count rates Data is divided into 100 sec bins |
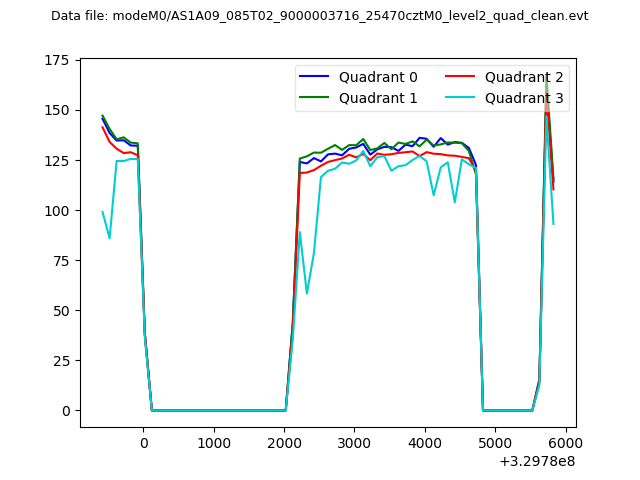 |
|
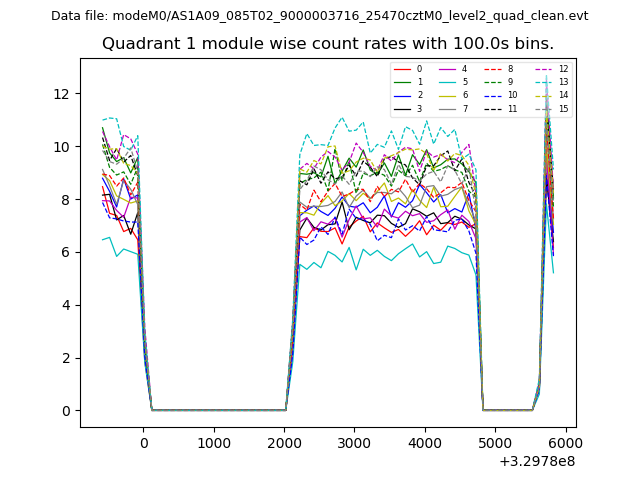
| Module-wise count rates for Quadrant A Data is divided into 100 sec bins |
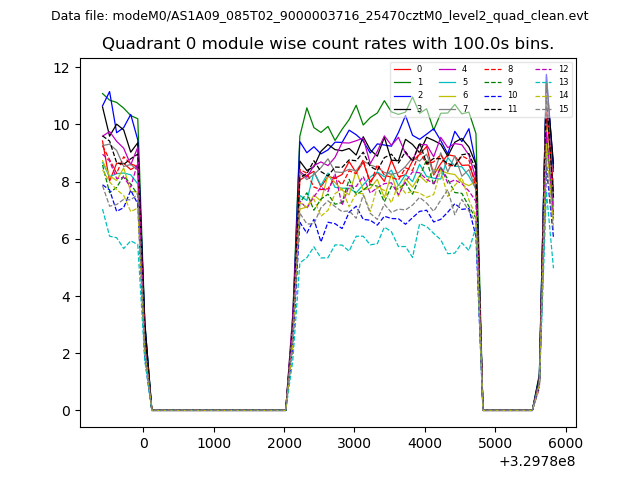 |
 |
| Module-wise count rates for Quadrant B Data is divided into 100 sec bins |
 |
 |
| Module-wise count rates for Quadrant C Data is divided into 100 sec bins |
 |
 |
| Module-wise count rates for Quadrant D Data is divided into 100 sec bins |
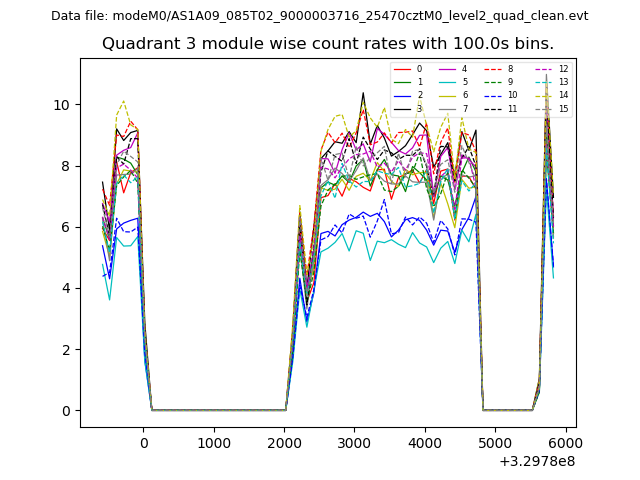 |
 |
| Parameter | Plot |
|---|---|
| CZT HV Monitor |  |
| D_VDD | 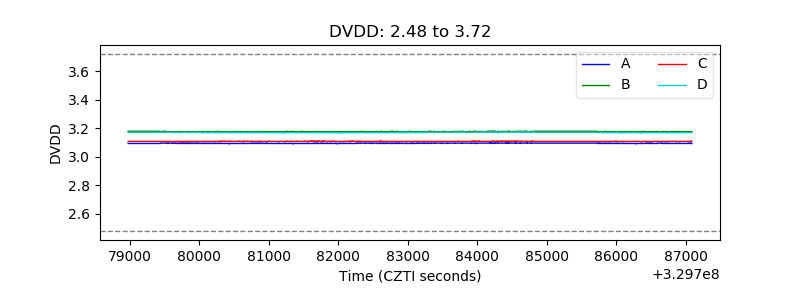 |
| Temperature 1 | 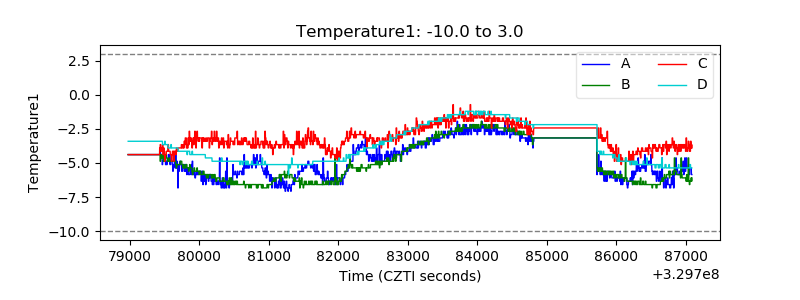 |
| Veto HV Monitor | 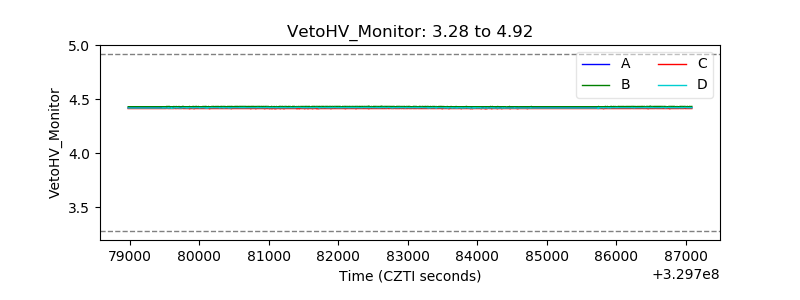 |
| Veto LLD | 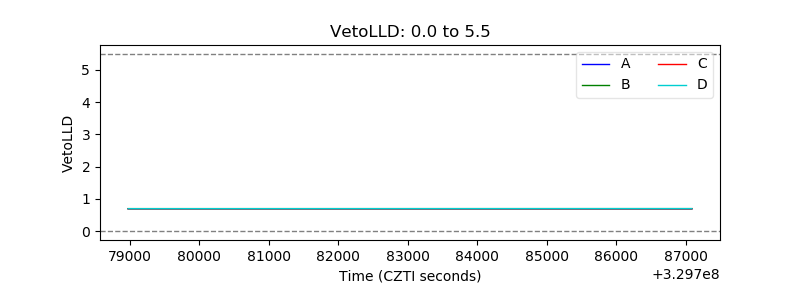 |
| Alpha Counter | 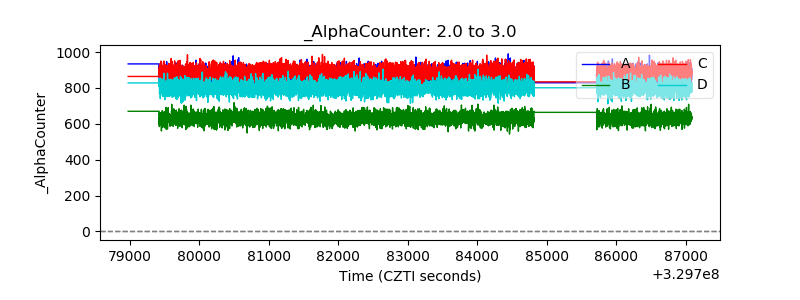 |
| _CPM_Rate | 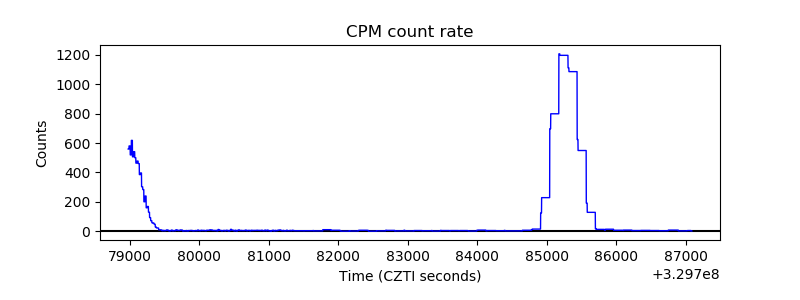 |
| CZT Counter | 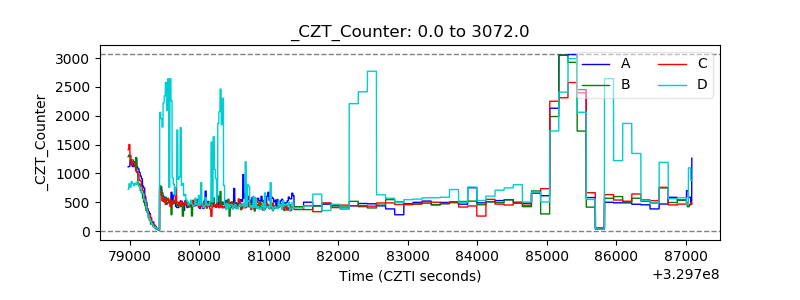 |
| +2.5 Volts monitor |  |
| +5 Volts monitor |  |
| _ROLL_ROT | 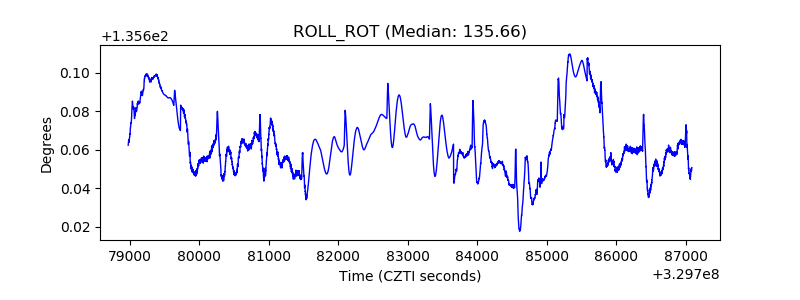 |
| _Roll_DEC | 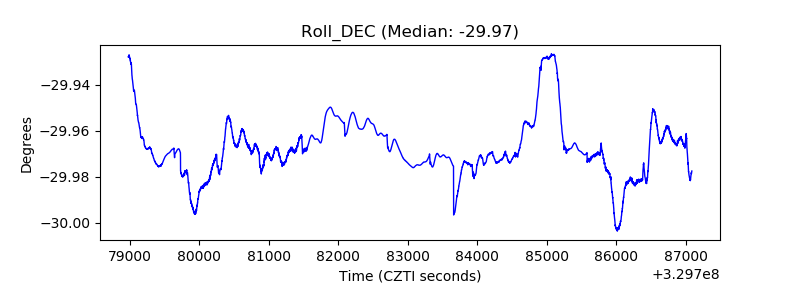 |
| _Roll_RA | 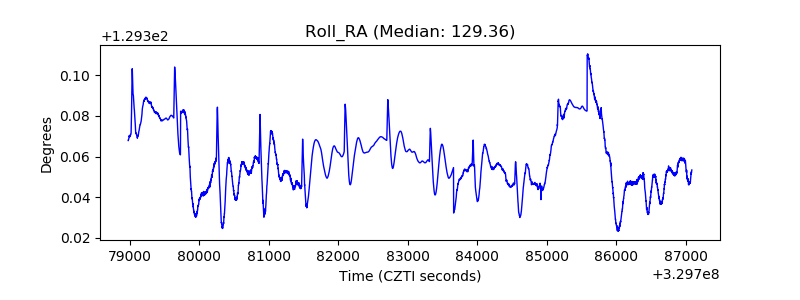 |
| Veto Counter | 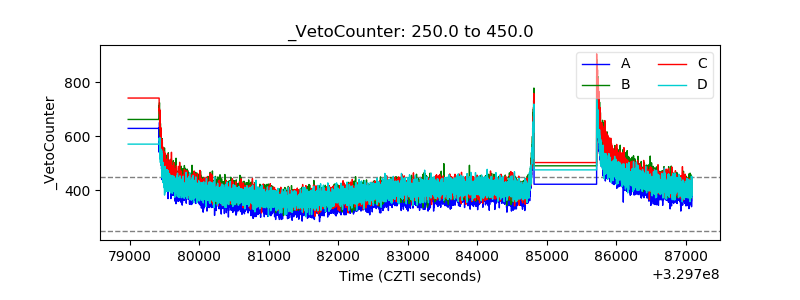 |