| Param | Original file | Final file |
|---|---|---|
| Filename | modeM0/AS1A09_085T02_9000003716_25471cztM0_level2.evt | modeM0/AS1A09_085T02_9000003716_25471cztM0_level2_quad_clean.evt |
| Size (bytes) | 575,386,560 | 70,032,960 |
| Size | 548.7 MB | 66.8 MB |
| Events in quadrant A | 4,005,889 | 435,001 |
| Events in quadrant B | 3,341,431 | 441,928 |
| Events in quadrant C | 3,340,769 | 422,646 |
| Events in quadrant D | 6,280,639 | 350,670 |
| Mode M9 | |||
|---|---|---|---|
| Quadrant | BADHDUFLAG | Total packets | Discarded packets |
| A | 0 | 20 | 0 |
| B | 0 | 20 | 0 |
| C | 0 | 20 | 0 |
| D | 0 | 20 | 0 |
| Mode M0 | |||
|---|---|---|---|
| Quadrant | BADHDUFLAG | Total packets | Discarded packets |
| A | 0 | 16338 | 0 |
| B | 0 | 14043 | 0 |
| C | 0 | 14004 | 0 |
| D | 0 | 23066 | 0 |
| Quadrant | Total seconds | Saturated seconds | Saturation percentage |
|---|---|---|---|
| A | 6742 | 66 | 0.978938% |
| B | 6743 | 72 | 1.067774% |
| C | 6743 | 78 | 1.156755% |
| D | 6743 | 1081 | 16.031440% |
Noise dominated data is calculated using 1-second bins in cleaned event files. If a bin has >2000 counts, and if more than 50% of those come from <1% of pixels, then it is considered to be noise-dominated and hence unusable.
| Quadrant | # 1 sec bins | Bins with >0 counts | Bins with >2000 counts | High rate bins dominated by noise | Noise dominated (total time) | Noise dominated (detector-on time) | Marked lightcurve |
|---|---|---|---|---|---|---|---|
| A | 8697 | 6744 | 15 | 15 | 0.17% | 0.22% | 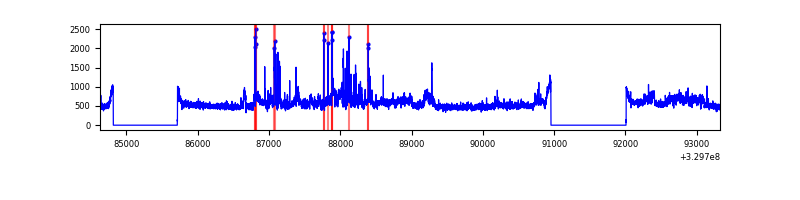 |
| B | 8698 | 6745 | 0 | 0 | 0.00% | 0.00% | 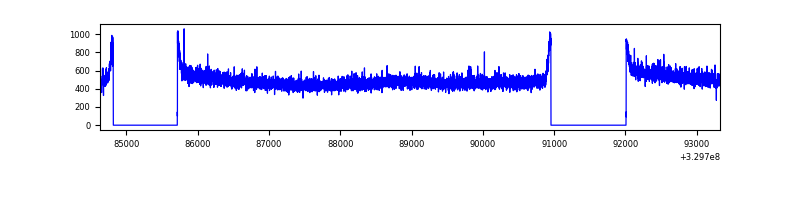 |
| C | 8698 | 6745 | 0 | 0 | 0.00% | 0.00% | 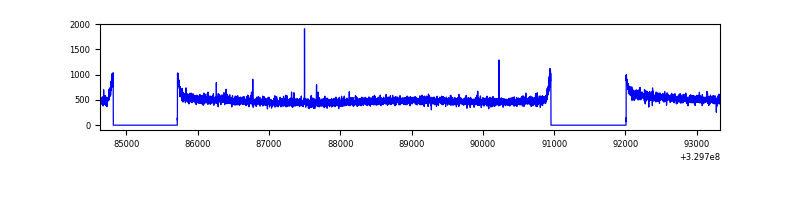 |
| D | 8698 | 6745 | 947 | 947 | 10.89% | 14.04% | 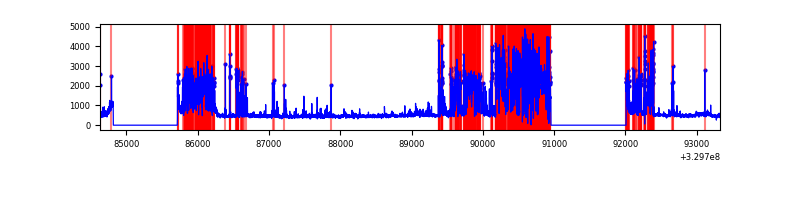 |
Top three noisy pixels from each quadrant. If the there are fewer than three noisy pixels in the level2.evt file, extra rows are filled as -1
| Pixel properties | Quadrant properties | ||||||
|---|---|---|---|---|---|---|---|
| Quadrant | DetID | PixID | Counts | Sigma | Mean | Median | Sigma |
| A | 6 | 16 | 698069 | 4049.11 | 858 | 839 | 172.2 |
| A | 13 | 254 | 9850 | 52.33 | 858 | 839 | 172.2 |
| A | 3 | 137 | 7918 | 41.11 | 858 | 839 | 172.2 |
| B | 12 | 111 | 20021 | 118.22 | 852 | 832 | 162.3 |
| B | 11 | 111 | 18043 | 106.04 | 852 | 832 | 162.3 |
| B | 14 | 111 | 16775 | 98.23 | 852 | 832 | 162.3 |
| C | 14 | 238 | 132498 | 692.34 | 818 | 822 | 190.2 |
| C | 2 | 16 | 11887 | 58.18 | 818 | 822 | 190.2 |
| C | 3 | 233 | 6495 | 29.83 | 818 | 822 | 190.2 |
| D | 1 | 52 | 1810407 | 9804.14 | 759 | 738 | 184.6 |
| D | 7 | 238 | 1436508 | 7778.49 | 759 | 738 | 184.6 |
| D | 8 | 195 | 126280 | 680.14 | 759 | 738 | 184.6 |
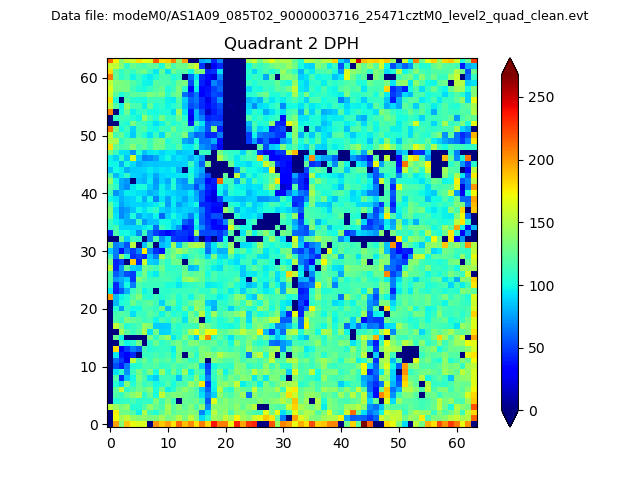
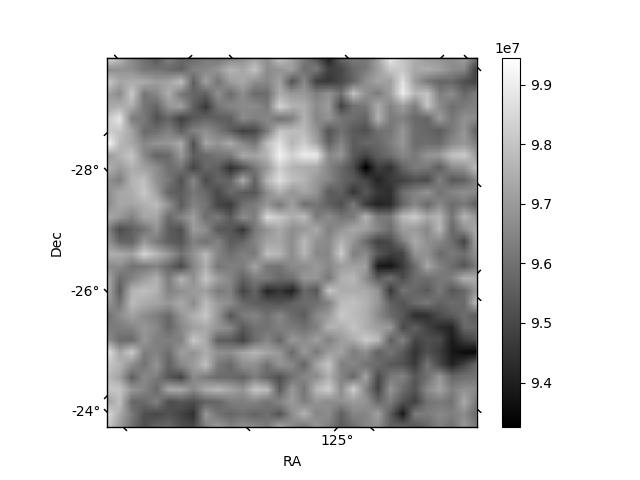
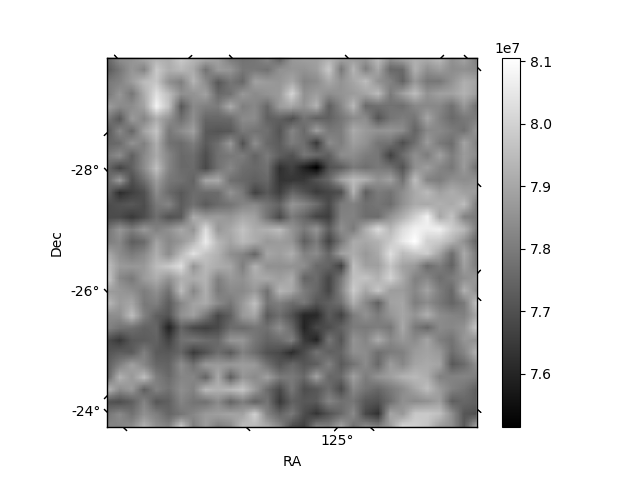
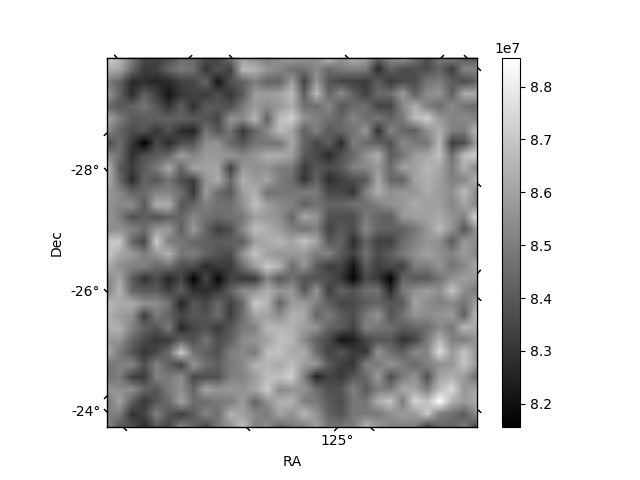
Histogram calculated using DETX and DETY for each event in the final _common_clean file
| Quadrant A | 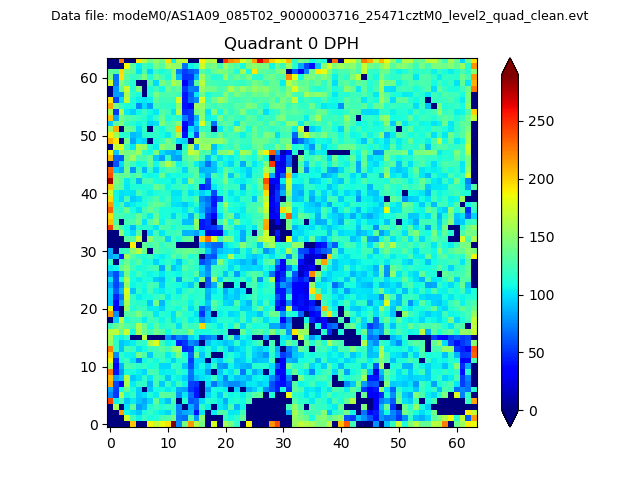 |
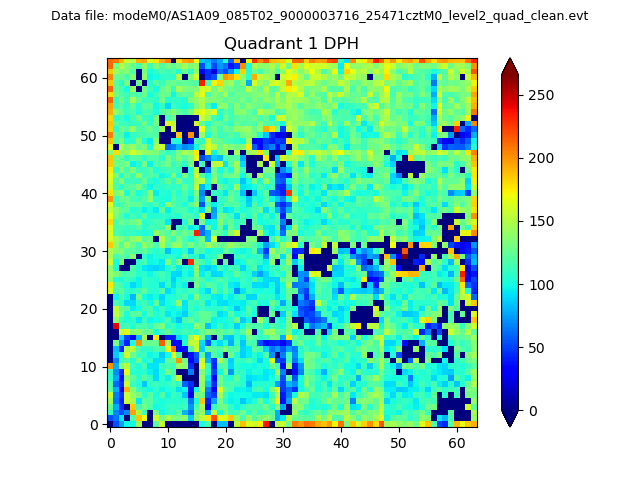 |
Quadrant B |
|---|---|---|---|
| Quadrant D | 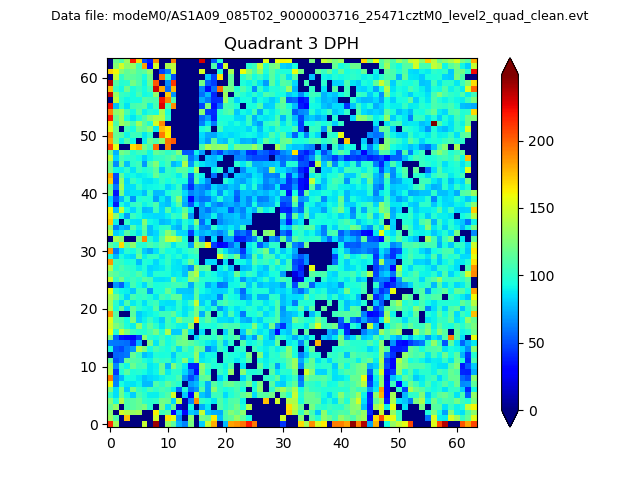 |
 |
Quadrant C |
| Plot type | Count rate plots | Images |
|---|---|---|
| Comparison with Poisson distribution Blue bars denote a histogram of data divided into 1 sec bins. Red curve is a Poisson curve with rate = median count rate of data. |
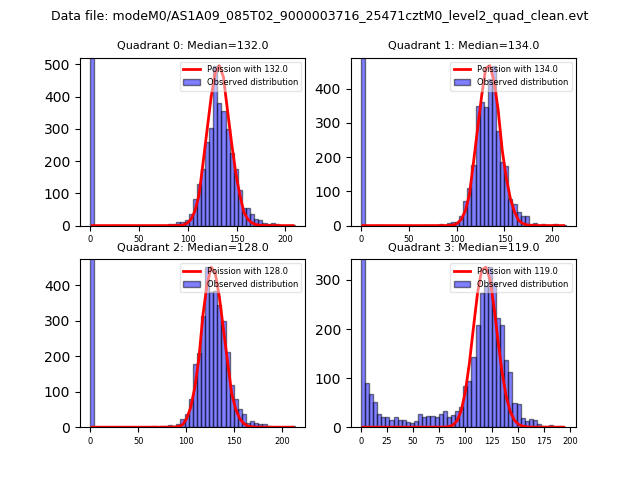 |
 |
| Quadrant-wise count rates Data is divided into 100 sec bins |
 |
|
| Module-wise count rates for Quadrant A Data is divided into 100 sec bins |
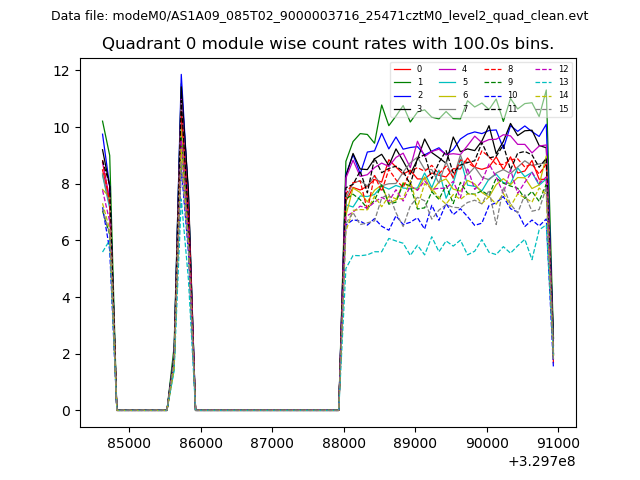 |
 |
| Module-wise count rates for Quadrant B Data is divided into 100 sec bins |
 |
 |
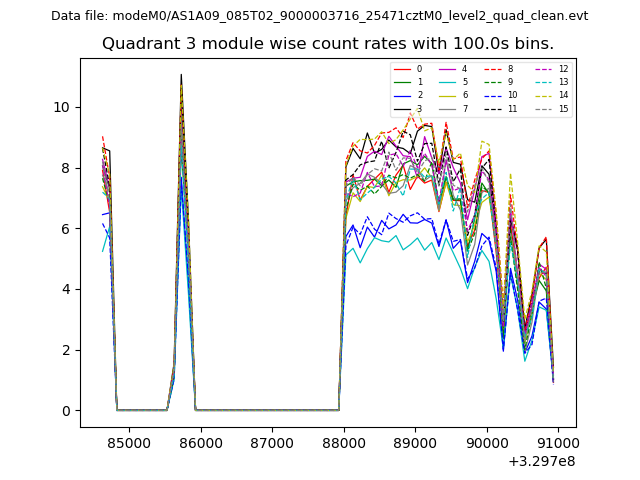
| Module-wise count rates for Quadrant C Data is divided into 100 sec bins |
 |
 |
| Module-wise count rates for Quadrant D Data is divided into 100 sec bins |
 |
 |
| Parameter | Plot |
|---|---|
| CZT HV Monitor |  |
| D_VDD | 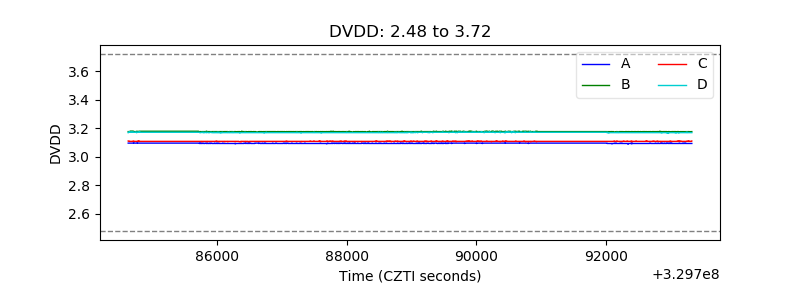 |
| Temperature 1 | 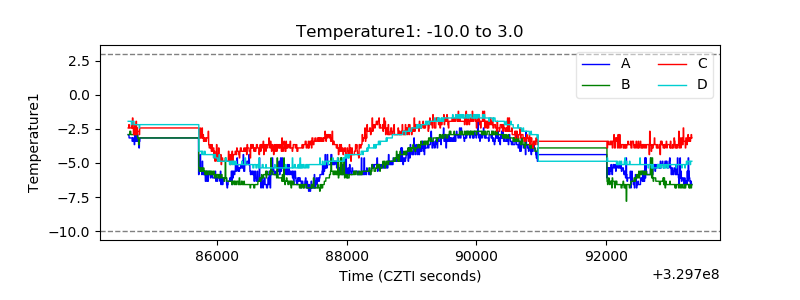 |
| Veto HV Monitor | 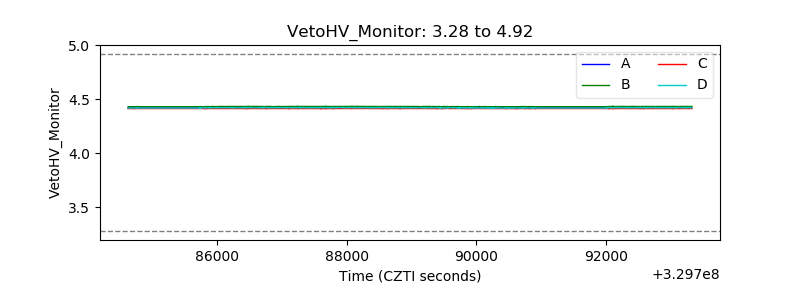 |
| Veto LLD | 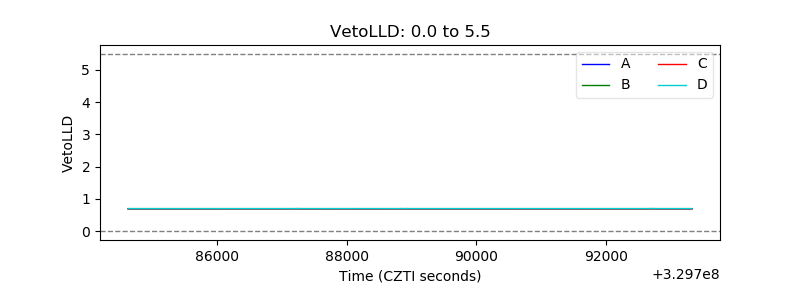 |
| Alpha Counter | 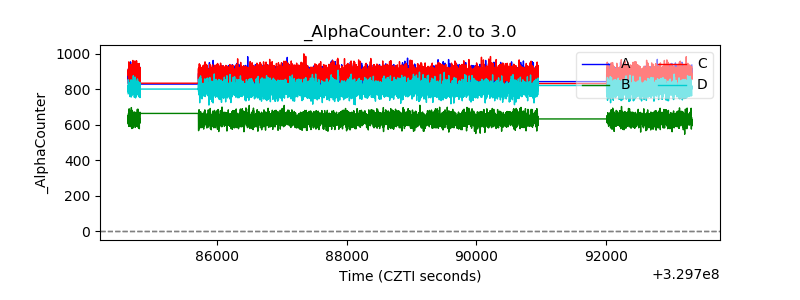 |
| _CPM_Rate | 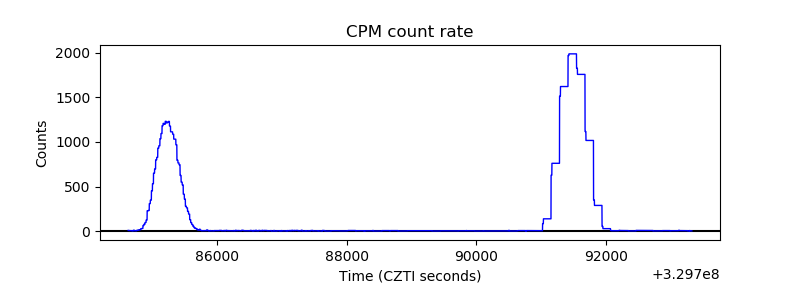 |
| CZT Counter | 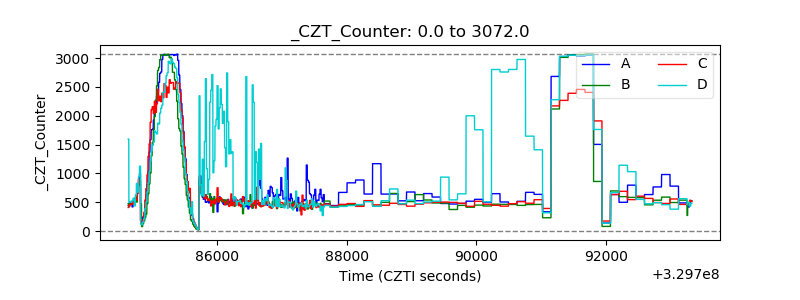 |
| +2.5 Volts monitor |  |
| +5 Volts monitor |  |
| _ROLL_ROT | 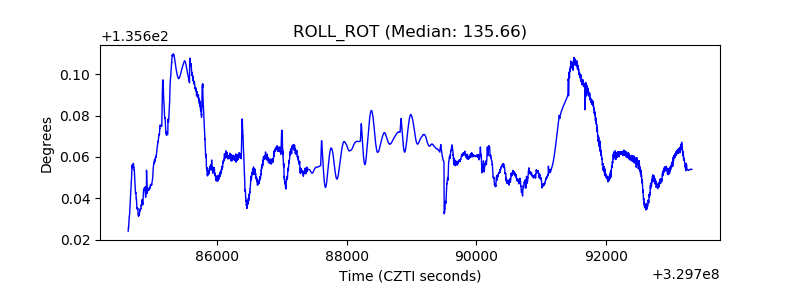 |
| _Roll_DEC | 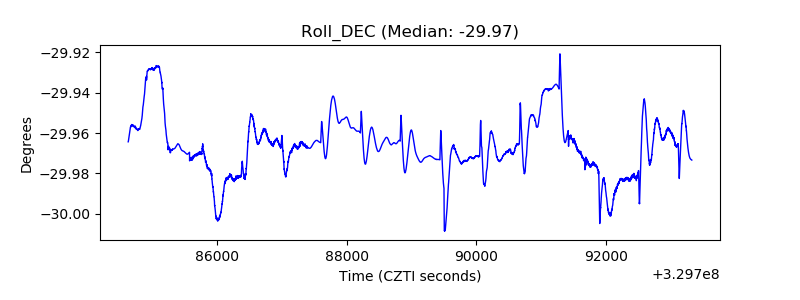 |
| _Roll_RA | 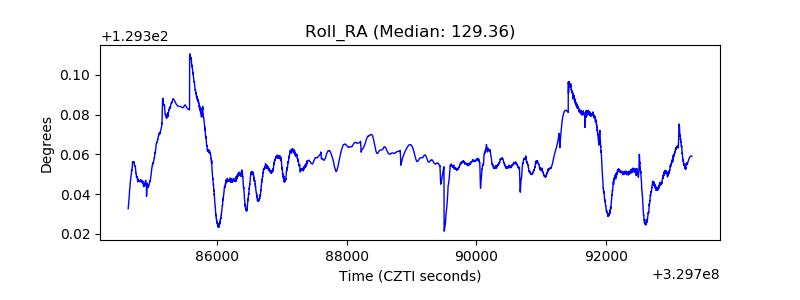 |
| Veto Counter | 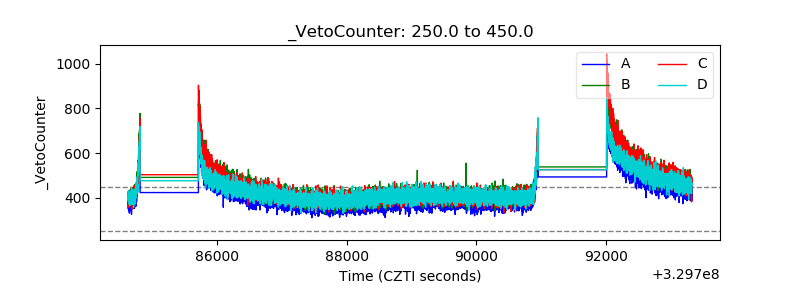 |