| Param | Original file | Final file |
|---|---|---|
| Filename | modeM0/AS1A09_085T02_9000003716_25473cztM0_level2.evt | modeM0/AS1A09_085T02_9000003716_25473cztM0_level2_quad_clean.evt |
| Size (bytes) | 491,515,200 | 72,031,680 |
| Size | 468.7 MB | 68.7 MB |
| Events in quadrant A | 3,565,626 | 441,934 |
| Events in quadrant B | 3,370,394 | 448,374 |
| Events in quadrant C | 3,351,078 | 428,749 |
| Events in quadrant D | 4,164,759 | 416,207 |
| Mode M9 | |||
|---|---|---|---|
| Quadrant | BADHDUFLAG | Total packets | Discarded packets |
| A | 0 | 22 | 0 |
| B | 0 | 22 | 0 |
| C | 0 | 22 | 0 |
| D | 0 | 22 | 0 |
| Mode M0 | |||
|---|---|---|---|
| Quadrant | BADHDUFLAG | Total packets | Discarded packets |
| A | 0 | 14818 | 0 |
| B | 0 | 13897 | 0 |
| C | 0 | 13819 | 0 |
| D | 0 | 16467 | 0 |
| Quadrant | Total seconds | Saturated seconds | Saturation percentage |
|---|---|---|---|
| A | 6388 | 73 | 1.142768% |
| B | 6389 | 105 | 1.643450% |
| C | 6389 | 122 | 1.909532% |
| D | 6389 | 223 | 3.490374% |
Noise dominated data is calculated using 1-second bins in cleaned event files. If a bin has >2000 counts, and if more than 50% of those come from <1% of pixels, then it is considered to be noise-dominated and hence unusable.
| Quadrant | # 1 sec bins | Bins with >0 counts | Bins with >2000 counts | High rate bins dominated by noise | Noise dominated (total time) | Noise dominated (detector-on time) | Marked lightcurve |
|---|---|---|---|---|---|---|---|
| A | 8598 | 6390 | 0 | 0 | 0.00% | 0.00% | 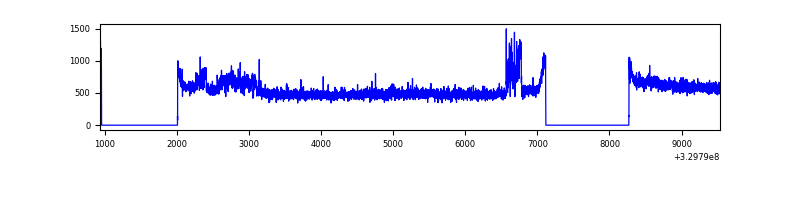 |
| B | 8599 | 6391 | 5 | 5 | 0.06% | 0.08% | 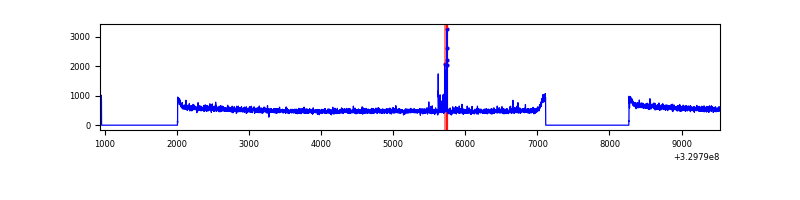 |
| C | 8599 | 6391 | 0 | 0 | 0.00% | 0.00% | 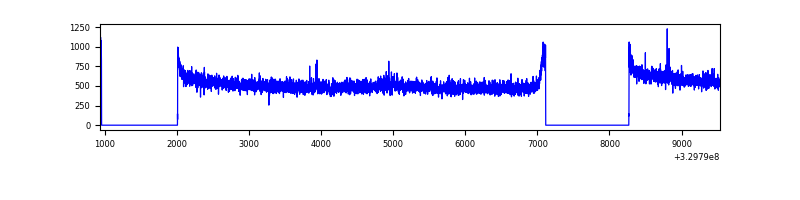 |
| D | 8599 | 6391 | 153 | 153 | 1.78% | 2.39% | 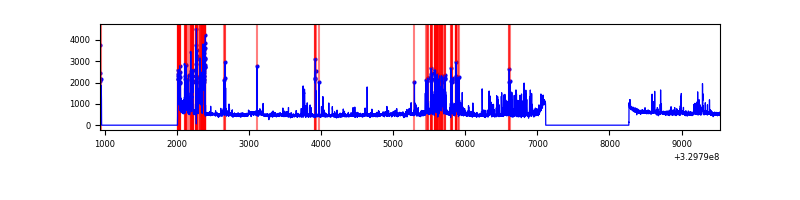 |
Top three noisy pixels from each quadrant. If the there are fewer than three noisy pixels in the level2.evt file, extra rows are filled as -1
| Pixel properties | Quadrant properties | ||||||
|---|---|---|---|---|---|---|---|
| Quadrant | DetID | PixID | Counts | Sigma | Mean | Median | Sigma |
| A | 6 | 16 | 261722 | 1524.51 | 857 | 843 | 171.1 |
| A | 13 | 254 | 9352 | 49.72 | 857 | 843 | 171.1 |
| A | 3 | 137 | 7554 | 39.22 | 857 | 843 | 171.1 |
| B | 0 | 245 | 39212 | 240.68 | 849 | 830 | 159.5 |
| B | 12 | 111 | 19353 | 116.15 | 849 | 830 | 159.5 |
| B | 11 | 111 | 17728 | 105.96 | 849 | 830 | 159.5 |
| C | 14 | 238 | 134227 | 705.48 | 822 | 828 | 189.1 |
| C | 2 | 16 | 9636 | 46.58 | 822 | 828 | 189.1 |
| C | 13 | 61 | 5660 | 25.55 | 822 | 828 | 189.1 |
| D | 1 | 52 | 606641 | 3111.4 | 818 | 796 | 194.7 |
| D | 7 | 238 | 305925 | 1567.03 | 818 | 796 | 194.7 |
| D | 2 | 82 | 63466 | 321.85 | 818 | 796 | 194.7 |
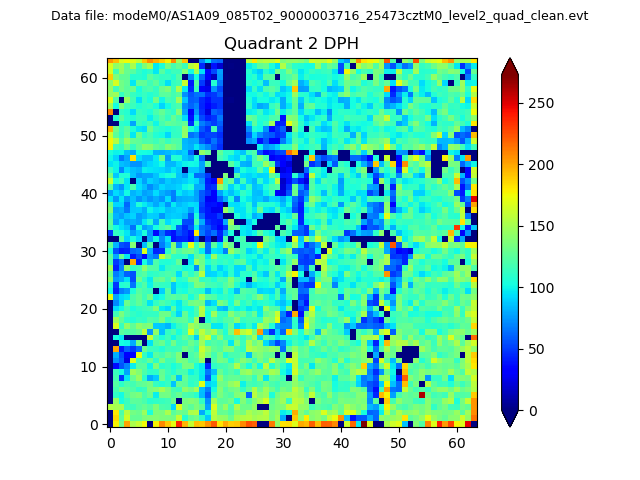
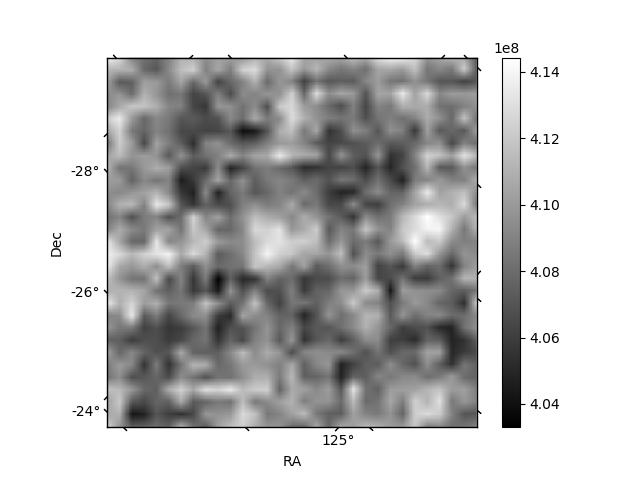
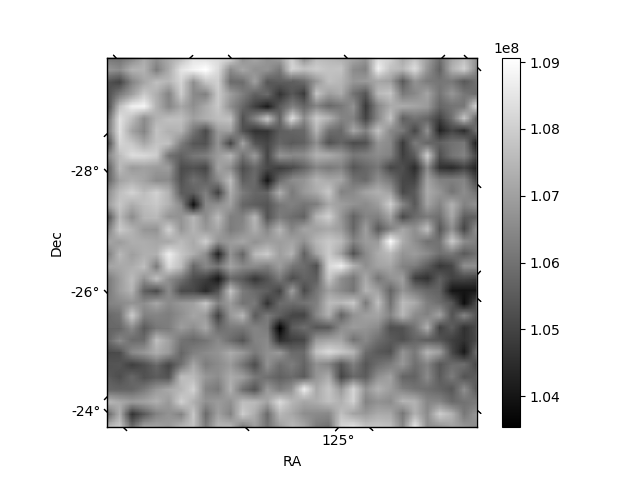
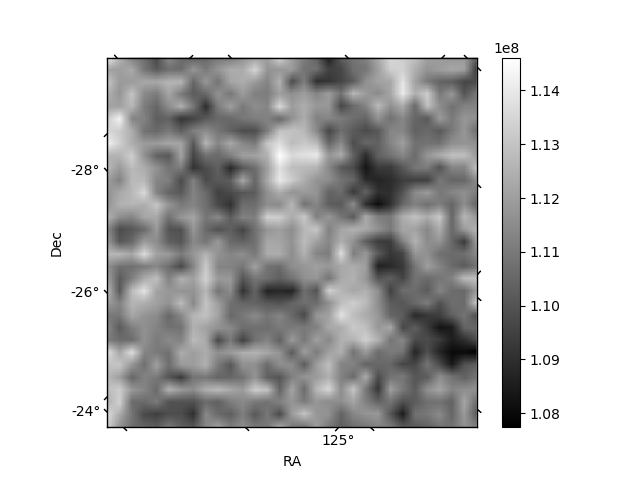
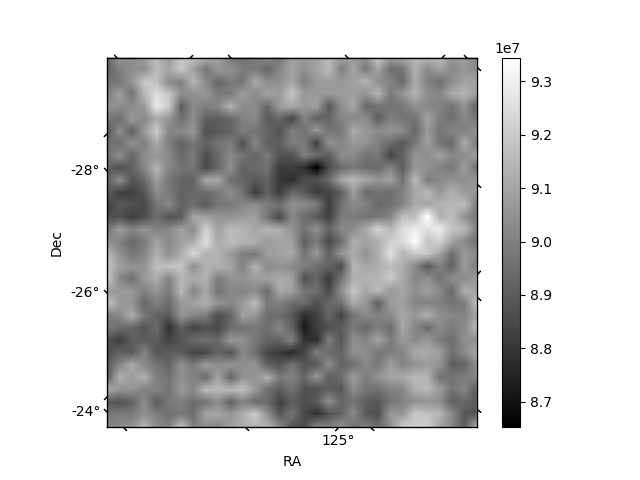
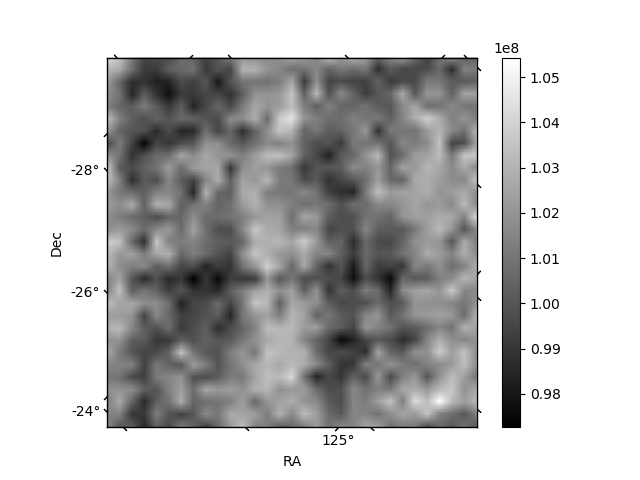
Histogram calculated using DETX and DETY for each event in the final _common_clean file
| Quadrant A | 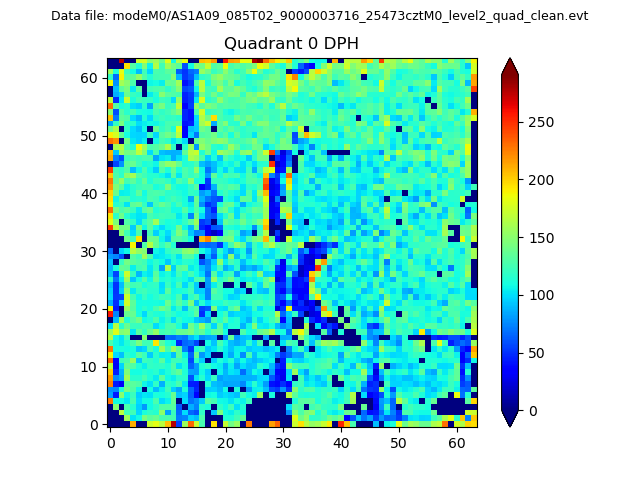 |
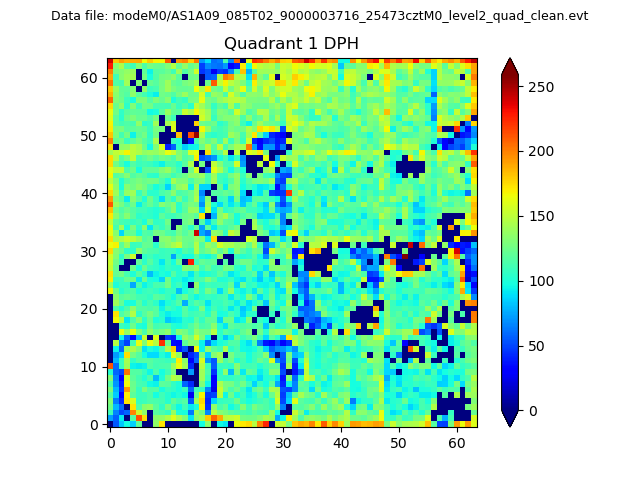 |
Quadrant B |
|---|---|---|---|
| Quadrant D | 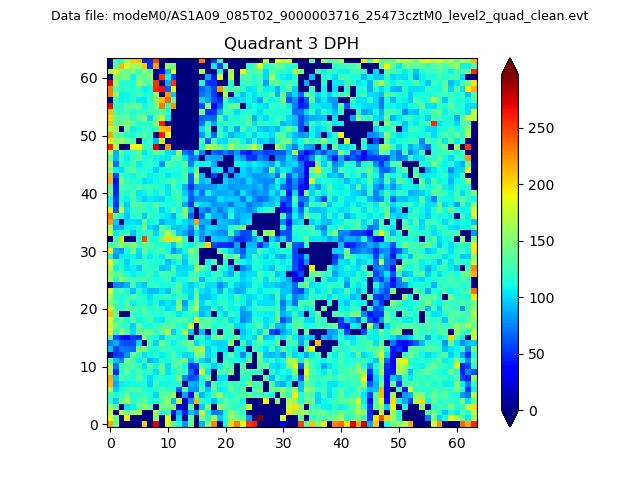 |
 |
Quadrant C |
| Plot type | Count rate plots | Images |
|---|---|---|
| Comparison with Poisson distribution Blue bars denote a histogram of data divided into 1 sec bins. Red curve is a Poisson curve with rate = median count rate of data. |
 |
 |
| Quadrant-wise count rates Data is divided into 100 sec bins |
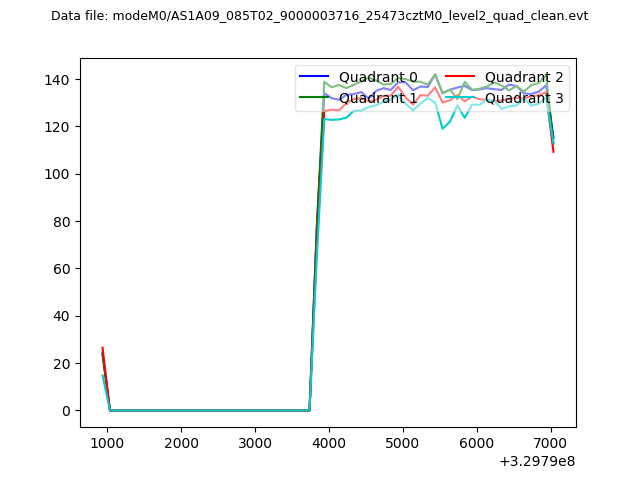 |
|
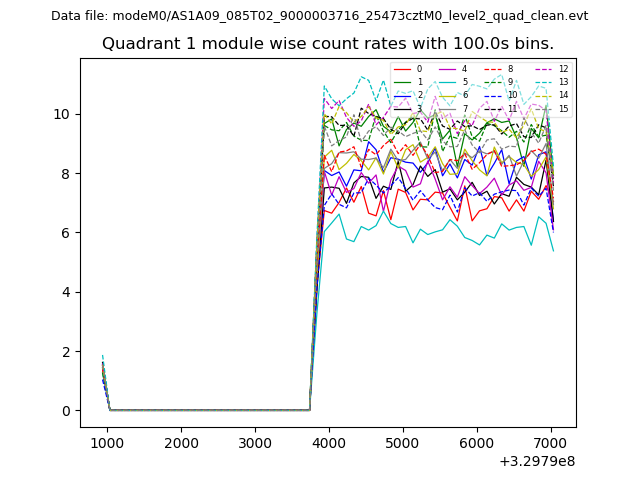
| Module-wise count rates for Quadrant A Data is divided into 100 sec bins |
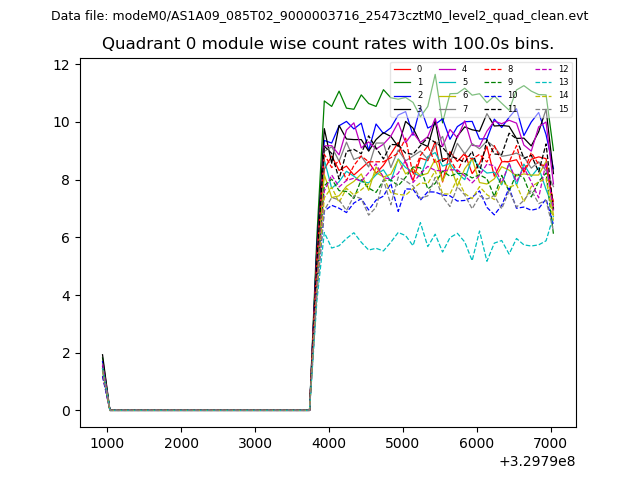 |
 |
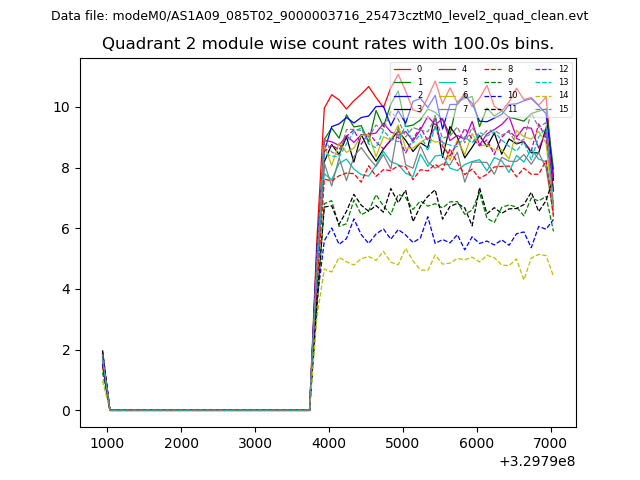
| Module-wise count rates for Quadrant B Data is divided into 100 sec bins |
 |
 |
| Module-wise count rates for Quadrant C Data is divided into 100 sec bins |
 |
 |
| Module-wise count rates for Quadrant D Data is divided into 100 sec bins |
 |
 |
| Parameter | Plot |
|---|---|
| CZT HV Monitor | 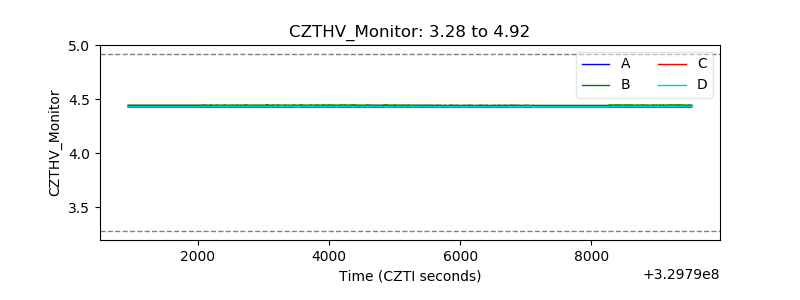 |
| D_VDD | 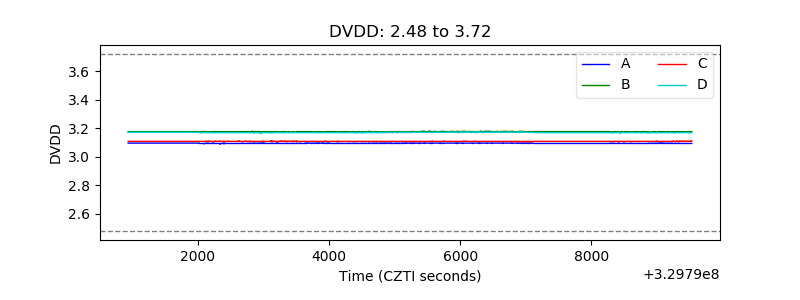 |
| Temperature 1 | 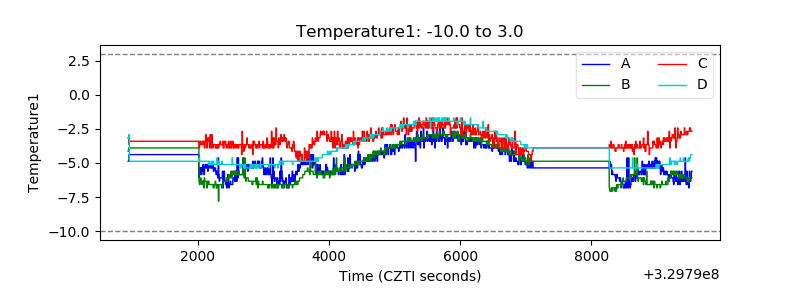 |
| Veto HV Monitor | 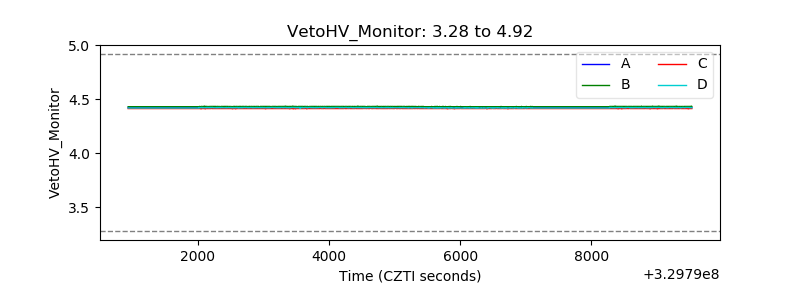 |
| Veto LLD | 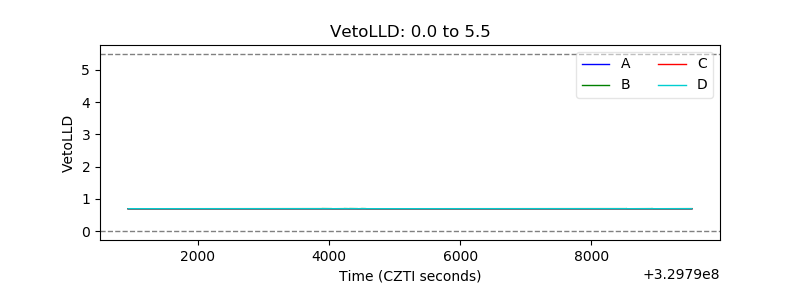 |
| Alpha Counter | 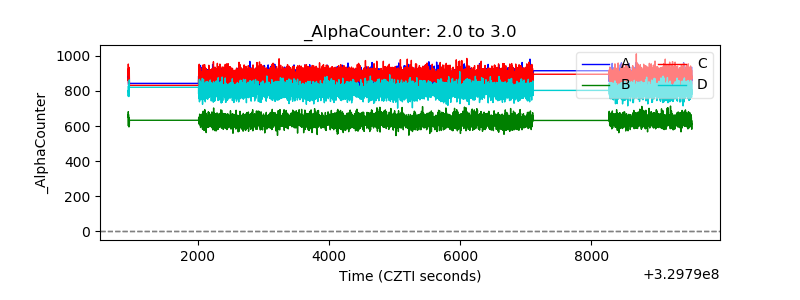 |
| _CPM_Rate | 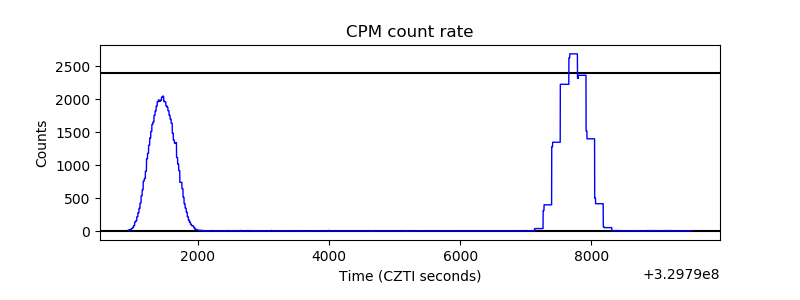 |
| CZT Counter | 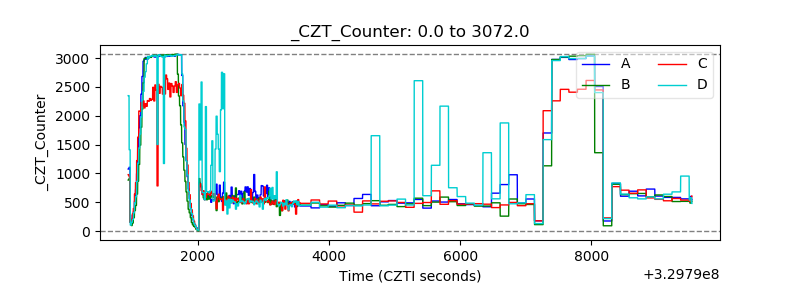 |
| +2.5 Volts monitor |  |
| +5 Volts monitor |  |
| _ROLL_ROT | 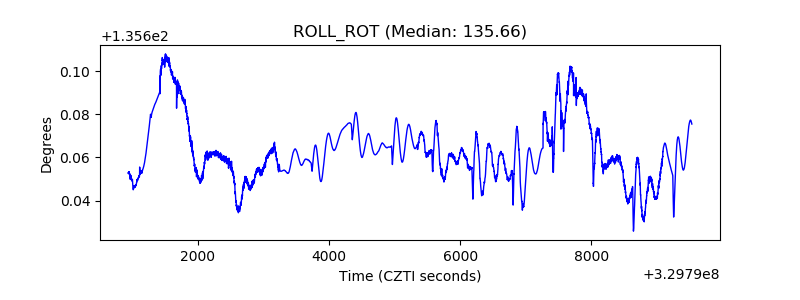 |
| _Roll_DEC | 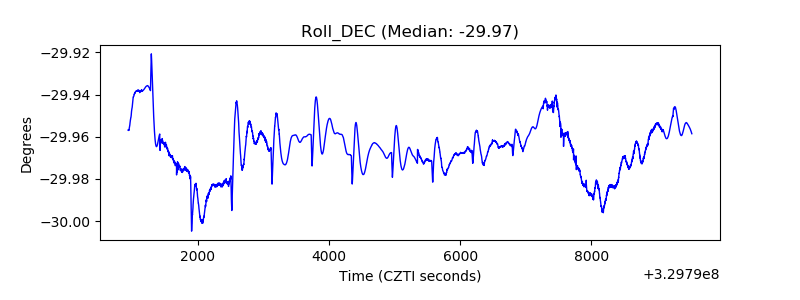 |
| _Roll_RA | 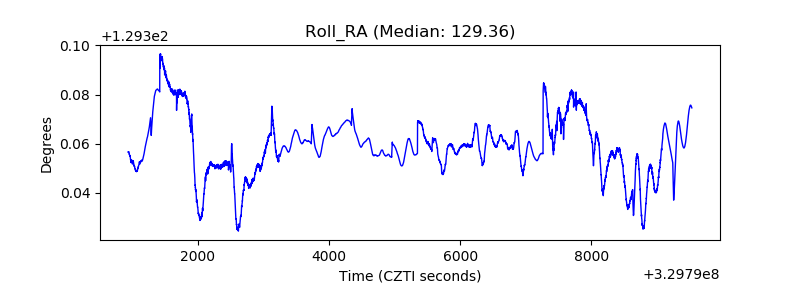 |
| Veto Counter | 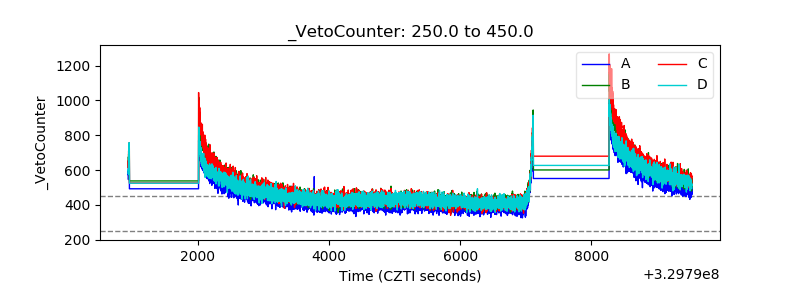 |