| Param | Original file | Final file |
|---|---|---|
| Filename | modeM0/AS1A09_085T02_9000003716_25474cztM0_level2.evt | modeM0/AS1A09_085T02_9000003716_25474cztM0_level2_quad_clean.evt |
| Size (bytes) | 505,356,480 | 92,096,640 |
| Size | 481.9 MB | 87.8 MB |
| Events in quadrant A | 3,587,493 | 593,042 |
| Events in quadrant B | 3,558,869 | 602,268 |
| Events in quadrant C | 3,605,978 | 576,413 |
| Events in quadrant D | 4,110,369 | 562,819 |
| Mode M9 | |||
|---|---|---|---|
| Quadrant | BADHDUFLAG | Total packets | Discarded packets |
| A | 0 | 18 | 0 |
| B | 0 | 19 | 0 |
| C | 0 | 19 | 0 |
| D | 0 | 19 | 0 |
| Mode M0 | |||
|---|---|---|---|
| Quadrant | BADHDUFLAG | Total packets | Discarded packets |
| A | 0 | 14788 | 0 |
| B | 0 | 14652 | 0 |
| C | 0 | 14824 | 0 |
| D | 0 | 16271 | 0 |
| Quadrant | Total seconds | Saturated seconds | Saturation percentage |
|---|---|---|---|
| A | 6512 | 70 | 1.074939% |
| B | 6512 | 93 | 1.428133% |
| C | 6512 | 147 | 2.257371% |
| D | 6512 | 120 | 1.842752% |
Noise dominated data is calculated using 1-second bins in cleaned event files. If a bin has >2000 counts, and if more than 50% of those come from <1% of pixels, then it is considered to be noise-dominated and hence unusable.
| Quadrant | # 1 sec bins | Bins with >0 counts | Bins with >2000 counts | High rate bins dominated by noise | Noise dominated (total time) | Noise dominated (detector-on time) | Marked lightcurve |
|---|---|---|---|---|---|---|---|
| A | 7777 | 6513 | 0 | 0 | 0.00% | 0.00% | 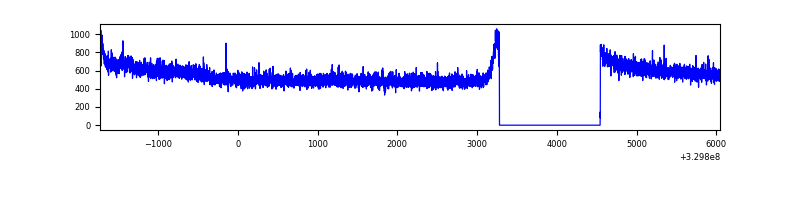 |
| B | 7777 | 6513 | 0 | 0 | 0.00% | 0.00% | 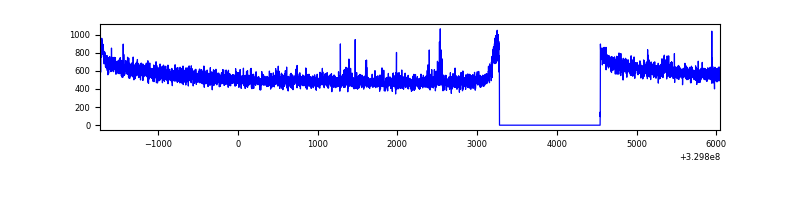 |
| C | 7777 | 6513 | 0 | 0 | 0.00% | 0.00% | 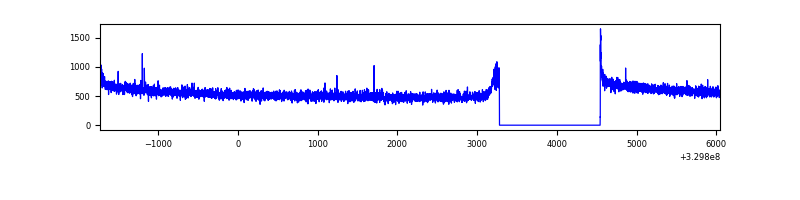 |
| D | 7777 | 6513 | 52 | 52 | 0.67% | 0.80% | 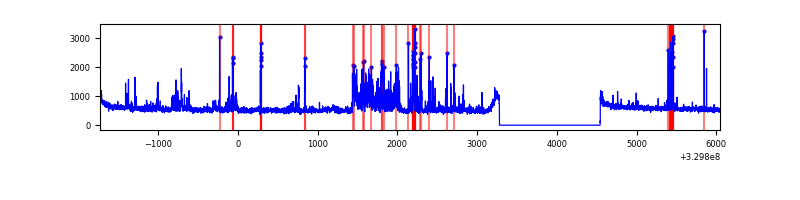 |
Top three noisy pixels from each quadrant. If the there are fewer than three noisy pixels in the level2.evt file, extra rows are filled as -1
| Pixel properties | Quadrant properties | ||||||
|---|---|---|---|---|---|---|---|
| Quadrant | DetID | PixID | Counts | Sigma | Mean | Median | Sigma |
| A | 6 | 16 | 42835 | 232.33 | 920 | 904 | 180.5 |
| A | 13 | 254 | 9016 | 44.95 | 920 | 904 | 180.5 |
| A | 0 | 226 | 7982 | 39.22 | 920 | 904 | 180.5 |
| B | 12 | 111 | 20016 | 114.78 | 906 | 885 | 166.7 |
| B | 11 | 111 | 18332 | 104.68 | 906 | 885 | 166.7 |
| B | 14 | 111 | 17310 | 98.55 | 906 | 885 | 166.7 |
| C | 14 | 238 | 144072 | 704.8 | 884 | 892 | 203.2 |
| C | 0 | 10 | 9426 | 42.01 | 884 | 892 | 203.2 |
| C | 2 | 16 | 6653 | 28.36 | 884 | 892 | 203.2 |
| D | 1 | 52 | 481385 | 2264.39 | 893 | 871 | 212.2 |
| D | 2 | 82 | 127480 | 596.64 | 893 | 871 | 212.2 |
| D | 8 | 195 | 112017 | 523.77 | 893 | 871 | 212.2 |
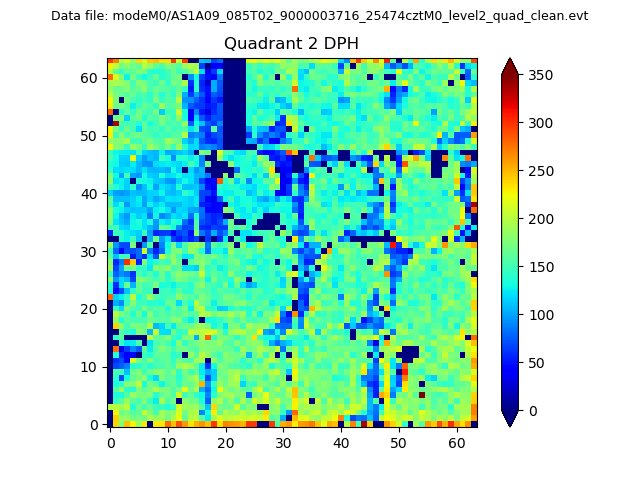
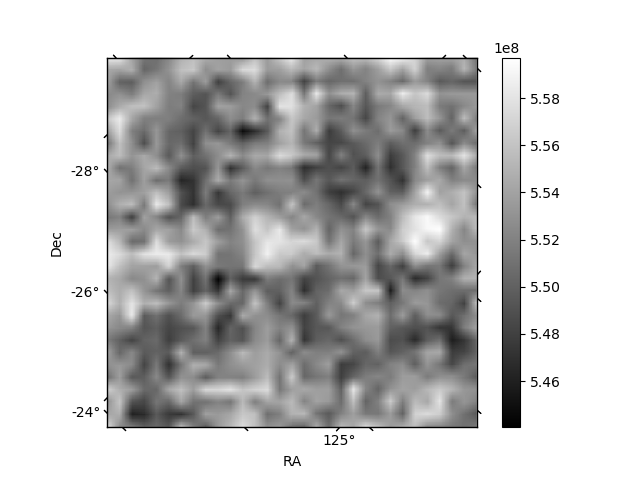
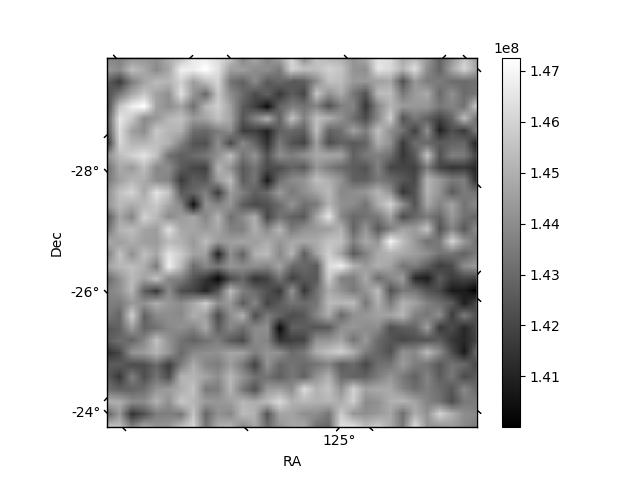
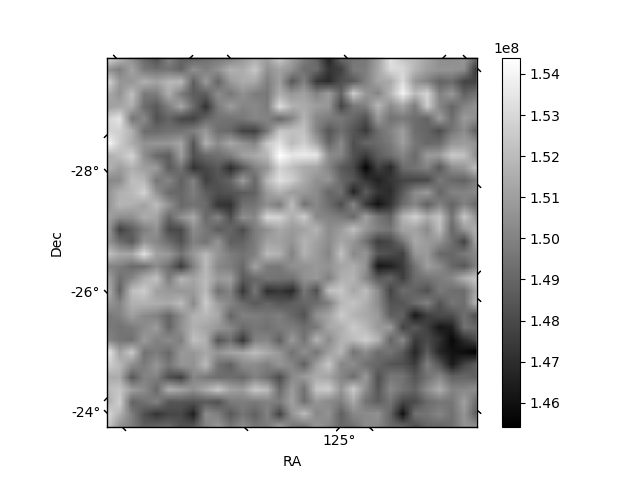
Histogram calculated using DETX and DETY for each event in the final _common_clean file
| Quadrant A | 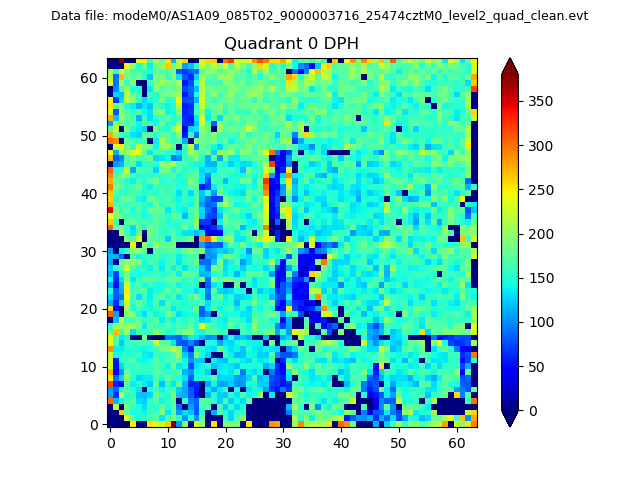 |
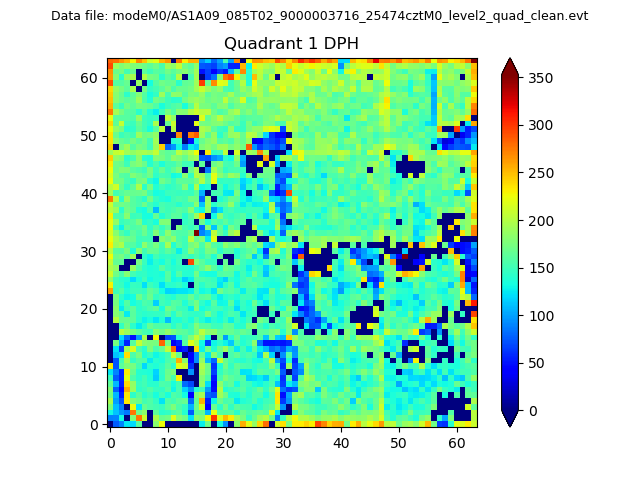 |
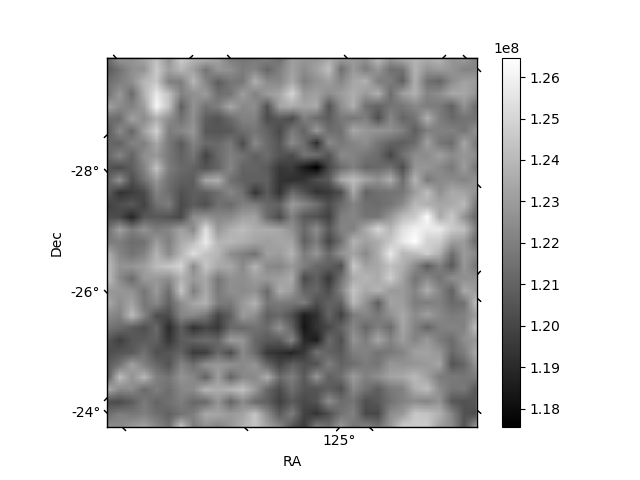
Quadrant B |
|---|---|---|---|
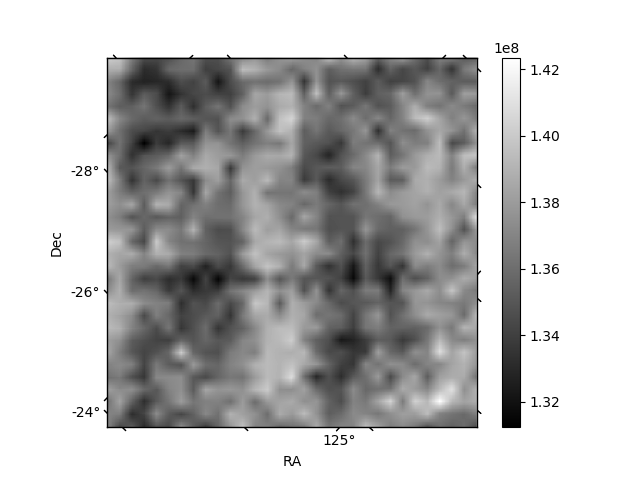
| Quadrant D | 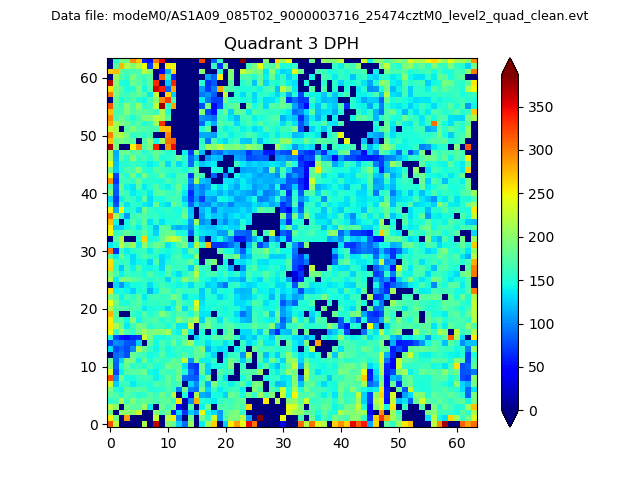 |
 |
Quadrant C |
| Plot type | Count rate plots | Images |
|---|---|---|
| Comparison with Poisson distribution Blue bars denote a histogram of data divided into 1 sec bins. Red curve is a Poisson curve with rate = median count rate of data. |
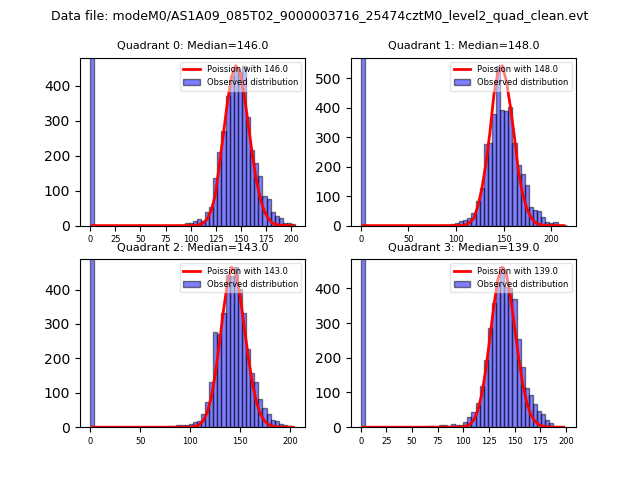 |
 |
| Quadrant-wise count rates Data is divided into 100 sec bins |
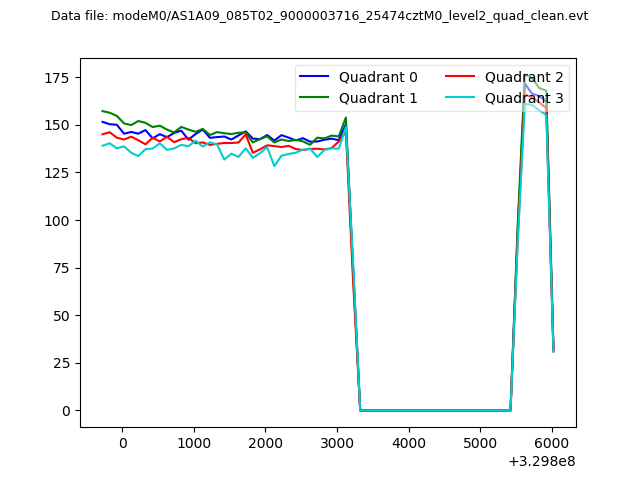 |
|
| Module-wise count rates for Quadrant A Data is divided into 100 sec bins |
 |
 |
| Module-wise count rates for Quadrant B Data is divided into 100 sec bins |
 |
 |
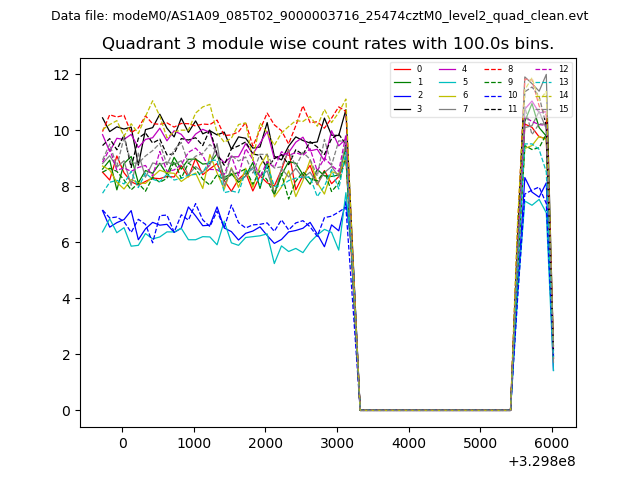
| Module-wise count rates for Quadrant C Data is divided into 100 sec bins |
 |
 |
| Module-wise count rates for Quadrant D Data is divided into 100 sec bins |
 |
 |
| Parameter | Plot |
|---|---|
| CZT HV Monitor | 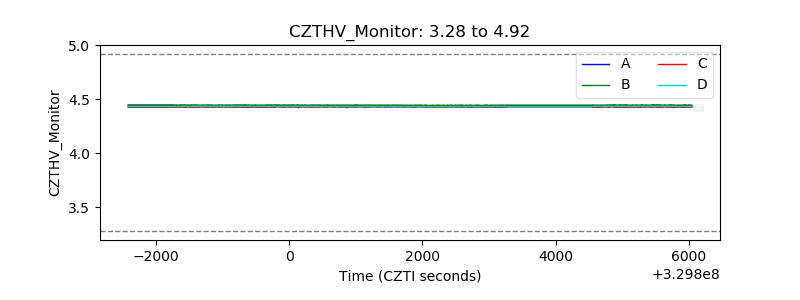 |
| D_VDD | 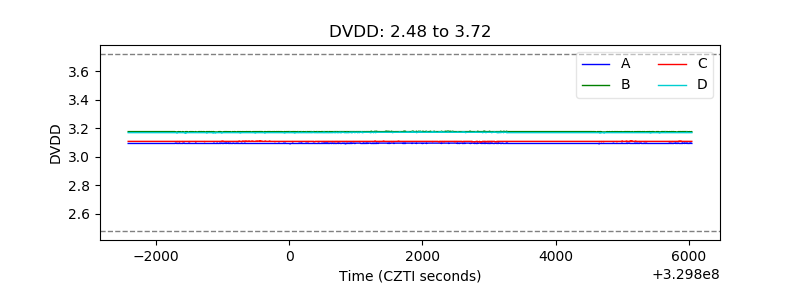 |
| Temperature 1 | 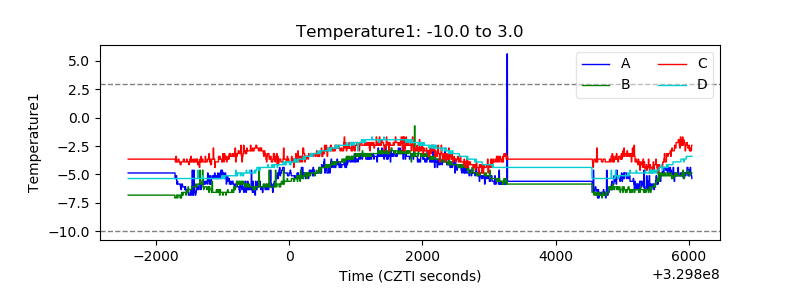 |
| Veto HV Monitor | 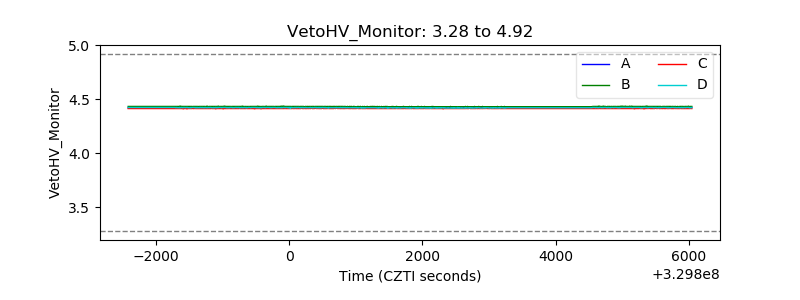 |
| Veto LLD | 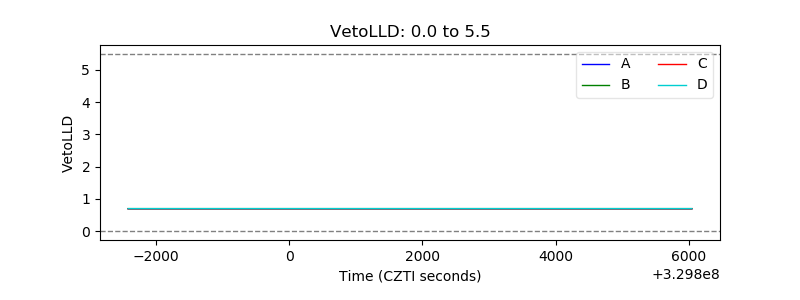 |
| Alpha Counter | 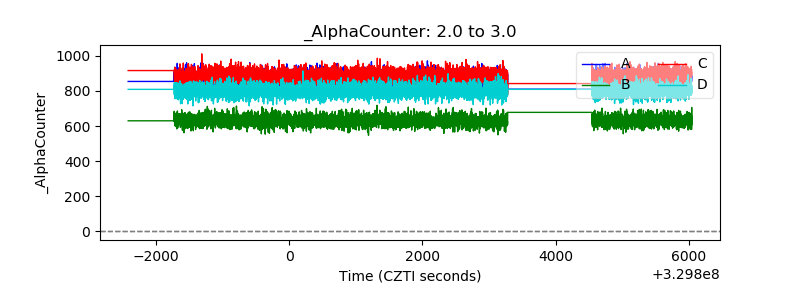 |
| _CPM_Rate | 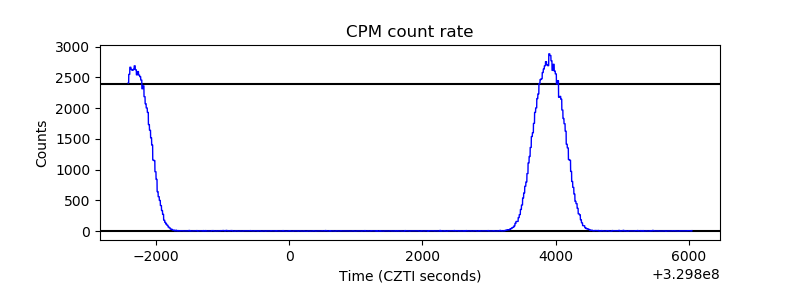 |
| CZT Counter | 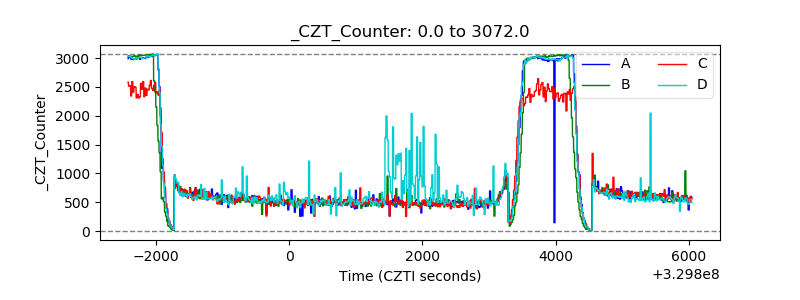 |
| +2.5 Volts monitor |  |
| +5 Volts monitor |  |
| _ROLL_ROT | 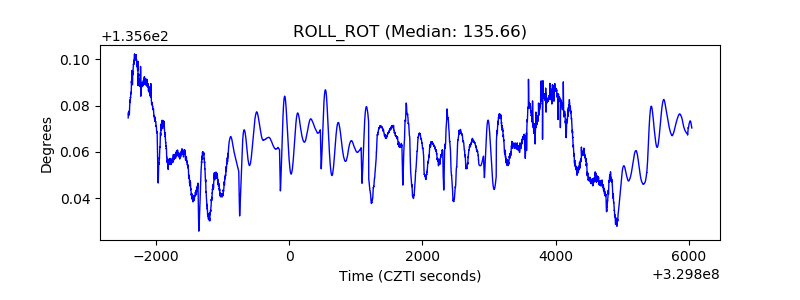 |
| _Roll_DEC | 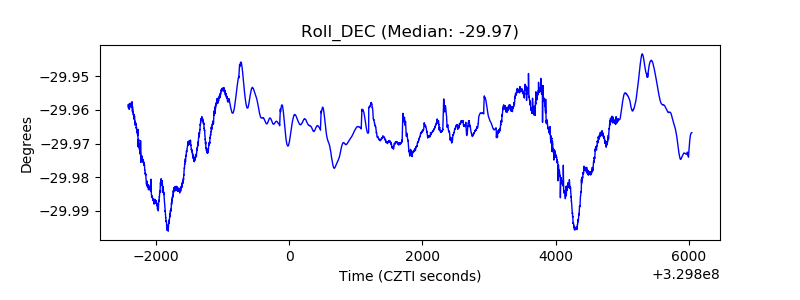 |
| _Roll_RA | 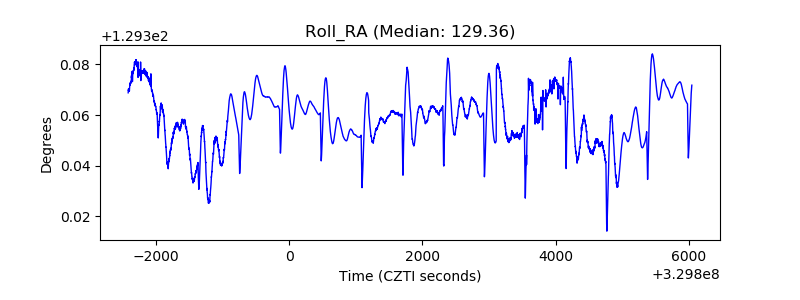 |
| Veto Counter | 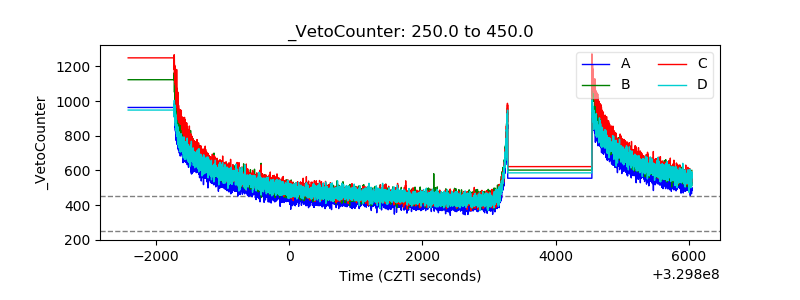 |