| Param | Original file | Final file |
|---|---|---|
| Filename | modeM0/AS1A09_085T02_9000003716_25475cztM0_level2.evt | modeM0/AS1A09_085T02_9000003716_25475cztM0_level2_quad_clean.evt |
| Size (bytes) | 436,599,360 | 102,407,040 |
| Size | 416.4 MB | 97.7 MB |
| Events in quadrant A | 3,134,191 | 687,776 |
| Events in quadrant B | 3,141,146 | 693,158 |
| Events in quadrant C | 3,173,481 | 668,999 |
| Events in quadrant D | 3,387,039 | 653,760 |
| Mode M9 | |||
|---|---|---|---|
| Quadrant | BADHDUFLAG | Total packets | Discarded packets |
| A | 0 | 13 | 0 |
| B | 0 | 13 | 0 |
| C | 0 | 13 | 0 |
| D | 0 | 13 | 0 |
| Mode M0 | |||
|---|---|---|---|
| Quadrant | BADHDUFLAG | Total packets | Discarded packets |
| A | 0 | 12804 | 0 |
| B | 0 | 12845 | 0 |
| C | 0 | 13036 | 0 |
| D | 0 | 13503 | 0 |
| Quadrant | Total seconds | Saturated seconds | Saturation percentage |
|---|---|---|---|
| A | 5689 | 96 | 1.687467% |
| B | 5690 | 113 | 1.985940% |
| C | 5690 | 148 | 2.601054% |
| D | 5690 | 142 | 2.495606% |
Noise dominated data is calculated using 1-second bins in cleaned event files. If a bin has >2000 counts, and if more than 50% of those come from <1% of pixels, then it is considered to be noise-dominated and hence unusable.
| Quadrant | # 1 sec bins | Bins with >0 counts | Bins with >2000 counts | High rate bins dominated by noise | Noise dominated (total time) | Noise dominated (detector-on time) | Marked lightcurve |
|---|---|---|---|---|---|---|---|
| A | 6984 | 5690 | 0 | 0 | 0.00% | 0.00% | 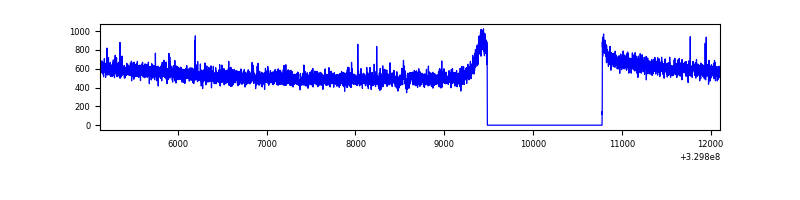 |
| B | 6985 | 5691 | 0 | 0 | 0.00% | 0.00% | 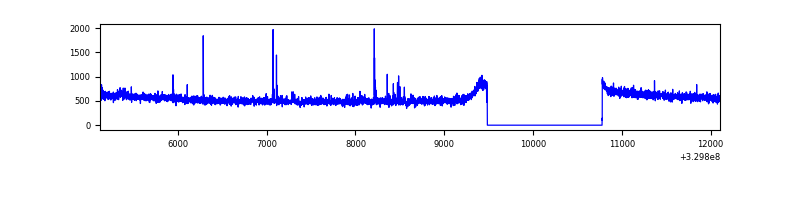 |
| C | 6985 | 5691 | 0 | 0 | 0.00% | 0.00% | 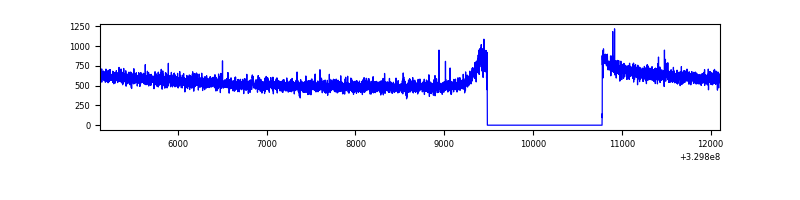 |
| D | 6985 | 5691 | 53 | 53 | 0.76% | 0.93% | 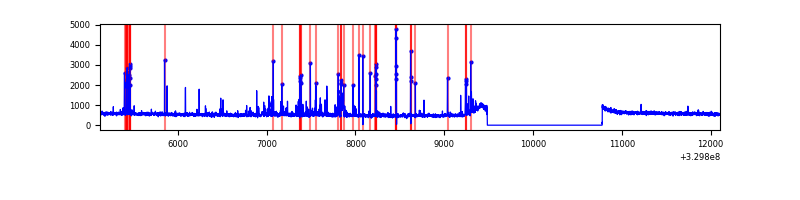 |
Top three noisy pixels from each quadrant. If the there are fewer than three noisy pixels in the level2.evt file, extra rows are filled as -1
| Pixel properties | Quadrant properties | ||||||
|---|---|---|---|---|---|---|---|
| Quadrant | DetID | PixID | Counts | Sigma | Mean | Median | Sigma |
| A | 13 | 254 | 8623 | 48.69 | 812 | 800 | 160.7 |
| A | 0 | 226 | 6992 | 38.54 | 812 | 800 | 160.7 |
| A | 3 | 137 | 6730 | 36.91 | 812 | 800 | 160.7 |
| B | 0 | 190 | 18285 | 118.97 | 795 | 779 | 147.2 |
| B | 12 | 111 | 17410 | 113.02 | 795 | 779 | 147.2 |
| B | 11 | 111 | 16026 | 103.61 | 795 | 779 | 147.2 |
| C | 14 | 238 | 126526 | 704.62 | 779 | 784 | 178.5 |
| C | 2 | 16 | 12625 | 66.35 | 779 | 784 | 178.5 |
| C | 13 | 61 | 5352 | 25.6 | 779 | 784 | 178.5 |
| D | 1 | 52 | 254249 | 1335.24 | 792 | 772 | 189.8 |
| D | 2 | 82 | 98750 | 516.12 | 792 | 772 | 189.8 |
| D | 8 | 195 | 35881 | 184.94 | 792 | 772 | 189.8 |
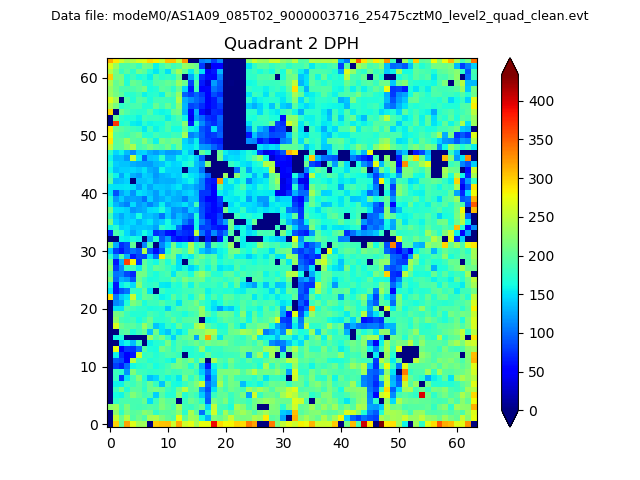
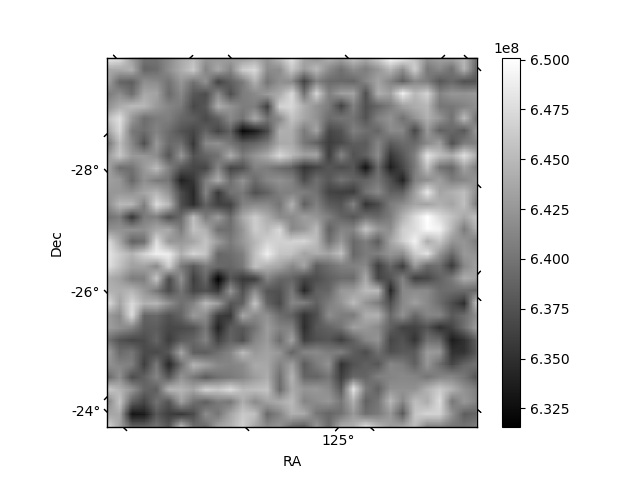
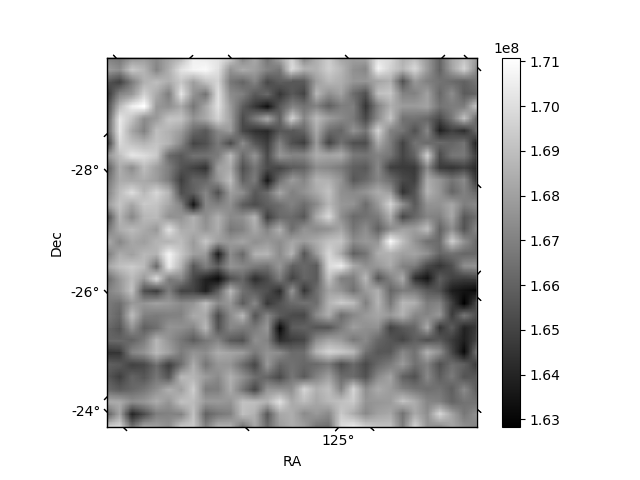
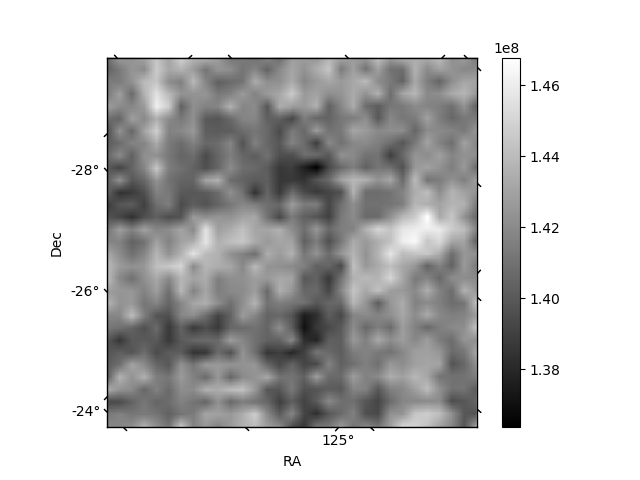
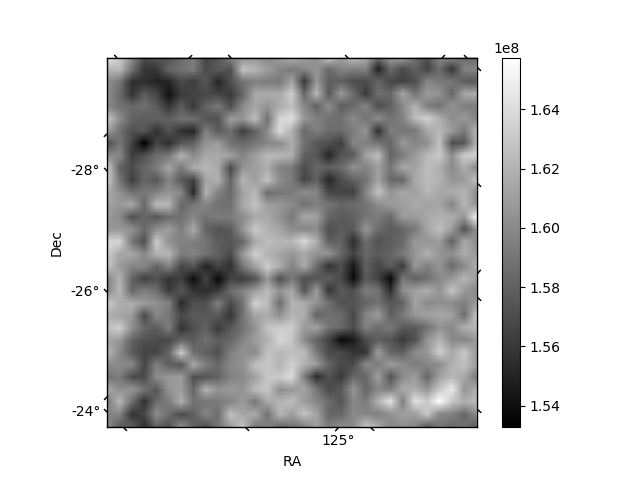
Histogram calculated using DETX and DETY for each event in the final _common_clean file
| Quadrant A | 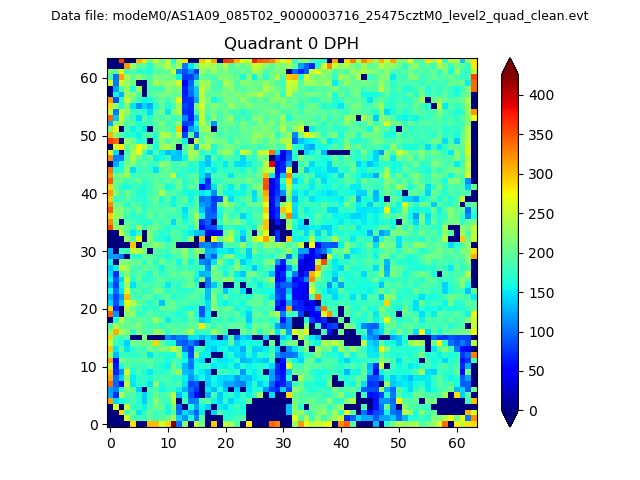 |
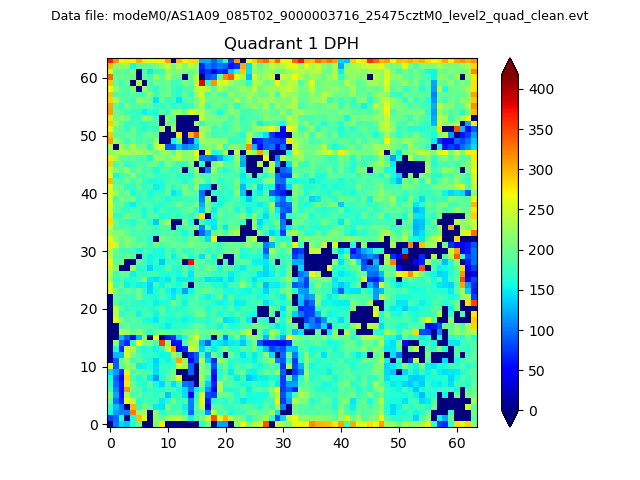 |
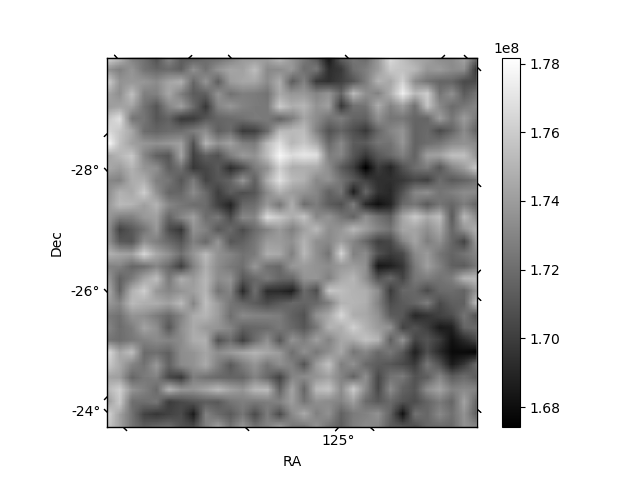
Quadrant B |
|---|---|---|---|
| Quadrant D | 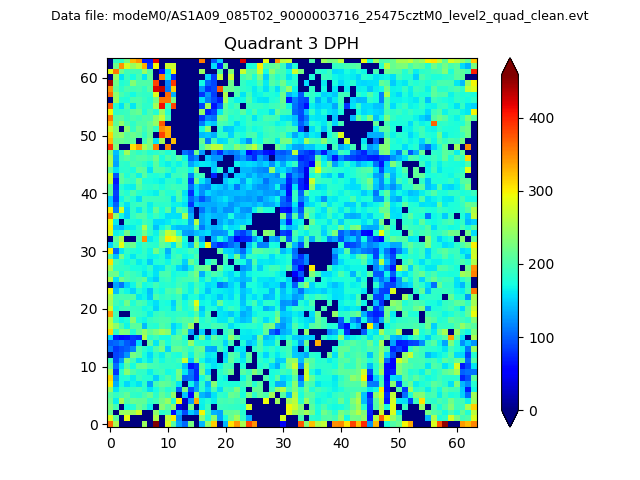 |
 |
Quadrant C |
| Plot type | Count rate plots | Images |
|---|---|---|
| Comparison with Poisson distribution Blue bars denote a histogram of data divided into 1 sec bins. Red curve is a Poisson curve with rate = median count rate of data. |
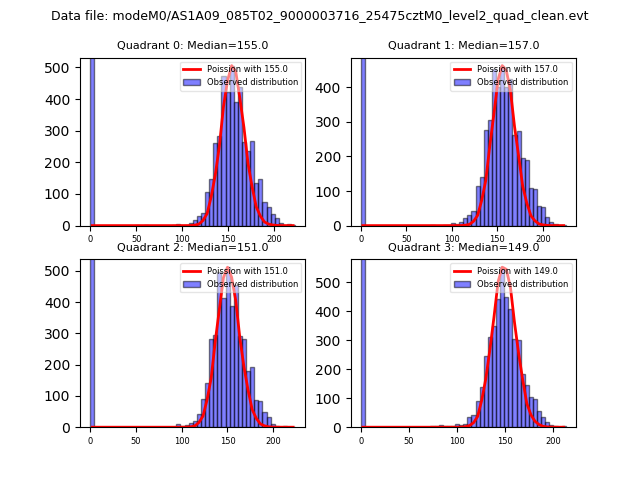 |
 |
| Quadrant-wise count rates Data is divided into 100 sec bins |
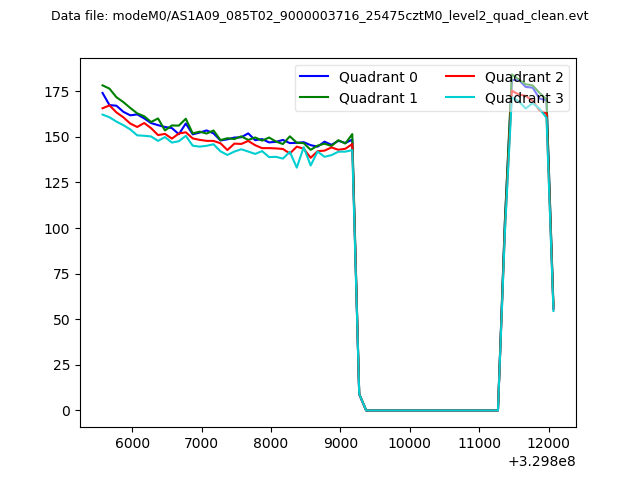 |
|
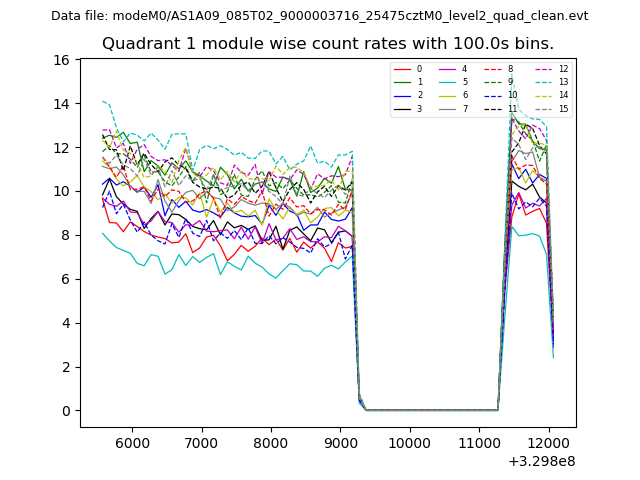
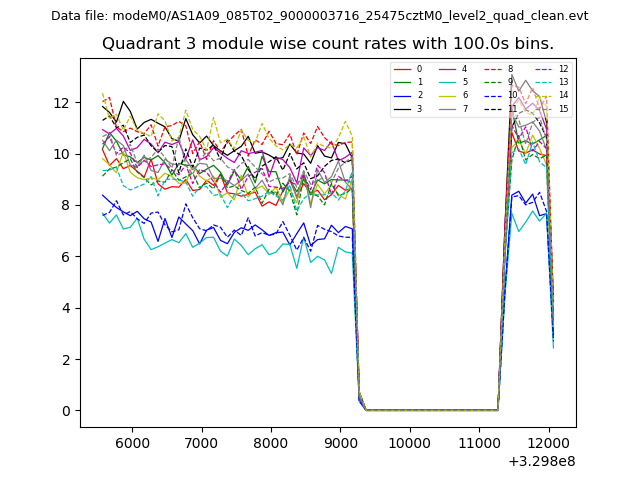
| Module-wise count rates for Quadrant A Data is divided into 100 sec bins |
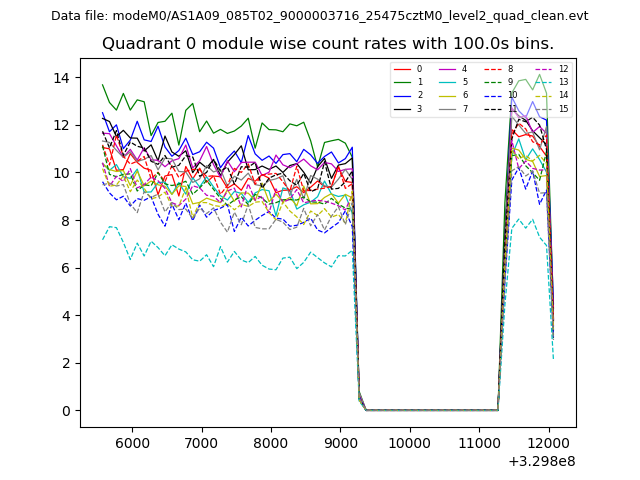 |
 |
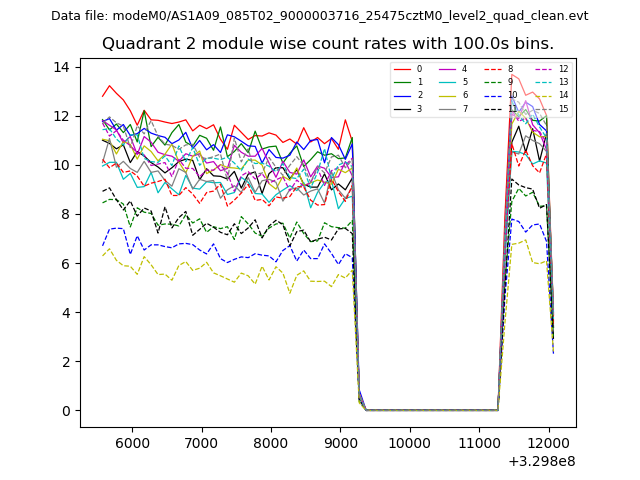
| Module-wise count rates for Quadrant B Data is divided into 100 sec bins |
 |
 |
| Module-wise count rates for Quadrant C Data is divided into 100 sec bins |
 |
 |
| Module-wise count rates for Quadrant D Data is divided into 100 sec bins |
 |
 |
| Parameter | Plot |
|---|---|
| CZT HV Monitor | 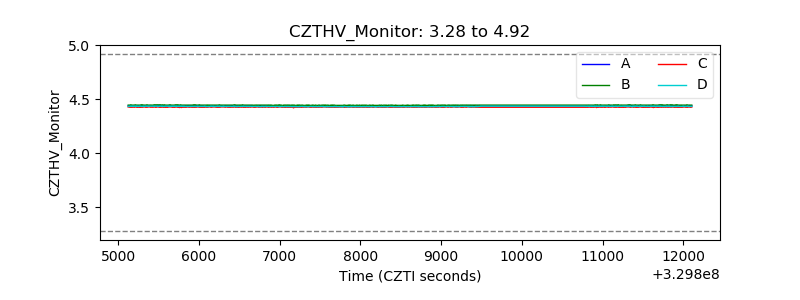 |
| D_VDD | 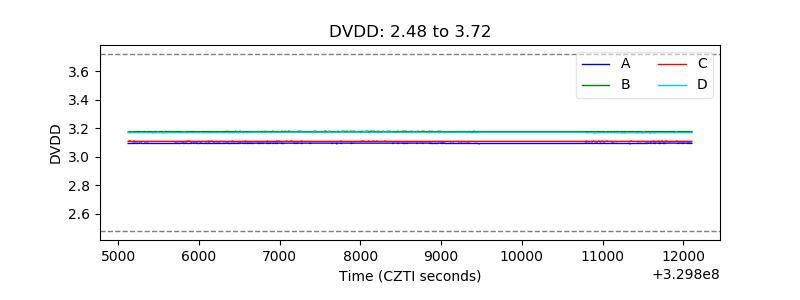 |
| Temperature 1 | 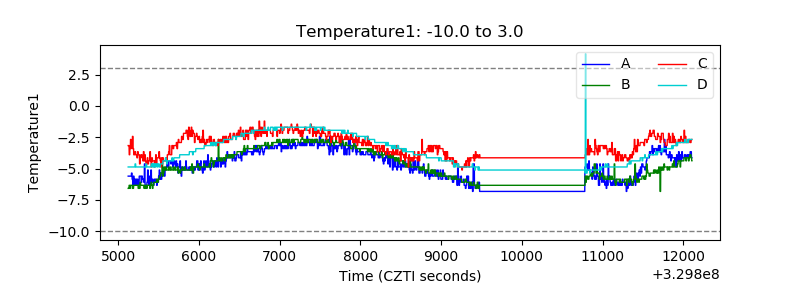 |
| Veto HV Monitor | 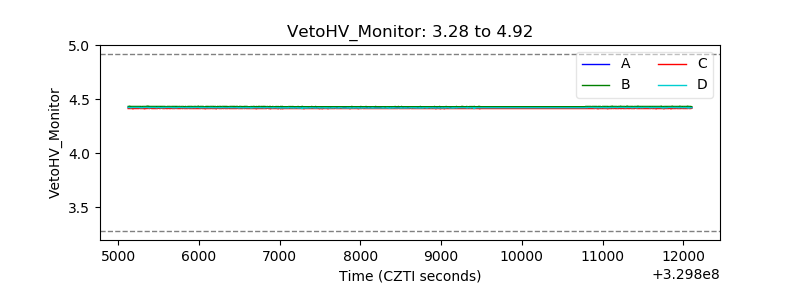 |
| Veto LLD | 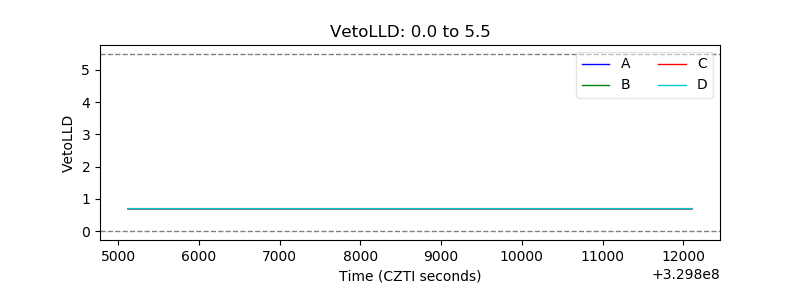 |
| Alpha Counter |  |
| _CPM_Rate | 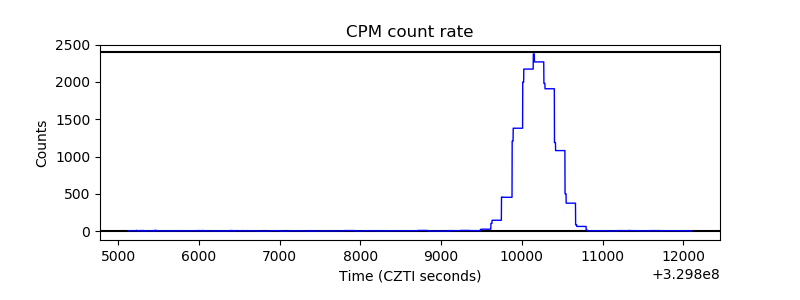 |
| CZT Counter | 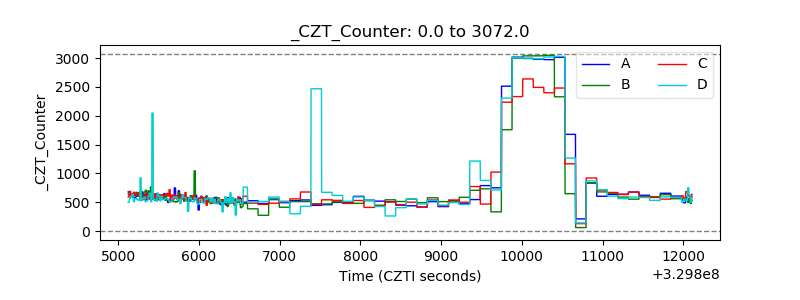 |
| +2.5 Volts monitor | 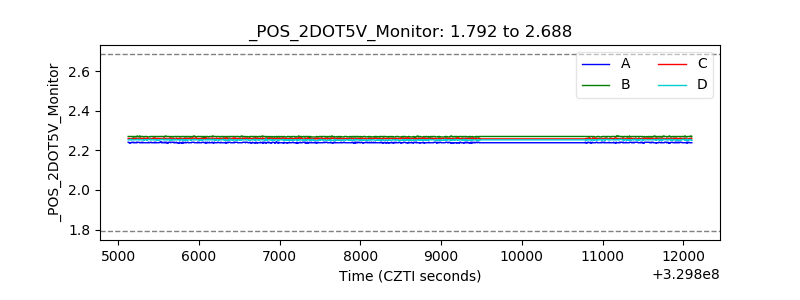 |
| +5 Volts monitor |  |
| _ROLL_ROT | 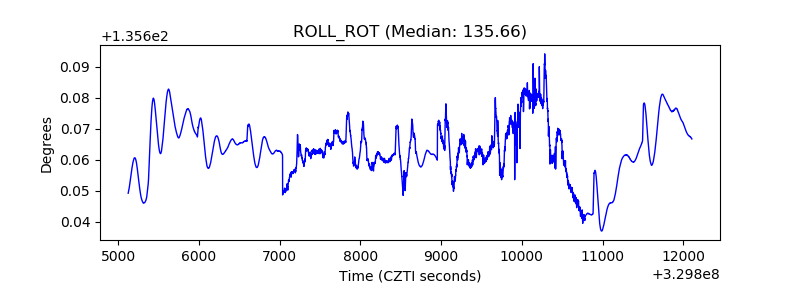 |
| _Roll_DEC | 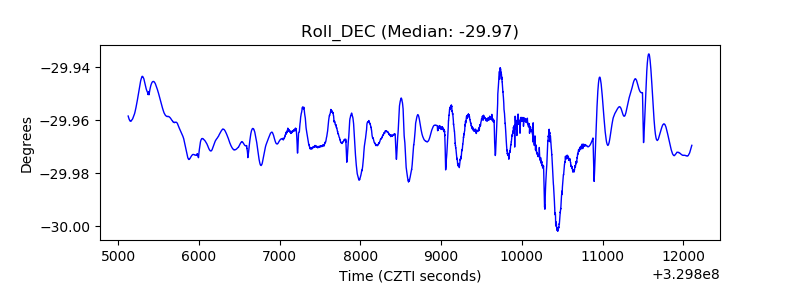 |
| _Roll_RA | 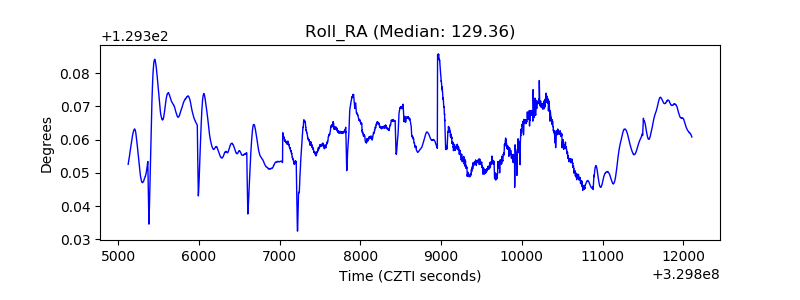 |
| Veto Counter | 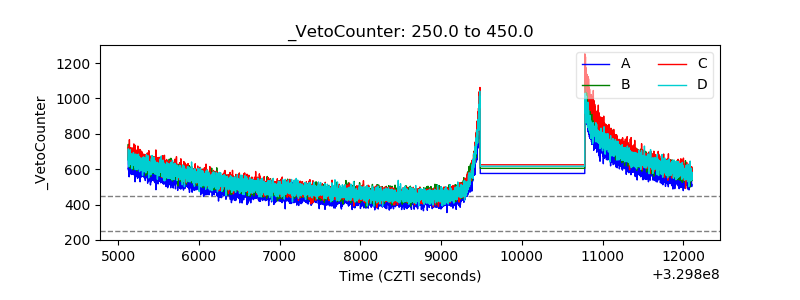 |