| Param | Original file | Final file |
|---|---|---|
| Filename | modeM0/AS1A09_085T02_9000003716_25476cztM0_level2.evt | modeM0/AS1A09_085T02_9000003716_25476cztM0_level2_quad_clean.evt |
| Size (bytes) | 483,552,000 | 113,595,840 |
| Size | 461.2 MB | 108.3 MB |
| Events in quadrant A | 3,436,274 | 768,499 |
| Events in quadrant B | 3,412,127 | 768,032 |
| Events in quadrant C | 3,669,170 | 739,570 |
| Events in quadrant D | 3,705,394 | 730,794 |
| Mode M9 | |||
|---|---|---|---|
| Quadrant | BADHDUFLAG | Total packets | Discarded packets |
| A | 0 | 13 | 0 |
| B | 0 | 13 | 0 |
| C | 0 | 13 | 0 |
| D | 0 | 13 | 0 |
| Mode M0 | |||
|---|---|---|---|
| Quadrant | BADHDUFLAG | Total packets | Discarded packets |
| A | 0 | 14147 | 0 |
| B | 0 | 14000 | 0 |
| C | 0 | 14984 | 0 |
| D | 0 | 14943 | 0 |
| Quadrant | Total seconds | Saturated seconds | Saturation percentage |
|---|---|---|---|
| A | 6213 | 66 | 1.062289% |
| B | 6213 | 90 | 1.448576% |
| C | 6213 | 232 | 3.734106% |
| D | 6214 | 79 | 1.271323% |
Noise dominated data is calculated using 1-second bins in cleaned event files. If a bin has >2000 counts, and if more than 50% of those come from <1% of pixels, then it is considered to be noise-dominated and hence unusable.
| Quadrant | # 1 sec bins | Bins with >0 counts | Bins with >2000 counts | High rate bins dominated by noise | Noise dominated (total time) | Noise dominated (detector-on time) | Marked lightcurve |
|---|---|---|---|---|---|---|---|
| A | 7553 | 6214 | 0 | 0 | 0.00% | 0.00% | 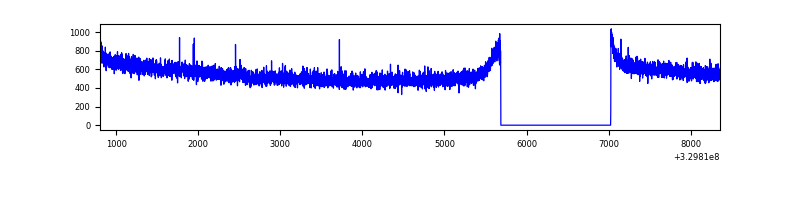 |
| B | 7553 | 6214 | 1 | 1 | 0.01% | 0.02% | 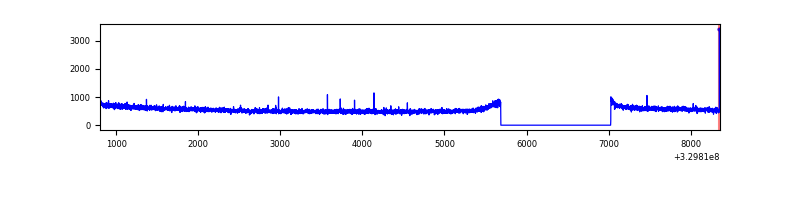 |
| C | 7553 | 6214 | 43 | 43 | 0.57% | 0.69% | 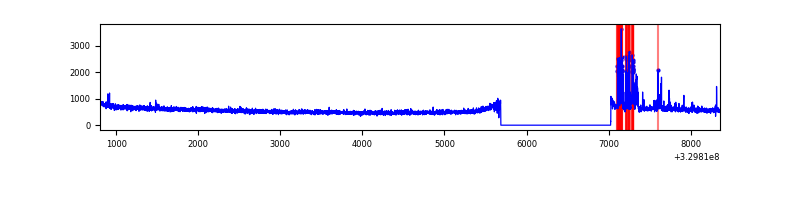 |
| D | 7554 | 6215 | 24 | 24 | 0.32% | 0.39% | 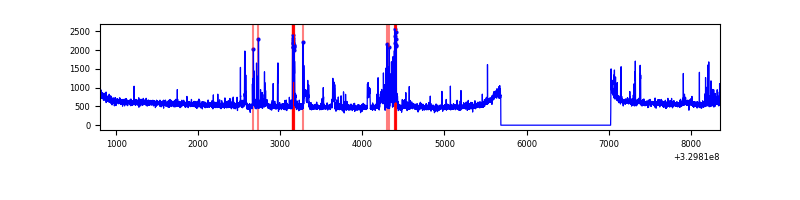 |
Top three noisy pixels from each quadrant. If the there are fewer than three noisy pixels in the level2.evt file, extra rows are filled as -1
| Pixel properties | Quadrant properties | ||||||
|---|---|---|---|---|---|---|---|
| Quadrant | DetID | PixID | Counts | Sigma | Mean | Median | Sigma |
| A | 13 | 254 | 8996 | 46.52 | 892 | 880 | 174.5 |
| A | 0 | 226 | 7640 | 38.75 | 892 | 880 | 174.5 |
| A | 3 | 137 | 7244 | 36.48 | 892 | 880 | 174.5 |
| B | 12 | 111 | 18872 | 110.19 | 869 | 850 | 163.6 |
| B | 11 | 111 | 17222 | 100.1 | 869 | 850 | 163.6 |
| B | 14 | 111 | 16015 | 92.72 | 869 | 850 | 163.6 |
| C | 2 | 16 | 232917 | 1199.91 | 845 | 854 | 193.4 |
| C | 14 | 238 | 139077 | 714.7 | 845 | 854 | 193.4 |
| C | 13 | 61 | 5886 | 26.02 | 845 | 854 | 193.4 |
| D | 9 | 35 | 183815 | 886.41 | 870 | 847 | 206.4 |
| D | 1 | 52 | 92267 | 442.89 | 870 | 847 | 206.4 |
| D | 8 | 195 | 51663 | 246.18 | 870 | 847 | 206.4 |
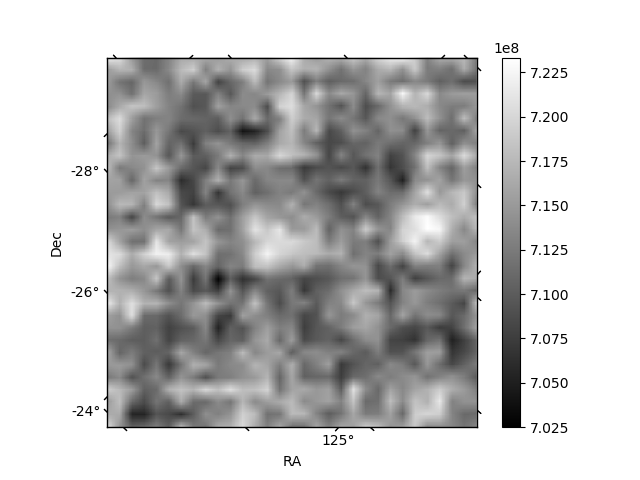
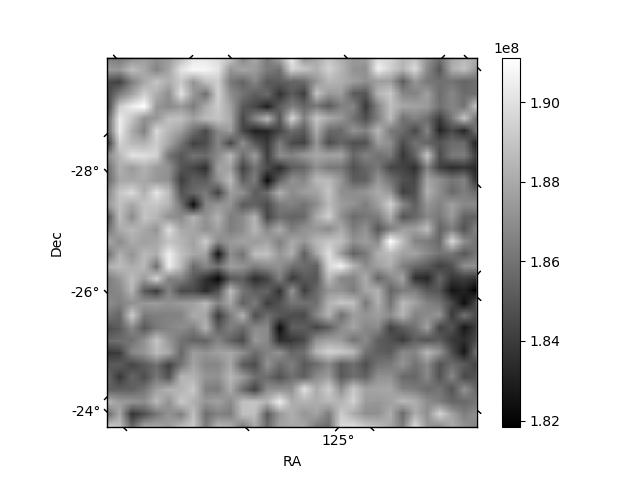
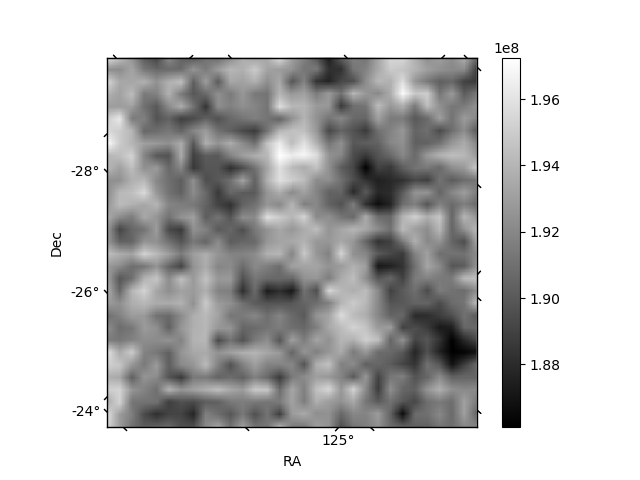
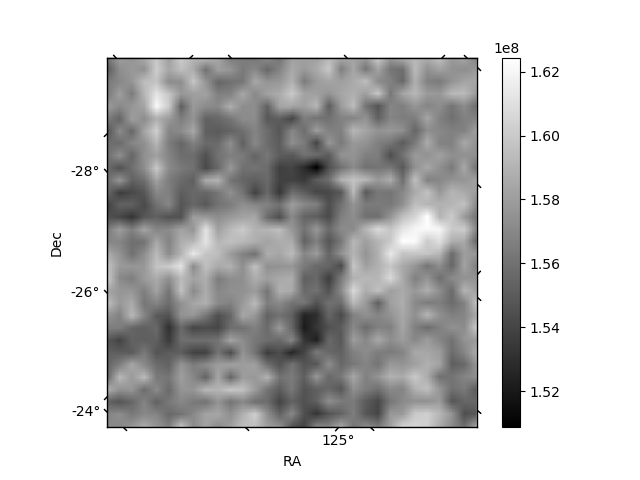
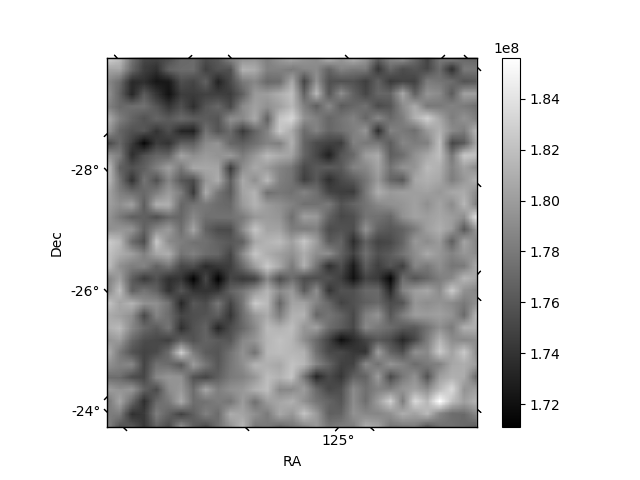
Histogram calculated using DETX and DETY for each event in the final _common_clean file
| Quadrant A | 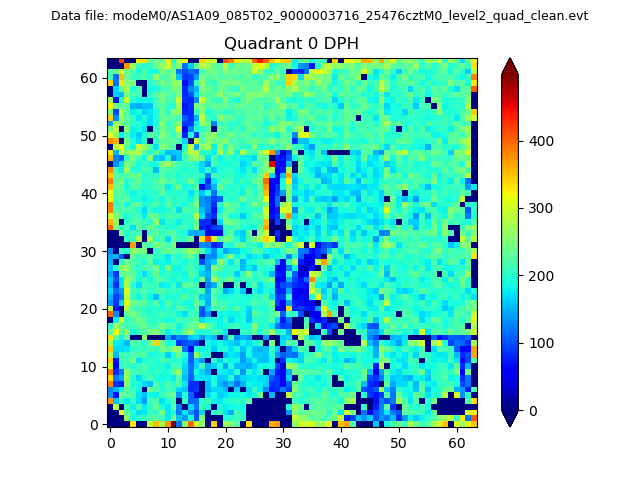 |
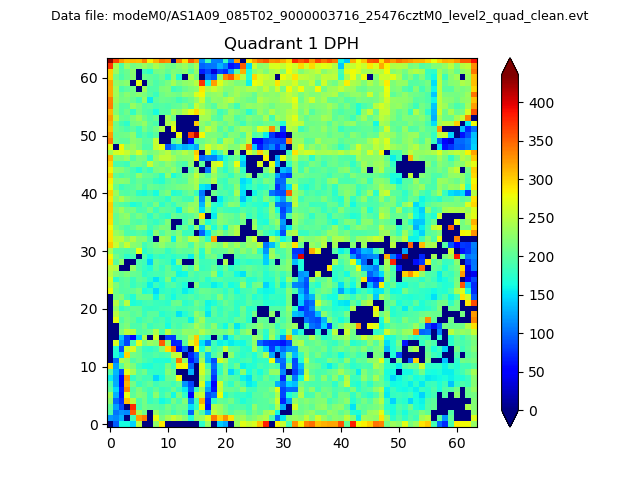 |
Quadrant B |
|---|---|---|---|
| Quadrant D |  |
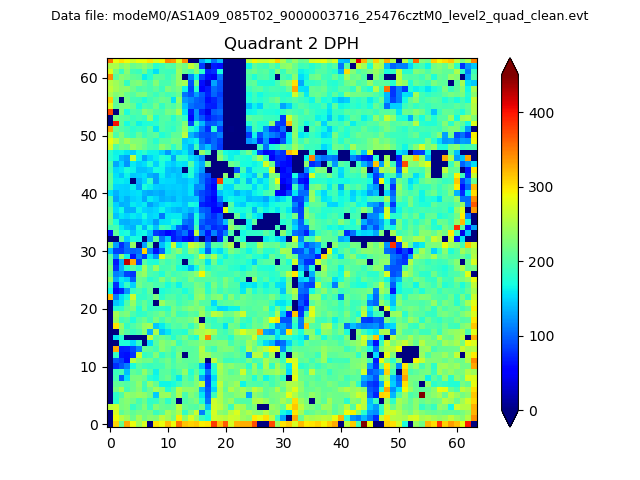 |
Quadrant C |
| Plot type | Count rate plots | Images |
|---|---|---|
| Comparison with Poisson distribution Blue bars denote a histogram of data divided into 1 sec bins. Red curve is a Poisson curve with rate = median count rate of data. |
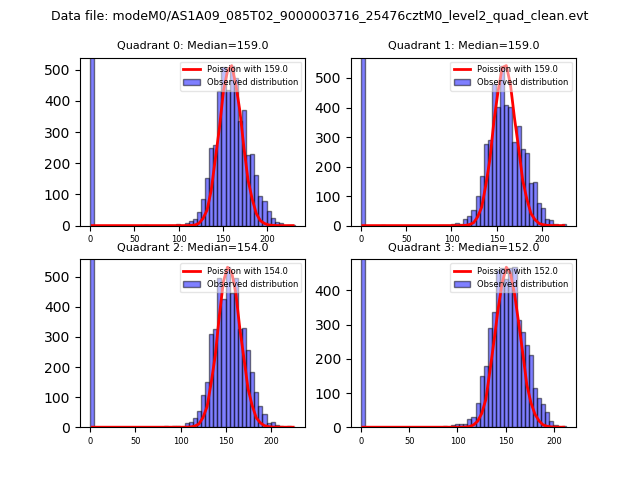 |
 |
| Quadrant-wise count rates Data is divided into 100 sec bins |
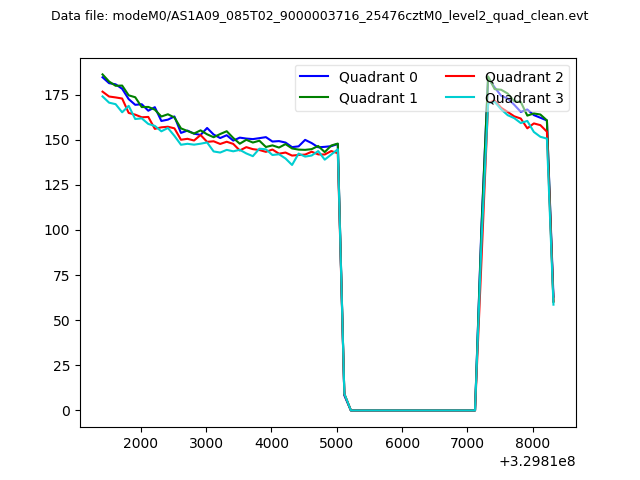 |
|
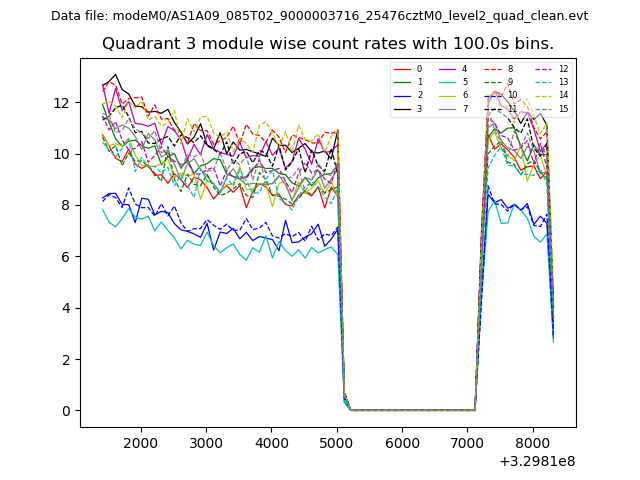
| Module-wise count rates for Quadrant A Data is divided into 100 sec bins |
 |
 |
| Module-wise count rates for Quadrant B Data is divided into 100 sec bins |
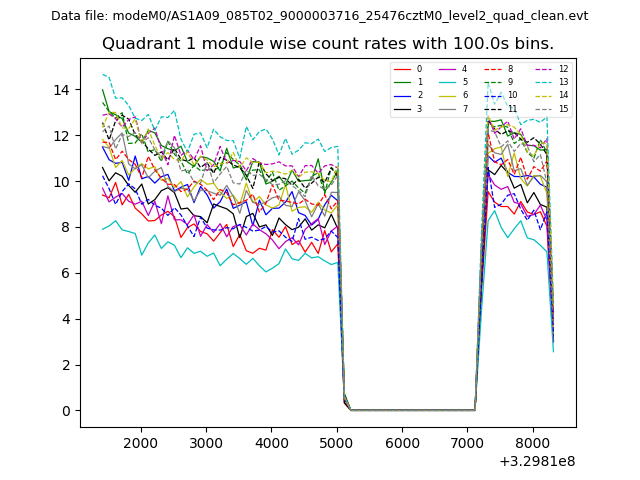 |
 |
| Module-wise count rates for Quadrant C Data is divided into 100 sec bins |
 |
 |
| Module-wise count rates for Quadrant D Data is divided into 100 sec bins |
 |
 |
| Parameter | Plot |
|---|---|
| CZT HV Monitor | 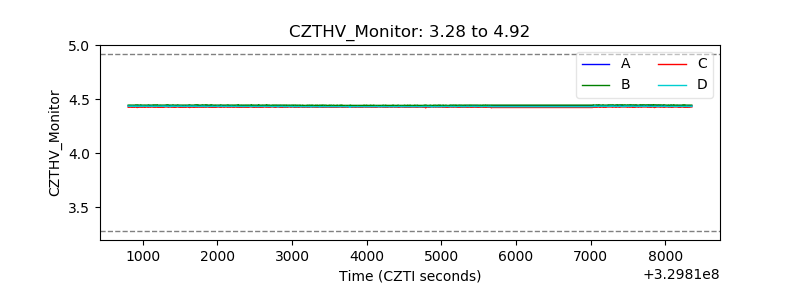 |
| D_VDD | 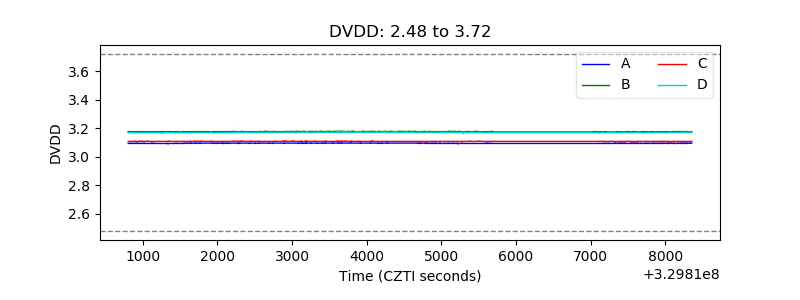 |
| Temperature 1 | 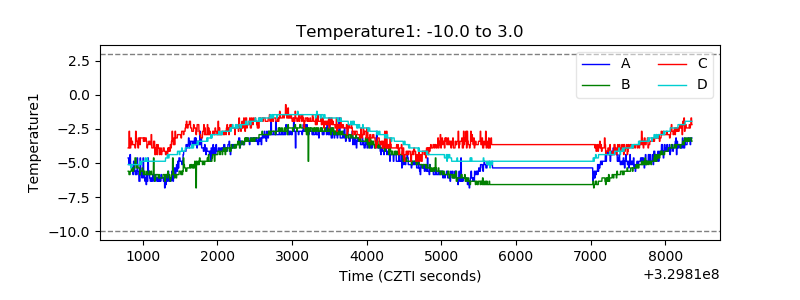 |
| Veto HV Monitor | 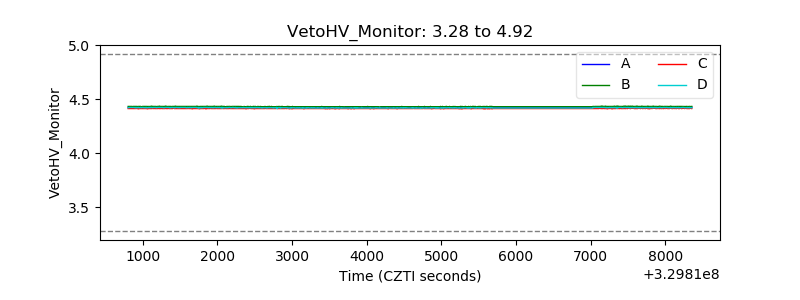 |
| Veto LLD | 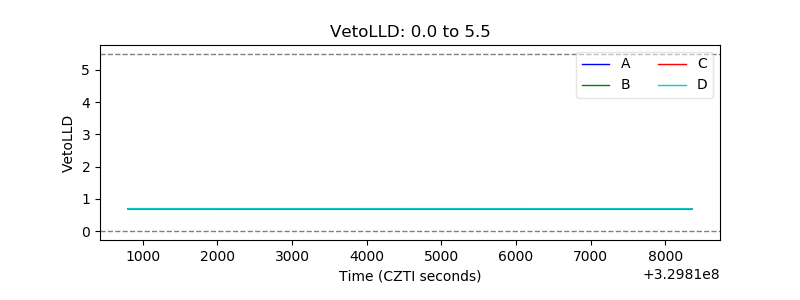 |
| Alpha Counter | 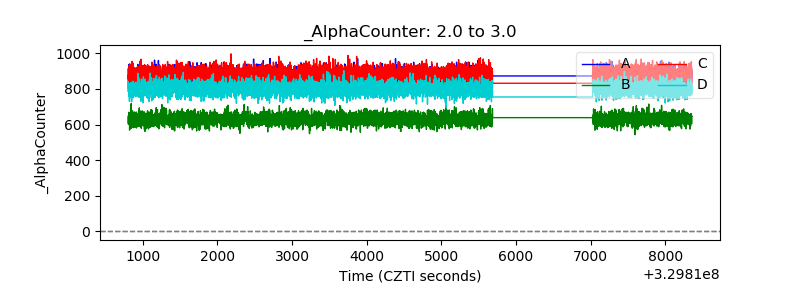 |
| _CPM_Rate | 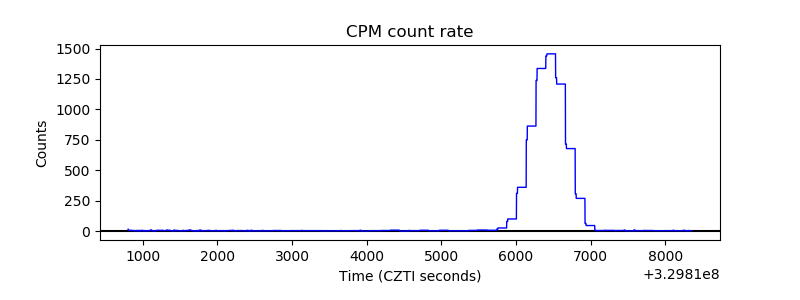 |
| CZT Counter | 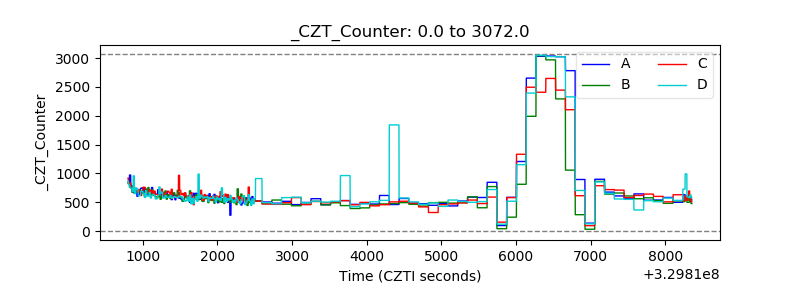 |
| +2.5 Volts monitor | 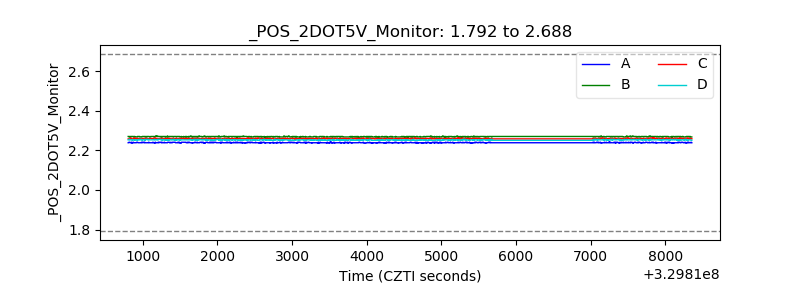 |
| +5 Volts monitor | 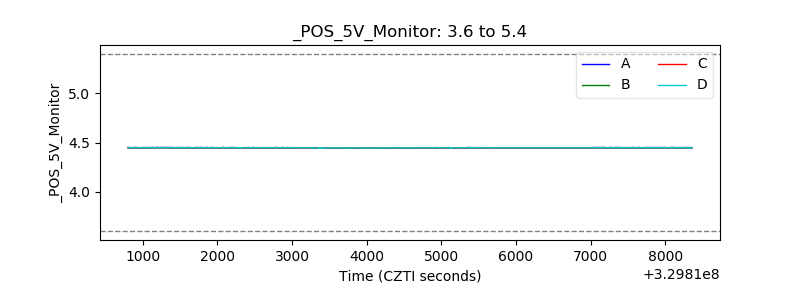 |
| _ROLL_ROT | 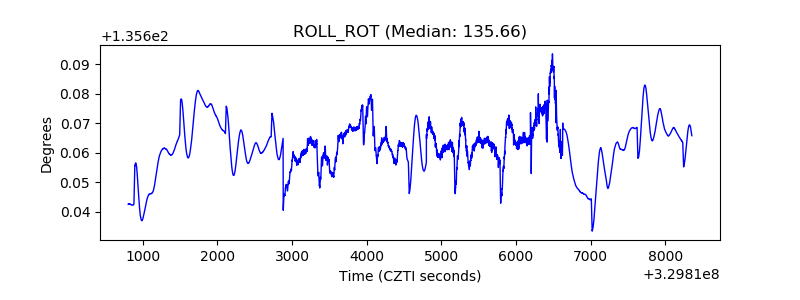 |
| _Roll_DEC | 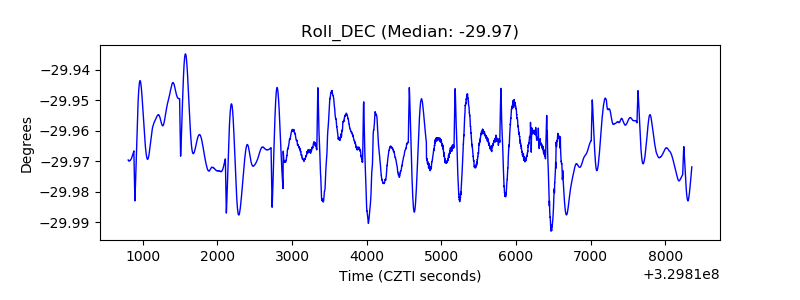 |
| _Roll_RA | 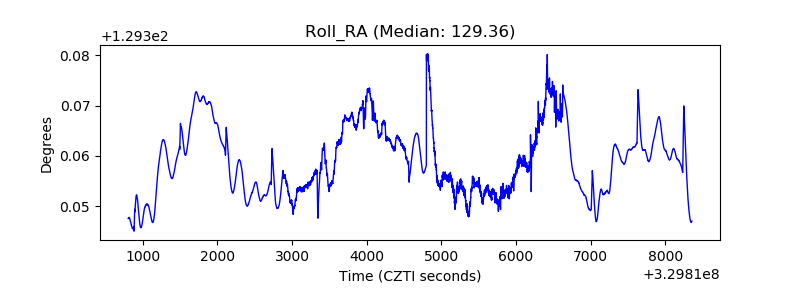 |
| Veto Counter | 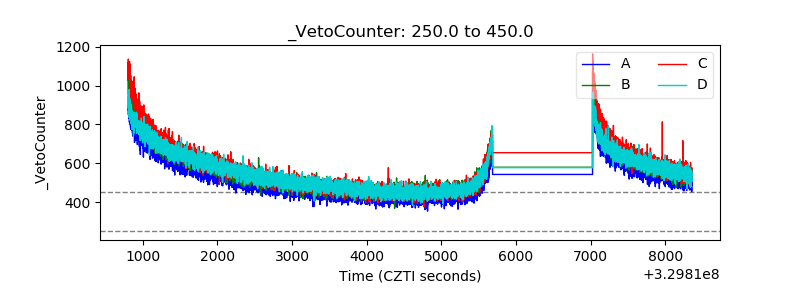 |